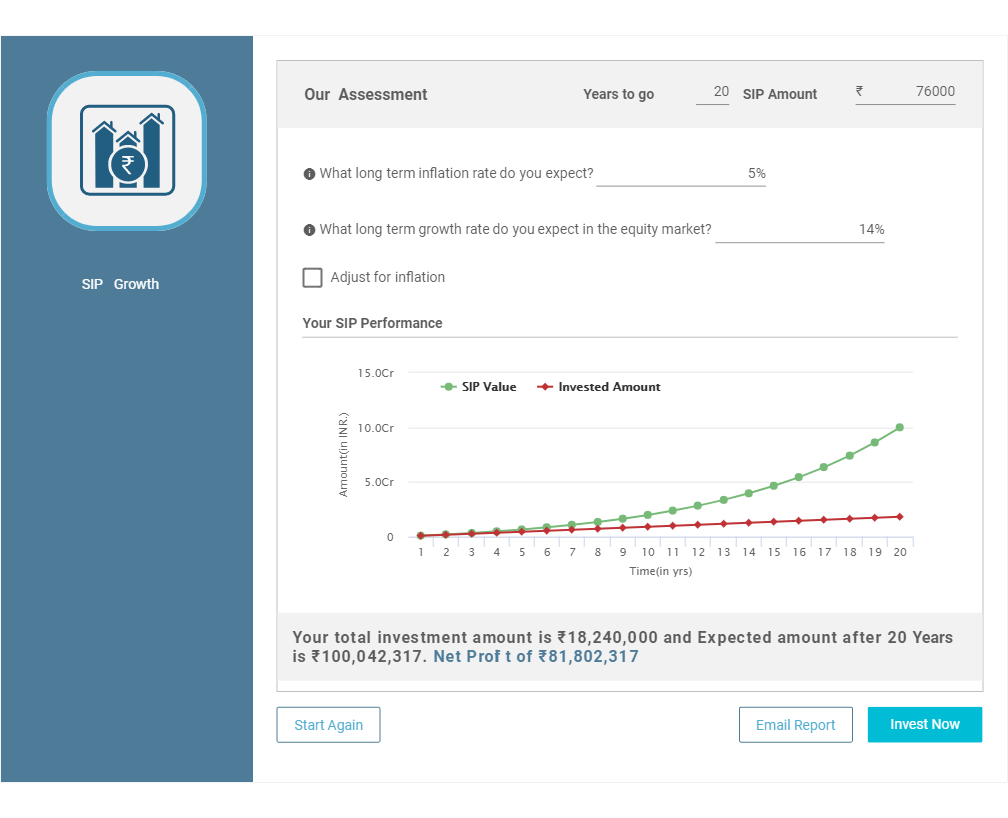
முதலீடு செய்து 1 கோடி பெறுவது எப்படி
மாதாந்திர பரஸ்பர நிதிகள் SIP மூலம் முதலீடு செய்தல்
முதலீடு ஒரு வழியாக ஈக்விட்டி மியூச்சுவல் ஃபண்ட் திட்டத்தில்எஸ்ஐபி உங்கள் நீண்ட கால இலக்குகளை அடைய சிறந்த வழி. மற்ற சொத்து வகுப்புகளை விட ஈக்விட்டியில் சிறந்த வருமானத்தை வழங்க முடியும். வெல்லவும் உதவலாம்வீக்கம் நீண்ட கால இலக்குகளை அடைய இது அவசியம். அவர்கள் சாதகமான வரியையும் அனுபவிக்கிறார்கள். இப்போது, நீண்ட காலமூலதனம் ஒரு வருடத்தில் மேற்கொள்ளப்படும் முதலீடுகளின் மீதான ஆதாய வரி வரி இல்லாதது (FY 18-19 யூனியன் பட்ஜெட்டில் இருந்து 1st FEB வருடத்தில் 1 லட்சத்திற்கு மேல் லாபம் @ 10% வரி விதிக்கப்படும், அதாவது ஒரு நிதியாண்டில் ஒருவர் நீண்ட காலத்திற்கு 1.1 லட்சம் லாபம் பெற்றால்முதலீட்டு வரவுகள் 1,10க்கு வரி செலுத்த வேண்டும்.000 - 1,00,000 = 10,000. 10,000 = 1,000 இல் 10%வரிகள்)
Talk to our investment specialist
1 கோடி பெறுவது எப்படி
வெவ்வேறு காலகட்டங்களில் 1 கோடியை எவ்வாறு பெறுவது என்பதற்கான விளக்கப்படங்கள் கீழே உள்ளனSIP இல் முதலீடு (முறையானமுதலீட்டுத் திட்டம்) இன்சிறந்த பரஸ்பர நிதிகள்.
1. 20 ஆண்டுகளில் 1 கோடி பெறுவது எப்படி
மியூச்சுவல் ஃபண்டுகள் எஸ்ஐபி மூலம் முதலீடு செய்யத் தொடங்குங்கள் ரூ. மாதம் 7,600
நீங்கள் ஒவ்வொரு மாதமும் 7,600 ரூபாயை மிச்சப்படுத்தினால், உடனடியாக SIPஐத் தொடங்கவும்ஈக்விட்டி மியூச்சுவல் ஃபண்டுகள். திட்டங்களைத் தேர்ந்தெடுப்பதில் உங்களுக்கு உதவி தேவைப்பட்டால், எங்களின் பரிந்துரைக்கப்பட்ட ஈக்விட்டி மியூச்சுவல் ஃபண்ட் போர்ட்ஃபோலியோக்களை நீங்கள் சரிபார்த்து, உங்களின் அடிப்படையில் ஒரு போர்ட்ஃபோலியோவைத் தேர்ந்தெடுக்கலாம்.ஆபத்து பசியின்மை மற்றும் SIP தொகை. உங்கள் போர்ட்ஃபோலியோ என்றால்பரஸ்பர நிதி 14 சதவீத வருடாந்திர வருவாயை வழங்க நிர்வகிக்கிறது (இது குறைவாக உள்ளதுசிஏஜிஆர் 1979 ஆம் ஆண்டு தொடக்கத்தில் இருந்து SENSEX வழங்கியது), கீழே காட்டப்பட்டுள்ளபடி 20 ஆண்டுகளில் 1 கோடி ரூபாயை உங்களால் உருவாக்க முடியும்.
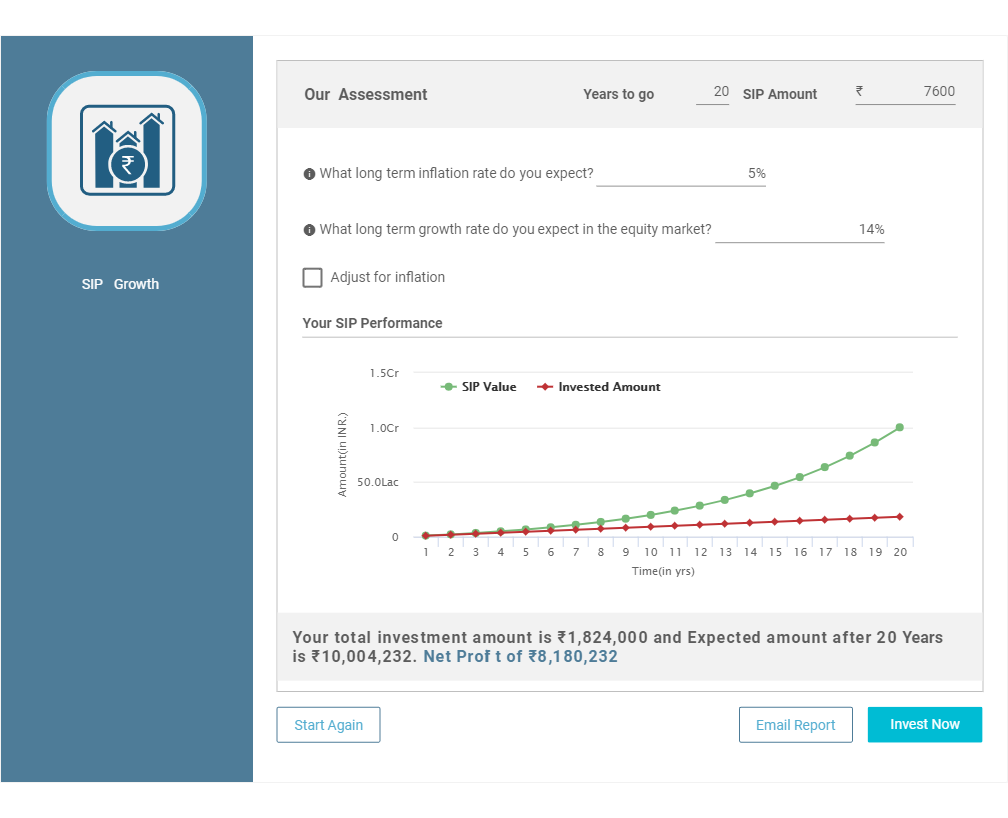
வரலாற்று வருமானத்தின் அடிப்படையிலான முக்கிய அனுமானம் கீழே உள்ளது
| அனுமானங்கள் | தகவல்கள் |
|---|---|
| வளர்ச்சி விகிதம் | 14% |
| வீக்கம் | காரணியாக இல்லை |
| முதலீட்டுத் தொகை (pm) | 7,600 |
| கால கட்டம் | 20 வருடங்கள் |
| முதலீடு செய்யப்பட்ட தொகை | 18,24,000 |
| மொத்த கார்பஸ் | 1,00,04,232 |
| நிகர லாபங்கள் | 81,80,232 |
மேலும் விவரங்கள் எங்கள் பயன்படுத்தி வேலை செய்யலாம்சிப் கால்குலேட்டர் கீழே உள்ள பொத்தானைக் கிளிக் செய்வதன் மூலம்
2. 15 ஆண்டுகளில் 1 கோடி பெறுவது எப்படி
மியூச்சுவல் ஃபண்டுகள் எஸ்ஐபி மூலம் முதலீடு செய்யத் தொடங்குங்கள் ரூ. மாதம் ஒன்றுக்கு 16,320
ஒவ்வொரு மாதமும் 16,320 ரூபாயை உங்களால் சேமிக்க முடிந்தால், ஈக்விட்டி மியூச்சுவல் ஃபண்டுகளில் உடனடியாக ஒரு SIPஐத் தொடங்கவும். திட்டங்களைத் தேர்ந்தெடுப்பதில் உங்களுக்கு உதவி தேவைப்பட்டால், எங்களின் பரிந்துரைக்கப்பட்ட ஈக்விட்டி மியூச்சுவல் ஃபண்ட் போர்ட்ஃபோலியோக்களை நீங்கள் சரிபார்த்து, உங்கள் ரிஸ்க் பசியின்மை மற்றும் SIP தொகையின் அடிப்படையில் ஒரு போர்ட்ஃபோலியோவைத் தேர்ந்தெடுக்கலாம். உங்கள் மியூச்சுவல் ஃபண்டுகளின் போர்ட்ஃபோலியோ 14 சதவீத வருடாந்திர வருவாயை வழங்கினால் (இது 1979 இல் தொடங்கப்பட்டதில் இருந்து SENSEX வழங்கிய CAGR ஐ விடக் குறைவு), கீழே காட்டப்பட்டுள்ளபடி 15 ஆண்டுகளில் நீங்கள் 1 கோடி ரூபாயை உருவாக்க முடியும்.
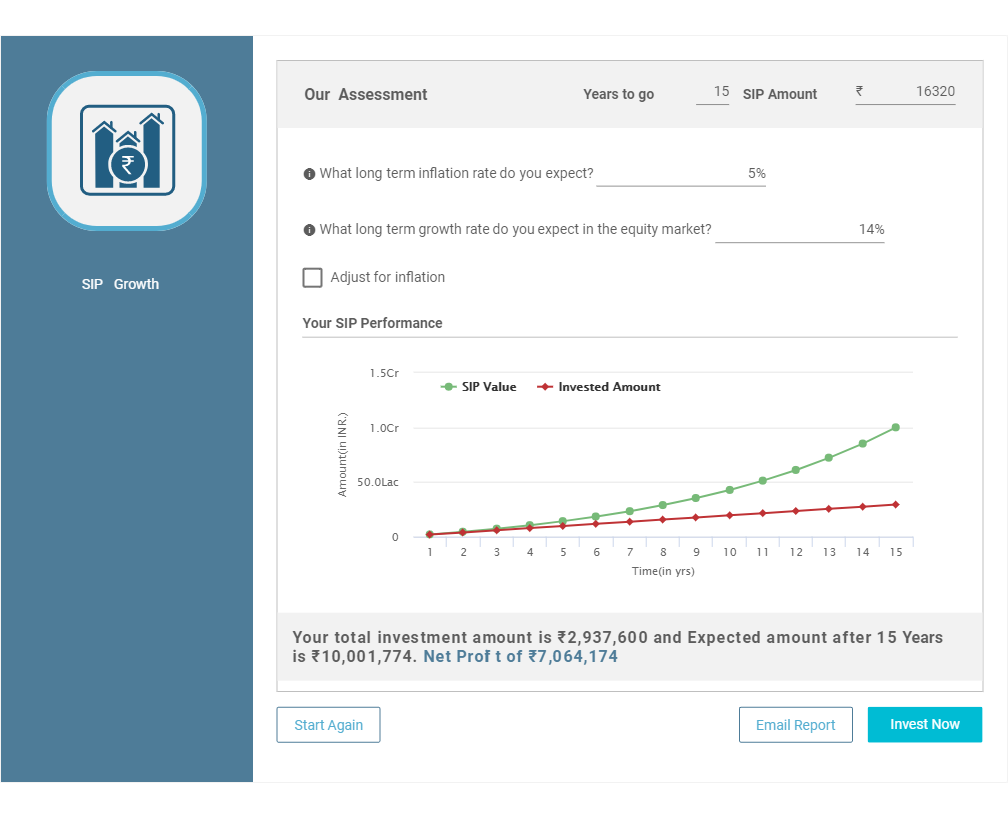
வரலாற்று வருமானத்தின் அடிப்படையிலான முக்கிய அனுமானம் கீழே உள்ளது
| அனுமானங்கள் | தகவல்கள் |
|---|---|
| வளர்ச்சி விகிதம் | 14% |
| வீக்கம் | காரணியாக இல்லை |
| முதலீட்டுத் தொகை (pm) | 16,320 |
| கால கட்டம் | 15 வருடங்கள் |
| முதலீடு செய்யப்பட்ட தொகை | 29,37,600 |
| மொத்த கார்பஸ் | 1,00,01,774 |
| நிகர லாபங்கள் | 70,64,174 |
கீழே உள்ள பொத்தானைக் கிளிக் செய்வதன் மூலம் எங்கள் SIP கால்குலேட்டரைப் பயன்படுத்தி கூடுதல் விவரங்களைப் பெறலாம்
3. 10 ஆண்டுகளில் 1 கோடி பெறுவது எப்படி
மியூச்சுவல் ஃபண்டுகள் எஸ்ஐபி மூலம் முதலீடு செய்யத் தொடங்குங்கள் ரூ. மாதம் ஒன்றுக்கு 38,160
ஒவ்வொரு மாதமும் 38,160 ரூபாயை உங்களால் சேமிக்க முடிந்தால், ஈக்விட்டி மியூச்சுவல் ஃபண்டுகளில் உடனடியாக ஒரு SIPஐத் தொடங்கவும். திட்டங்களைத் தேர்ந்தெடுப்பதில் உங்களுக்கு உதவி தேவைப்பட்டால், எங்களின் பரிந்துரைக்கப்பட்ட ஈக்விட்டி மியூச்சுவல் ஃபண்ட் போர்ட்ஃபோலியோக்களை நீங்கள் சரிபார்த்து, உங்கள் ரிஸ்க் பசியின்மை மற்றும் SIP தொகையின் அடிப்படையில் ஒரு போர்ட்ஃபோலியோவைத் தேர்ந்தெடுக்கலாம். உங்கள் மியூச்சுவல் ஃபண்டுகளின் போர்ட்ஃபோலியோ 14 சதவிகிதம் வருடாந்திர வருவாயை வழங்கினால் (இது 1979 ஆம் ஆண்டு தொடங்கப்பட்ட SENSEX ஆல் வழங்கப்படும் CAGR ஐ விடக் குறைவு), கீழே காட்டப்பட்டுள்ளபடி 10 ஆண்டுகளில் நீங்கள் 1 கோடி ரூபாய் கார்பஸை உருவாக்க முடியும்.
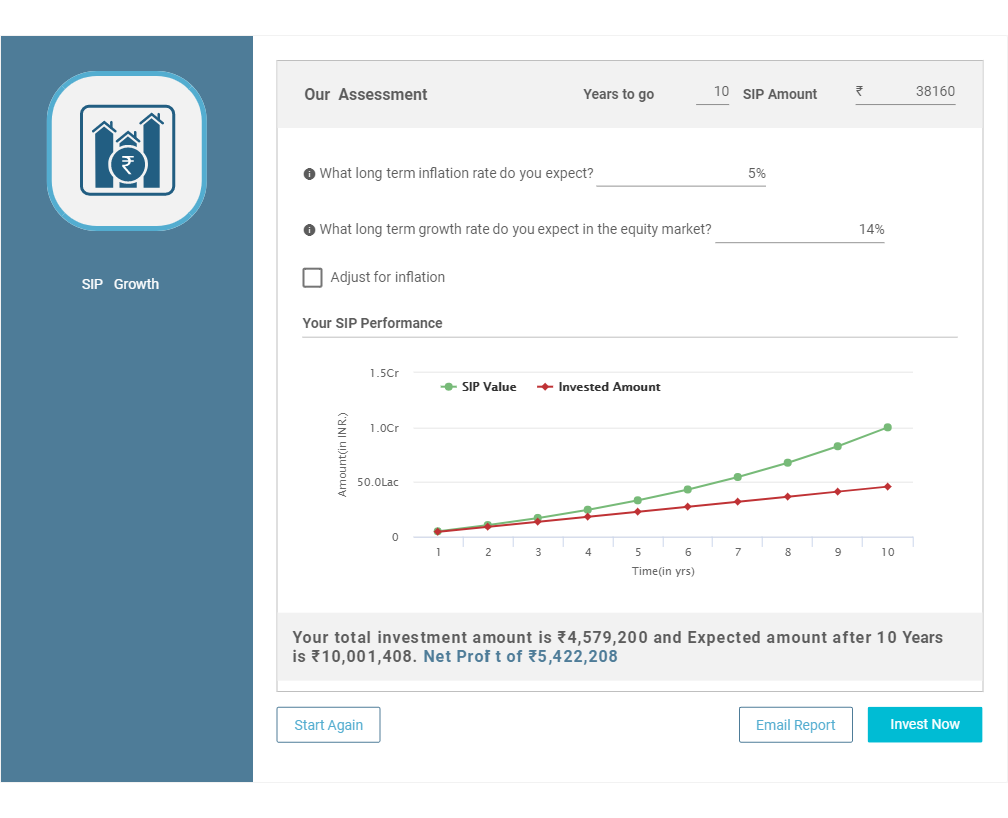
வரலாற்று வருமானத்தின் அடிப்படையிலான முக்கிய அனுமானம் கீழே உள்ளது
| அனுமானங்கள் | தகவல்கள் |
|---|---|
| வளர்ச்சி விகிதம் | 14% |
| வீக்கம் | காரணியாக இல்லை |
| முதலீட்டுத் தொகை (pm) | 38,160 |
| கால கட்டம் | 10 ஆண்டுகள் |
| முதலீடு செய்யப்பட்ட தொகை | 45,79,200 |
| மொத்த கார்பஸ் | 1,00,01,408 |
| நிகர லாபங்கள் | 54,22,208 |
| கீழே உள்ள பொத்தானைக் கிளிக் செய்வதன் மூலம் எங்கள் SIP கால்குலேட்டரைப் பயன்படுத்தி கூடுதல் விவரங்களைப் பெறலாம் |
சிறந்த 10 சிறப்பாக செயல்படும் SIP மியூச்சுவல் ஃபண்டுகள்
மேலே உள்ள நிகர சொத்துக்கள்/AUM கொண்ட சிறந்த பரஸ்பர நிதிகளின் பட்டியல் கீழே உள்ளது500 கோடி & வரிசைப்படுத்தப்பட்டது5 ஆண்டு சிஏஜிஆர் ரிட்டர்ன். கொடுக்கப்பட்ட குறிக்கோளை அடைய முதலீடு தேடலாம்.
"The primary investment objective of the Scheme is to seek capital appreciation by investing predominantly in units of MLIIF - WGF. The Scheme may, at the discretion of the Investment Manager, also invest in the units of other similar overseas mutual fund schemes, which may constitute a significant part of its corpus. The Scheme may also invest a certain portion of its corpus in money market securities and/or units of money market/liquid schemes of DSP Merrill Lynch Mutual Fund, in order to meet liquidity requirements from time to time. However, there is no assurance that the investment objective of the Scheme will be realized." Below is the key information for DSP World Gold Fund Returns up to 1 year are on The objective of the scheme would be to provide investors with opportunities for long-term growth in capital along with the liquidity of an open-ended scheme through an active management of investments in a diversified basket of equity stocks of domestic Public Sector Undertakings and in debt and money market instruments issued by PSUs AND others. Research Highlights for SBI PSU Fund Below is the key information for SBI PSU Fund Returns up to 1 year are on To generate capital appreciation and income distribution to unit holders by investing predominantly in equity/equity related securities of the companies belonging to the infrastructure development and balance in debt securities and money market instruments. Research Highlights for ICICI Prudential Infrastructure Fund Below is the key information for ICICI Prudential Infrastructure Fund Returns up to 1 year are on To generate capital appreciation by investing in Equity and Equity Related Instruments of companies where the Central / State Government(s) has majority shareholding or management control or has powers to appoint majority of directors. However, there is no assurance or guarantee that the investment objective of the Scheme will be achieved. The Scheme does not assure or guarantee any returns. Research Highlights for Invesco India PSU Equity Fund Below is the key information for Invesco India PSU Equity Fund Returns up to 1 year are on To generate capital appreciation, from a portfolio that is substantially constituted of equity securities and equity related securities of corporates, which could benefit from structural changes brought about by continuing liberalization in economic policies by the government and/or continuing investments in infrastructure, both by the public and private sector. Research Highlights for DSP India T.I.G.E.R Fund Below is the key information for DSP India T.I.G.E.R Fund Returns up to 1 year are on (Erstwhile Reliance Diversified Power Sector Fund) The primary investment objective of the scheme is to generate long term capital appreciation by investing predominantly in equity and equity related securities of companies in the power sector. Research Highlights for Nippon India Power and Infra Fund Below is the key information for Nippon India Power and Infra Fund Returns up to 1 year are on To seek long-term capital appreciation by investing predominantly in equity and equity related securities of companies engaged in or expected to benefit from growth and development of infrastructure. Research Highlights for HDFC Infrastructure Fund Below is the key information for HDFC Infrastructure Fund Returns up to 1 year are on The primary investment objective of the scheme is to generate long term capital appreciation by investing predominantly in equity and equity related instruments of small cap companies and the secondary objective is to generate consistent returns by investing in debt and money market securities. Research Highlights for Nippon India Small Cap Fund Below is the key information for Nippon India Small Cap Fund Returns up to 1 year are on The investment objective of the scheme is to provide long term growth from a portfolio of equity / equity related instruments of companies engaged either directly or indirectly in the infrastructure sector. Research Highlights for LIC MF Infrastructure Fund Below is the key information for LIC MF Infrastructure Fund Returns up to 1 year are on The Scheme seeks to achieve capital appreciation by investing in companies engaged directly or indirectly in infrastructure related activities. Research Highlights for Franklin Build India Fund Below is the key information for Franklin Build India Fund Returns up to 1 year are on 1. DSP World Gold Fund
DSP World Gold Fund
Growth Launch Date 14 Sep 07 NAV (17 Feb 26) ₹60.3973 ↓ -2.23 (-3.56 %) Net Assets (Cr) ₹1,756 on 31 Dec 25 Category Equity - Global AMC DSP BlackRock Invmt Managers Pvt. Ltd. Rating ☆☆☆ Risk High Expense Ratio 1.41 Sharpe Ratio 3.42 Information Ratio -0.67 Alpha Ratio 1.32 Min Investment 1,000 Min SIP Investment 500 Exit Load 0-12 Months (1%),12 Months and above(NIL) Growth of 10,000 investment over the years.
Date Value 31 Jan 21 ₹10,000 31 Jan 22 ₹8,807 31 Jan 23 ₹9,422 31 Jan 24 ₹8,517 31 Jan 25 ₹12,548 31 Jan 26 ₹33,170 Returns for DSP World Gold Fund
absolute basis & more than 1 year are on CAGR (Compound Annual Growth Rate) basis. as on 17 Feb 26 Duration Returns 1 Month 2.5% 3 Month 32.8% 6 Month 78.1% 1 Year 143% 3 Year 56.3% 5 Year 28.1% 10 Year 15 Year Since launch 10.3% Historical performance (Yearly) on absolute basis
Year Returns 2024 167.1% 2023 15.9% 2022 7% 2021 -7.7% 2020 -9% 2019 31.4% 2018 35.1% 2017 -10.7% 2016 -4% 2015 52.7% Fund Manager information for DSP World Gold Fund
Name Since Tenure Jay Kothari 1 Mar 13 12.93 Yr. Data below for DSP World Gold Fund as on 31 Dec 25
Equity Sector Allocation
Sector Value Basic Materials 95.89% Asset Allocation
Asset Class Value Cash 1.55% Equity 95.89% Debt 0.01% Other 2.56% Top Securities Holdings / Portfolio
Name Holding Value Quantity BGF World Gold I2
Investment Fund | -74% ₹1,458 Cr 1,177,658
↓ -41,596 VanEck Gold Miners ETF
- | GDX25% ₹497 Cr 573,719 Treps / Reverse Repo Investments
CBLO/Reverse Repo | -2% ₹35 Cr Net Receivables/Payables
Net Current Assets | -1% -₹15 Cr 2. SBI PSU Fund
SBI PSU Fund
Growth Launch Date 7 Jul 10 NAV (18 Feb 26) ₹36.7055 ↑ 0.18 (0.49 %) Net Assets (Cr) ₹5,817 on 31 Dec 25 Category Equity - Sectoral AMC SBI Funds Management Private Limited Rating ☆☆ Risk High Expense Ratio 1.89 Sharpe Ratio 0.33 Information Ratio -0.47 Alpha Ratio -0.22 Min Investment 5,000 Min SIP Investment 500 Exit Load 0-1 Years (1%),1 Years and above(NIL) Growth of 10,000 investment over the years.
Date Value 31 Jan 21 ₹10,000 31 Jan 22 ₹14,656 31 Jan 23 ₹17,067 31 Jan 24 ₹30,032 31 Jan 25 ₹32,242 31 Jan 26 ₹38,028 Returns for SBI PSU Fund
absolute basis & more than 1 year are on CAGR (Compound Annual Growth Rate) basis. as on 17 Feb 26 Duration Returns 1 Month 7.4% 3 Month 7.8% 6 Month 17.7% 1 Year 33.3% 3 Year 34.3% 5 Year 27.5% 10 Year 15 Year Since launch 8.7% Historical performance (Yearly) on absolute basis
Year Returns 2024 11.3% 2023 23.5% 2022 54% 2021 29% 2020 32.4% 2019 -10% 2018 6% 2017 -23.8% 2016 21.9% 2015 16.2% Fund Manager information for SBI PSU Fund
Name Since Tenure Rohit Shimpi 1 Jun 24 1.67 Yr. Data below for SBI PSU Fund as on 31 Dec 25
Equity Sector Allocation
Sector Value Financial Services 34.09% Utility 29.59% Energy 13.91% Industrials 12.42% Basic Materials 7.01% Asset Allocation
Asset Class Value Cash 2.9% Equity 97.02% Debt 0.08% Top Securities Holdings / Portfolio
Name Holding Value Quantity State Bank of India (Financial Services)
Equity, Since 31 Jul 10 | SBIN18% ₹1,069 Cr 9,927,500 Bharat Electronics Ltd (Industrials)
Equity, Since 30 Jun 24 | BEL10% ₹583 Cr 12,975,000 NTPC Ltd (Utilities)
Equity, Since 31 Jul 10 | NTPC9% ₹550 Cr 15,443,244 Power Grid Corp Of India Ltd (Utilities)
Equity, Since 31 Jul 10 | POWERGRID9% ₹511 Cr 19,935,554
↑ 2,300,000 GAIL (India) Ltd (Utilities)
Equity, Since 31 May 24 | GAIL8% ₹488 Cr 29,150,000 Bharat Petroleum Corp Ltd (Energy)
Equity, Since 31 Aug 24 | BPCL6% ₹354 Cr 9,700,000 Bank of Baroda (Financial Services)
Equity, Since 31 Aug 24 | BANKBARODA6% ₹329 Cr 11,000,000 NMDC Ltd (Basic Materials)
Equity, Since 31 Oct 23 | NMDC4% ₹227 Cr 27,900,000 Indian Bank (Financial Services)
Equity, Since 30 Jun 21 | INDIANB4% ₹221 Cr 2,427,235 Oil India Ltd (Energy)
Equity, Since 31 Mar 24 | OIL3% ₹196 Cr 3,850,000 3. ICICI Prudential Infrastructure Fund
ICICI Prudential Infrastructure Fund
Growth Launch Date 31 Aug 05 NAV (18 Feb 26) ₹198.6 ↑ 0.98 (0.50 %) Net Assets (Cr) ₹8,134 on 31 Dec 25 Category Equity - Sectoral AMC ICICI Prudential Asset Management Company Limited Rating ☆☆☆ Risk High Expense Ratio 1.89 Sharpe Ratio 0.12 Information Ratio 0 Alpha Ratio 0 Min Investment 5,000 Min SIP Investment 100 Exit Load 0-1 Years (1%),1 Years and above(NIL) Growth of 10,000 investment over the years.
Date Value 31 Jan 21 ₹10,000 31 Jan 22 ₹16,042 31 Jan 23 ₹19,152 31 Jan 24 ₹29,825 31 Jan 25 ₹34,393 31 Jan 26 ₹36,891 Returns for ICICI Prudential Infrastructure Fund
absolute basis & more than 1 year are on CAGR (Compound Annual Growth Rate) basis. as on 17 Feb 26 Duration Returns 1 Month 2.6% 3 Month 0.1% 6 Month 2.5% 1 Year 18.5% 3 Year 25.4% 5 Year 26.5% 10 Year 15 Year Since launch 15.7% Historical performance (Yearly) on absolute basis
Year Returns 2024 6.7% 2023 27.4% 2022 44.6% 2021 28.8% 2020 50.1% 2019 3.6% 2018 2.6% 2017 -14% 2016 40.8% 2015 2% Fund Manager information for ICICI Prudential Infrastructure Fund
Name Since Tenure Ihab Dalwai 3 Jun 17 8.67 Yr. Sharmila D’mello 30 Jun 22 3.59 Yr. Data below for ICICI Prudential Infrastructure Fund as on 31 Dec 25
Equity Sector Allocation
Sector Value Industrials 48.97% Financial Services 12.33% Utility 9.63% Basic Materials 9.49% Real Estate 6.53% Energy 6% Consumer Cyclical 2.03% Communication Services 0.11% Asset Allocation
Asset Class Value Cash 4.63% Equity 95.37% Top Securities Holdings / Portfolio
Name Holding Value Quantity Larsen & Toubro Ltd (Industrials)
Equity, Since 30 Nov 09 | LT9% ₹690 Cr 1,755,704 InterGlobe Aviation Ltd (Industrials)
Equity, Since 28 Feb 23 | INDIGO8% ₹640 Cr 1,391,449
↑ 275,091 NTPC Ltd (Utilities)
Equity, Since 29 Feb 16 | NTPC4% ₹332 Cr 9,326,448
↓ -1,050,000 Oberoi Realty Ltd (Real Estate)
Equity, Since 31 May 23 | OBEROIRLTY3% ₹253 Cr 1,696,181
↑ 637,668 Adani Ports & Special Economic Zone Ltd (Industrials)
Equity, Since 31 May 24 | ADANIPORTS3% ₹241 Cr 1,700,000 AIA Engineering Ltd (Industrials)
Equity, Since 28 Feb 21 | AIAENG3% ₹229 Cr 574,561
↓ -37,559 Kalpataru Projects International Ltd (Industrials)
Equity, Since 30 Sep 06 | KPIL3% ₹221 Cr 1,931,967
↑ 20,847 IndusInd Bank Ltd (Financial Services)
Equity, Since 31 Oct 24 | INDUSINDBK3% ₹217 Cr 2,424,016 Reliance Industries Ltd (Energy)
Equity, Since 31 Jul 23 | RELIANCE3% ₹213 Cr 1,529,725 Axis Bank Ltd (Financial Services)
Equity, Since 31 Dec 20 | AXISBANK3% ₹209 Cr 1,527,307
↓ -156,250 4. Invesco India PSU Equity Fund
Invesco India PSU Equity Fund
Growth Launch Date 18 Nov 09 NAV (18 Feb 26) ₹68.86 ↑ 0.52 (0.76 %) Net Assets (Cr) ₹1,449 on 31 Dec 25 Category Equity - Sectoral AMC Invesco Asset Management (India) Private Ltd Rating ☆☆☆ Risk High Expense Ratio 2.14 Sharpe Ratio 0.27 Information Ratio -0.37 Alpha Ratio -1.9 Min Investment 5,000 Min SIP Investment 500 Exit Load 0-1 Years (1%),1 Years and above(NIL) Growth of 10,000 investment over the years.
Date Value 31 Jan 21 ₹10,000 31 Jan 22 ₹13,872 31 Jan 23 ₹15,622 31 Jan 24 ₹26,577 31 Jan 25 ₹29,948 31 Jan 26 ₹35,297 Returns for Invesco India PSU Equity Fund
absolute basis & more than 1 year are on CAGR (Compound Annual Growth Rate) basis. as on 17 Feb 26 Duration Returns 1 Month 2.6% 3 Month 3.1% 6 Month 11.2% 1 Year 33.1% 3 Year 32.2% 5 Year 25.9% 10 Year 15 Year Since launch 12.6% Historical performance (Yearly) on absolute basis
Year Returns 2024 10.3% 2023 25.6% 2022 54.5% 2021 20.5% 2020 31.1% 2019 6.1% 2018 10.1% 2017 -16.9% 2016 24.3% 2015 17.9% Fund Manager information for Invesco India PSU Equity Fund
Name Since Tenure Hiten Jain 1 Jul 25 0.59 Yr. Sagar Gandhi 1 Jul 25 0.59 Yr. Data below for Invesco India PSU Equity Fund as on 31 Dec 25
Equity Sector Allocation
Sector Value Industrials 31.92% Financial Services 29.89% Utility 18.15% Energy 12.64% Basic Materials 4.19% Consumer Cyclical 1.08% Asset Allocation
Asset Class Value Cash 2.14% Equity 97.86% Top Securities Holdings / Portfolio
Name Holding Value Quantity State Bank of India (Financial Services)
Equity, Since 28 Feb 21 | SBIN9% ₹139 Cr 1,294,989
↓ -92,628 Bharat Electronics Ltd (Industrials)
Equity, Since 31 Mar 17 | BEL9% ₹135 Cr 2,997,692 Indian Bank (Financial Services)
Equity, Since 30 Jun 21 | INDIANB7% ₹106 Cr 1,157,444 Bharat Petroleum Corp Ltd (Energy)
Equity, Since 30 Sep 18 | BPCL7% ₹99 Cr 2,717,009 Hindustan Aeronautics Ltd Ordinary Shares (Industrials)
Equity, Since 31 May 22 | HAL6% ₹87 Cr 187,643
↓ -8,515 NTPC Green Energy Ltd (Utilities)
Equity, Since 30 Nov 24 | NTPCGREEN5% ₹79 Cr 9,129,820 Dredging Corp of India Ltd (Industrials)
Equity, Since 31 Jul 25 | DREDGECORP5% ₹73 Cr 646,300 Bharat Dynamics Ltd Ordinary Shares (Industrials)
Equity, Since 31 May 22 | BDL5% ₹69 Cr 445,685 Bank of Baroda (Financial Services)
Equity, Since 30 Jun 21 | BANKBARODA5% ₹67 Cr 2,244,222 NTPC Ltd (Utilities)
Equity, Since 31 May 19 | NTPC4% ₹64 Cr 1,801,543 5. DSP India T.I.G.E.R Fund
DSP India T.I.G.E.R Fund
Growth Launch Date 11 Jun 04 NAV (18 Feb 26) ₹326.36 ↑ 1.58 (0.49 %) Net Assets (Cr) ₹5,323 on 31 Dec 25 Category Equity - Sectoral AMC DSP BlackRock Invmt Managers Pvt. Ltd. Rating ☆☆☆☆ Risk High Expense Ratio 1.89 Sharpe Ratio -0.31 Information Ratio 0 Alpha Ratio 0 Min Investment 1,000 Min SIP Investment 500 Exit Load 0-12 Months (1%),12 Months and above(NIL) Growth of 10,000 investment over the years.
Date Value 31 Jan 21 ₹10,000 31 Jan 22 ₹15,028 31 Jan 23 ₹16,816 31 Jan 24 ₹26,495 31 Jan 25 ₹30,221 31 Jan 26 ₹31,981 Returns for DSP India T.I.G.E.R Fund
absolute basis & more than 1 year are on CAGR (Compound Annual Growth Rate) basis. as on 17 Feb 26 Duration Returns 1 Month 5.3% 3 Month 2.1% 6 Month 4.6% 1 Year 23% 3 Year 25.9% 5 Year 24.4% 10 Year 15 Year Since launch 17.4% Historical performance (Yearly) on absolute basis
Year Returns 2024 -2.5% 2023 32.4% 2022 49% 2021 13.9% 2020 51.6% 2019 2.7% 2018 6.7% 2017 -17.2% 2016 47% 2015 4.1% Fund Manager information for DSP India T.I.G.E.R Fund
Name Since Tenure Rohit Singhania 21 Jun 10 15.63 Yr. Data below for DSP India T.I.G.E.R Fund as on 31 Dec 25
Equity Sector Allocation
Sector Value Industrials 30.23% Basic Materials 14.52% Financial Services 12.4% Utility 11.04% Energy 8.15% Consumer Cyclical 8.07% Health Care 5.75% Communication Services 3.2% Technology 1.66% Real Estate 1.57% Consumer Defensive 1.34% Asset Allocation
Asset Class Value Cash 2.08% Equity 97.92% Top Securities Holdings / Portfolio
Name Holding Value Quantity Larsen & Toubro Ltd (Industrials)
Equity, Since 30 Jun 04 | LT5% ₹267 Cr 678,645
↓ -15,823 NTPC Ltd (Utilities)
Equity, Since 30 Nov 17 | NTPC5% ₹254 Cr 7,145,883 Apollo Hospitals Enterprise Ltd (Healthcare)
Equity, Since 31 Dec 24 | APOLLOHOSP4% ₹197 Cr 283,144
↑ 37,216 Multi Commodity Exchange of India Ltd (Financial Services)
Equity, Since 31 May 25 | MCX3% ₹172 Cr 680,825 Bharti Airtel Ltd (Communication Services)
Equity, Since 31 Oct 18 | BHARTIARTL3% ₹160 Cr 812,745 Oil & Natural Gas Corp Ltd (Energy)
Equity, Since 31 Mar 24 | ONGC3% ₹153 Cr 5,686,486
↑ 1,321,459 Power Grid Corp Of India Ltd (Utilities)
Equity, Since 31 Jan 25 | POWERGRID3% ₹143 Cr 5,567,574 Hindustan Aeronautics Ltd Ordinary Shares (Industrials)
Equity, Since 31 Oct 25 | HAL3% ₹141 Cr 305,098 Kirloskar Oil Engines Ltd (Industrials)
Equity, Since 31 Mar 23 | KIRLOSENG3% ₹136 Cr 1,154,264 Coal India Ltd (Energy)
Equity, Since 31 Dec 23 | COALINDIA2% ₹119 Cr 2,705,180
↓ -616,273 6. Nippon India Power and Infra Fund
Nippon India Power and Infra Fund
Growth Launch Date 8 May 04 NAV (18 Feb 26) ₹355.176 ↑ 2.24 (0.64 %) Net Assets (Cr) ₹7,117 on 31 Dec 25 Category Equity - Sectoral AMC Nippon Life Asset Management Ltd. Rating ☆☆☆☆ Risk High Expense Ratio 1.85 Sharpe Ratio -0.2 Information Ratio 0.34 Alpha Ratio -15.06 Min Investment 5,000 Min SIP Investment 100 Exit Load 0-1 Years (1%),1 Years and above(NIL) Growth of 10,000 investment over the years.
Date Value 31 Jan 21 ₹10,000 31 Jan 22 ₹14,955 31 Jan 23 ₹16,453 31 Jan 24 ₹27,930 31 Jan 25 ₹30,936 31 Jan 26 ₹31,936 Returns for Nippon India Power and Infra Fund
absolute basis & more than 1 year are on CAGR (Compound Annual Growth Rate) basis. as on 17 Feb 26 Duration Returns 1 Month 6% 3 Month 0.3% 6 Month 4.4% 1 Year 21.3% 3 Year 26.6% 5 Year 23.9% 10 Year 15 Year Since launch 17.8% Historical performance (Yearly) on absolute basis
Year Returns 2024 -0.5% 2023 26.9% 2022 58% 2021 10.9% 2020 48.9% 2019 10.8% 2018 -2.9% 2017 -21.1% 2016 61.7% 2015 0.1% Fund Manager information for Nippon India Power and Infra Fund
Name Since Tenure Kinjal Desai 25 May 18 7.7 Yr. Rahul Modi 19 Aug 24 1.45 Yr. Lokesh Maru 5 Sep 25 0.41 Yr. Divya Sharma 5 Sep 25 0.41 Yr. Data below for Nippon India Power and Infra Fund as on 31 Dec 25
Equity Sector Allocation
Sector Value Industrials 31.76% Utility 24.23% Consumer Cyclical 11.14% Energy 10.76% Basic Materials 7.94% Technology 4.08% Communication Services 3.05% Financial Services 2.82% Health Care 2.16% Real Estate 1.9% Asset Allocation
Asset Class Value Cash 0.17% Equity 99.83% Top Securities Holdings / Portfolio
Name Holding Value Quantity Reliance Industries Ltd (Energy)
Equity, Since 30 Nov 18 | RELIANCE10% ₹650 Cr 4,660,000
↑ 110,000 NTPC Ltd (Utilities)
Equity, Since 31 May 09 | NTPC9% ₹605 Cr 17,000,000 Larsen & Toubro Ltd (Industrials)
Equity, Since 30 Nov 07 | LT6% ₹389 Cr 989,337
↓ -75,000 Tata Power Co Ltd (Utilities)
Equity, Since 30 Apr 23 | TATAPOWER4% ₹289 Cr 7,900,789 Bharti Airtel Ltd (Communication Services)
Equity, Since 30 Apr 18 | BHARTIARTL3% ₹207 Cr 1,050,000
↓ -150,000 UltraTech Cement Ltd (Basic Materials)
Equity, Since 31 Oct 19 | ULTRACEMCO3% ₹203 Cr 160,000
↓ -10,000 CG Power & Industrial Solutions Ltd (Industrials)
Equity, Since 30 Sep 24 | CGPOWER3% ₹176 Cr 3,020,014 Bharat Heavy Electricals Ltd (Industrials)
Equity, Since 30 Sep 24 | BHEL3% ₹171 Cr 6,500,000
↓ -400,000 Bharat Forge Ltd (Consumer Cyclical)
Equity, Since 31 Oct 24 | BHARATFORG3% ₹170 Cr 1,179,635 NTPC Green Energy Ltd (Utilities)
Equity, Since 30 Nov 24 | NTPCGREEN2% ₹158 Cr 18,358,070
↑ 860,913 7. HDFC Infrastructure Fund
HDFC Infrastructure Fund
Growth Launch Date 10 Mar 08 NAV (18 Feb 26) ₹47.986 ↑ 0.17 (0.35 %) Net Assets (Cr) ₹2,452 on 31 Dec 25 Category Equity - Sectoral AMC HDFC Asset Management Company Limited Rating ☆☆☆ Risk High Expense Ratio 2.06 Sharpe Ratio -0.13 Information Ratio 0 Alpha Ratio 0 Min Investment 5,000 Min SIP Investment 300 Exit Load 0-1 Years (1%),1 Years and above(NIL) Growth of 10,000 investment over the years.
Date Value 31 Jan 21 ₹10,000 31 Jan 22 ₹15,059 31 Jan 23 ₹16,950 31 Jan 24 ₹28,499 31 Jan 25 ₹31,485 31 Jan 26 ₹33,227 Returns for HDFC Infrastructure Fund
absolute basis & more than 1 year are on CAGR (Compound Annual Growth Rate) basis. as on 17 Feb 26 Duration Returns 1 Month 2.9% 3 Month -1% 6 Month 1.2% 1 Year 18.6% 3 Year 27.5% 5 Year 23.7% 10 Year 15 Year Since launch Historical performance (Yearly) on absolute basis
Year Returns 2024 2.2% 2023 23% 2022 55.4% 2021 19.3% 2020 43.2% 2019 -7.5% 2018 -3.4% 2017 -29% 2016 43.3% 2015 -1.9% Fund Manager information for HDFC Infrastructure Fund
Name Since Tenure Dhruv Muchhal 22 Jun 23 2.62 Yr. Ashish Shah 1 Nov 25 0.25 Yr. Data below for HDFC Infrastructure Fund as on 31 Dec 25
Equity Sector Allocation
Sector Value Industrials 40.3% Financial Services 21.02% Basic Materials 10.31% Energy 7.4% Utility 7.38% Communication Services 4.32% Real Estate 2.99% Health Care 1.84% Technology 1.33% Consumer Cyclical 0.67% Asset Allocation
Asset Class Value Cash 2.44% Equity 97.56% Top Securities Holdings / Portfolio
Name Holding Value Quantity Larsen & Toubro Ltd (Industrials)
Equity, Since 30 Jun 12 | LT7% ₹159 Cr 403,500
↑ 6,000 ICICI Bank Ltd (Financial Services)
Equity, Since 31 Oct 09 | ICICIBANK6% ₹149 Cr 1,100,000 HDFC Bank Ltd (Financial Services)
Equity, Since 31 Aug 23 | HDFCBANK5% ₹130 Cr 1,400,000 Kalpataru Projects International Ltd (Industrials)
Equity, Since 31 Jan 23 | KPIL4% ₹87 Cr 758,285 J Kumar Infraprojects Ltd (Industrials)
Equity, Since 31 Oct 15 | JKIL3% ₹80 Cr 1,400,000 NTPC Ltd (Utilities)
Equity, Since 31 Dec 17 | NTPC3% ₹78 Cr 2,200,000 State Bank of India (Financial Services)
Equity, Since 31 Mar 08 | SBIN3% ₹76 Cr 704,361 Reliance Industries Ltd (Energy)
Equity, Since 31 May 24 | RELIANCE3% ₹70 Cr 500,000 InterGlobe Aviation Ltd (Industrials)
Equity, Since 31 Dec 21 | INDIGO3% ₹69 Cr 150,000 Bharti Airtel Ltd (Communication Services)
Equity, Since 30 Sep 20 | BHARTIARTL3% ₹69 Cr 350,000 8. Nippon India Small Cap Fund
Nippon India Small Cap Fund
Growth Launch Date 16 Sep 10 NAV (18 Feb 26) ₹164.458 ↑ 0.53 (0.32 %) Net Assets (Cr) ₹68,287 on 31 Dec 25 Category Equity - Small Cap AMC Nippon Life Asset Management Ltd. Rating ☆☆☆☆ Risk Moderately High Expense Ratio 1.44 Sharpe Ratio -0.42 Information Ratio -0.02 Alpha Ratio -1.23 Min Investment 5,000 Min SIP Investment 100 Exit Load 0-1 Years (1%),1 Years and above(NIL) Growth of 10,000 investment over the years.
Date Value 31 Jan 21 ₹10,000 31 Jan 22 ₹17,257 31 Jan 23 ₹18,306 31 Jan 24 ₹28,687 31 Jan 25 ₹31,667 31 Jan 26 ₹31,833 Returns for Nippon India Small Cap Fund
absolute basis & more than 1 year are on CAGR (Compound Annual Growth Rate) basis. as on 17 Feb 26 Duration Returns 1 Month 1.9% 3 Month -3.6% 6 Month -1.7% 1 Year 14.3% 3 Year 21.2% 5 Year 23.6% 10 Year 15 Year Since launch 19.9% Historical performance (Yearly) on absolute basis
Year Returns 2024 -4.7% 2023 26.1% 2022 48.9% 2021 6.5% 2020 74.3% 2019 29.2% 2018 -2.5% 2017 -16.7% 2016 63% 2015 5.6% Fund Manager information for Nippon India Small Cap Fund
Name Since Tenure Samir Rachh 2 Jan 17 9.09 Yr. Kinjal Desai 25 May 18 7.7 Yr. Lokesh Maru 5 Sep 25 0.41 Yr. Divya Sharma 5 Sep 25 0.41 Yr. Data below for Nippon India Small Cap Fund as on 31 Dec 25
Equity Sector Allocation
Sector Value Industrials 19.87% Financial Services 17.63% Consumer Cyclical 13.65% Consumer Defensive 11.02% Basic Materials 11% Health Care 9.06% Technology 6.72% Utility 3.16% Energy 1.39% Communication Services 1.17% Real Estate 1.08% Asset Allocation
Asset Class Value Cash 4.26% Equity 95.74% Top Securities Holdings / Portfolio
Name Holding Value Quantity Multi Commodity Exchange of India Ltd (Financial Services)
Equity, Since 28 Feb 21 | MCX3% ₹2,219 Cr 8,778,789
↓ -476,261 HDFC Bank Ltd (Financial Services)
Equity, Since 30 Apr 22 | HDFCBANK2% ₹1,422 Cr 15,300,000
↑ 2,000,000 State Bank of India (Financial Services)
Equity, Since 31 Oct 19 | SBIN2% ₹1,115 Cr 10,347,848 Karur Vysya Bank Ltd (Financial Services)
Equity, Since 28 Feb 17 | 5900032% ₹1,082 Cr 35,913,511
↓ -2,227,363 Axis Bank Ltd (Financial Services)
Equity, Since 31 Jul 24 | AXISBANK1% ₹819 Cr 5,977,976 eClerx Services Ltd (Technology)
Equity, Since 31 Jul 20 | ECLERX1% ₹797 Cr 1,712,794 Bharat Heavy Electricals Ltd (Industrials)
Equity, Since 30 Sep 22 | BHEL1% ₹775 Cr 29,507,422 Emami Ltd (Consumer Defensive)
Equity, Since 31 Jul 23 | EMAMILTD1% ₹772 Cr 15,948,302
↑ 150,000 Zydus Wellness Ltd (Consumer Defensive)
Equity, Since 31 Aug 16 | ZYDUSWELL1% ₹764 Cr 17,048,030 TD Power Systems Ltd (Industrials)
Equity, Since 31 Dec 15 | TDPOWERSYS1% ₹743 Cr 10,178,244 9. LIC MF Infrastructure Fund
LIC MF Infrastructure Fund
Growth Launch Date 29 Feb 08 NAV (18 Feb 26) ₹50.751 ↑ 0.39 (0.76 %) Net Assets (Cr) ₹1,003 on 31 Dec 25 Category Equity - Sectoral AMC LIC Mutual Fund Asset Mgmt Co Ltd Rating Risk High Expense Ratio 2.21 Sharpe Ratio -0.21 Information Ratio 0.28 Alpha Ratio -18.43 Min Investment 5,000 Min SIP Investment 1,000 Exit Load 0-1 Years (1%),1 Years and above(NIL) Growth of 10,000 investment over the years.
Date Value 31 Jan 21 ₹10,000 31 Jan 22 ₹15,011 31 Jan 23 ₹15,567 31 Jan 24 ₹24,683 31 Jan 25 ₹30,671 31 Jan 26 ₹31,739 Returns for LIC MF Infrastructure Fund
absolute basis & more than 1 year are on CAGR (Compound Annual Growth Rate) basis. as on 17 Feb 26 Duration Returns 1 Month 6% 3 Month 1.2% 6 Month 4.9% 1 Year 27.6% 3 Year 29% 5 Year 23.6% 10 Year 15 Year Since launch 9.5% Historical performance (Yearly) on absolute basis
Year Returns 2024 -3.7% 2023 47.8% 2022 44.4% 2021 7.9% 2020 46.6% 2019 -0.1% 2018 13.3% 2017 -14.6% 2016 42.2% 2015 -2.2% Fund Manager information for LIC MF Infrastructure Fund
Name Since Tenure Yogesh Patil 18 Sep 20 5.38 Yr. Mahesh Bendre 1 Jul 24 1.59 Yr. Data below for LIC MF Infrastructure Fund as on 31 Dec 25
Equity Sector Allocation
Sector Value Industrials 48.01% Consumer Cyclical 14.5% Basic Materials 9.34% Financial Services 6.56% Utility 6.33% Technology 3.72% Real Estate 3.47% Health Care 3.21% Communication Services 2.91% Asset Allocation
Asset Class Value Cash 1.95% Equity 98.05% Top Securities Holdings / Portfolio
Name Holding Value Quantity Tata Motors Ltd (Consumer Cyclical)
Equity, Since 31 Oct 25 | TMCV5% ₹48 Cr 1,051,964
↓ -36,431 Shakti Pumps (India) Ltd (Industrials)
Equity, Since 31 Mar 24 | SHAKTIPUMP5% ₹43 Cr 686,379 Larsen & Toubro Ltd (Industrials)
Equity, Since 30 Apr 09 | LT5% ₹43 Cr 108,403 REC Ltd (Financial Services)
Equity, Since 31 Jul 23 | RECLTD3% ₹33 Cr 901,191 Apollo Hospitals Enterprise Ltd (Healthcare)
Equity, Since 30 Jun 25 | APOLLOHOSP3% ₹30 Cr 43,674 Garware Hi-Tech Films Ltd (Basic Materials)
Equity, Since 31 Aug 23 | 5006553% ₹28 Cr 93,271 Schneider Electric Infrastructure Ltd (Industrials)
Equity, Since 31 Dec 23 | SCHNEIDER3% ₹26 Cr 377,034
↑ 61,173 Bharat Bijlee Ltd (Industrials)
Equity, Since 31 Jul 22 | BBL3% ₹26 Cr 92,624 Avalon Technologies Ltd (Technology)
Equity, Since 31 Jul 23 | AVALON3% ₹25 Cr 289,118 Mahindra Lifespace Developers Ltd (Real Estate)
Equity, Since 30 Jun 24 | MAHLIFE3% ₹24 Cr 659,065 10. Franklin Build India Fund
Franklin Build India Fund
Growth Launch Date 4 Sep 09 NAV (18 Feb 26) ₹149.671 ↑ 0.76 (0.51 %) Net Assets (Cr) ₹3,036 on 31 Dec 25 Category Equity - Sectoral AMC Franklin Templeton Asst Mgmt(IND)Pvt Ltd Rating ☆☆☆☆☆ Risk High Expense Ratio 2.01 Sharpe Ratio -0.05 Information Ratio 0 Alpha Ratio 0 Min Investment 5,000 Min SIP Investment 500 Exit Load 0-1 Years (1%),1 Years and above(NIL) Growth of 10,000 investment over the years.
Date Value 31 Jan 21 ₹10,000 31 Jan 22 ₹14,734 31 Jan 23 ₹15,797 31 Jan 24 ₹25,867 31 Jan 25 ₹29,250 31 Jan 26 ₹31,672 Returns for Franklin Build India Fund
absolute basis & more than 1 year are on CAGR (Compound Annual Growth Rate) basis. as on 17 Feb 26 Duration Returns 1 Month 6.4% 3 Month 2.8% 6 Month 6.3% 1 Year 23.9% 3 Year 28.1% 5 Year 23.6% 10 Year 15 Year Since launch 17.9% Historical performance (Yearly) on absolute basis
Year Returns 2024 3.7% 2023 27.8% 2022 51.1% 2021 11.2% 2020 45.9% 2019 5.4% 2018 6% 2017 -10.7% 2016 43.3% 2015 8.4% Fund Manager information for Franklin Build India Fund
Name Since Tenure Ajay Argal 18 Oct 21 4.29 Yr. Kiran Sebastian 7 Feb 22 3.99 Yr. Sandeep Manam 18 Oct 21 4.29 Yr. Data below for Franklin Build India Fund as on 31 Dec 25
Equity Sector Allocation
Sector Value Industrials 33.81% Financial Services 16.07% Utility 14.48% Energy 13.67% Communication Services 8.08% Basic Materials 5.58% Real Estate 2.64% Consumer Cyclical 1.25% Technology 1.16% Asset Allocation
Asset Class Value Cash 3.26% Equity 96.74% Top Securities Holdings / Portfolio
Name Holding Value Quantity Larsen & Toubro Ltd (Industrials)
Equity, Since 29 Feb 20 | LT9% ₹261 Cr 665,000 Oil & Natural Gas Corp Ltd (Energy)
Equity, Since 30 Jun 19 | ONGC6% ₹184 Cr 6,825,000 Reliance Industries Ltd (Energy)
Equity, Since 31 Oct 21 | RELIANCE6% ₹176 Cr 1,260,000
↑ 60,000 InterGlobe Aviation Ltd (Industrials)
Equity, Since 29 Feb 20 | INDIGO5% ₹161 Cr 350,000
↑ 24,659 NTPC Ltd (Utilities)
Equity, Since 30 Nov 16 | NTPC5% ₹142 Cr 3,978,727
↓ -371,273 Bharti Airtel Ltd (Communication Services)
Equity, Since 30 Sep 09 | BHARTIARTL5% ₹140 Cr 710,000 HDFC Bank Ltd (Financial Services)
Equity, Since 31 Oct 25 | HDFCBANK5% ₹139 Cr 1,500,000 Axis Bank Ltd (Financial Services)
Equity, Since 31 Mar 12 | AXISBANK5% ₹137 Cr 1,000,000 State Bank of India (Financial Services)
Equity, Since 31 Jul 14 | SBIN4% ₹108 Cr 1,000,000 REC Ltd (Financial Services)
Equity, Since 30 Sep 25 | RECLTD3% ₹98 Cr 2,700,000
↑ 400,000
மியூச்சுவல் ஃபண்ட் SIP ஆன்லைனில் எப்படி முதலீடு செய்வது?
Fincash.com இல் வாழ்நாள் முழுவதும் இலவச முதலீட்டுக் கணக்கைத் திறக்கவும்.
உங்கள் பதிவு மற்றும் KYC செயல்முறையை முடிக்கவும்
ஆவணங்களைப் பதிவேற்றவும் (PAN, ஆதார் போன்றவை).மேலும், நீங்கள் முதலீடு செய்ய தயாராக உள்ளீர்கள்!
இங்கு வழங்கப்பட்ட தகவல்கள் துல்லியமானவை என்பதை உறுதிப்படுத்த அனைத்து முயற்சிகளும் மேற்கொள்ளப்பட்டுள்ளன. இருப்பினும், தரவுகளின் சரியான தன்மை குறித்து எந்த உத்தரவாதமும் அளிக்கப்படவில்லை. முதலீடு செய்வதற்கு முன் திட்டத் தகவல் ஆவணத்துடன் சரிபார்க்கவும்.
You Might Also Like






Research Highlights for DSP World Gold Fund