
 +91-22-48913909
Mutual Funds in India: Meaning, Types, Benefits & How to Invest
A mutual fund is an investment vehicle that pools money from multiple investors who have a common investment objective. The pooled money is then invested in securities such as stocks, bonds, money-market instruments or other permitted assets, depending on the scheme's investment objective.
A professional fund management team manages the portfolio according to the scheme's stated strategy. Investors receive units in the mutual fund, and the value of those units changes based on the performance of the underlying investments.
In India, mutual funds are regulated by the Securities and Exchange Board of India (SEBI), which establishes rules and guidelines for mutual fund schemes and the entities involved in managing them.

If you are new to investing, you may have questions such as - What is a mutual fund? How do mutual funds work? What are the different Types of Mutual Funds? Which mutual fund may be suitable for your goal? How can you invest through a SIP or lump sum?
This guide explains the basics of mutual funds in India, including their types, how investments and returns work, how to choose a fund, how to invest and other important concepts such as NAV and mutual fund ratings.
History of Mutual Funds in India
The history of mutual funds in India dates back to 1963, when Unit Trust of India (UTI) was established. For several years, UTI was the primary mutual fund institution in the country.
The industry gradually expanded with the entry of public-sector and private-sector fund houses. The establishment of SEBI as the securities-market regulator and the formation of the Association of Mutual Funds in India (AMFI) also contributed to the development of the mutual fund industry and investor awareness.
Today, investors can choose from mutual fund schemes across equity, debt, hybrid and other categories.
How Do Mutual Fund Investments Work?
Investors can generally invest in Mutual Funds through -
- Lump-sum investment - Investing a larger amount at one time
- Systematic Investment Plan (SIP) - Investing a predetermined amount at regular intervals, usually monthly
The choice between SIP and lump-sum investing depends on factors such as income, cash flow, investment objective, risk tolerance and market conditions.
A SIP can help investors invest regularly and build an investment habit, while a lump-sum investment allows an investor to deploy a larger amount at once. A mutual fund investment should be selected based on the investor's financial goal and risk profile rather than simply on the expected return.
Mutual Fund Returns
Mutual fund returns vary depending on the type of scheme, the securities in its portfolio and market conditions.
Equity-oriented funds can experience significant fluctuations but may offer higher growth potential over longer periods. Debt funds generally have different return and interest-rate characteristics, while Hybrid Fund combine exposure to more than one asset class.
When evaluating a mutual fund, do not rely only on the highest recent return. Consider:
- Returns across multiple periods
- Performance against the relevant benchmark
- Performance compared with funds in the same category
- Volatility and risk
- Expense ratio
- Portfolio composition
- Investment strategy
5 Year Returns Across Categories
| Mutual Fund Category | Approx. 5-Year Annualised Return |
|---|---|
| Large cap funds | 16–17% |
| Large & mid cap funds | 17–18% |
| Flexi Cap Funds | 17–18% |
| Mid Cap Funds | 23–25% |
| Small Cap Funds | 23–26% |
| ELSS Funds | 16–18% |
| Hybrid Funds | 12–16% |
| Debt Funds | 5.5–6.5% |
(Returns As of 2026)
Returns shown above are indicative historical annualised returns and can vary depending on the fund, measurement period and market conditions.
Talk to our investment specialist
Types of Mutual Funds in India
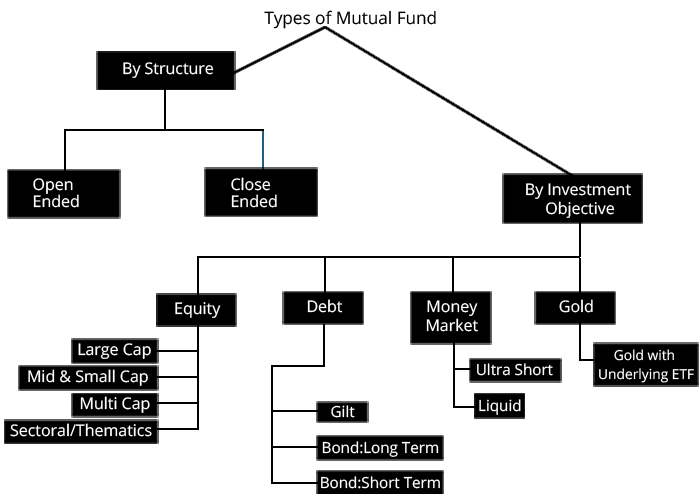
Mutual funds can be broadly classified based on the type of assets they invest in, their investment strategy and their objectives.
The major categories include -
- Equity Mutual Funds
- Debt Mutual Funds
- Hybrid Mutual Funds
- Solution-Oriented Schemes
- Other Mutual Fund Schemes
The following sections explain the major categories and how they differ.
1. Equity Mutual Funds
Equity mutual funds invest primarily in shares and equity-related securities. Their returns are linked to the performance of the underlying equity portfolio, so they can experience significant market fluctuations.
These funds are generally considered by investors seeking long-term capital growth and who are comfortable with equity-market volatility. The major equity-fund categories include:
Large-Cap Funds
Large-cap funds invest predominantly in large-cap companies. These companies are generally among the largest by full market capitalisation. Large-cap funds may be considered by investors seeking equity exposure to relatively established companies, although they remain subject to equity-market risk.
Mid-Cap Funds
Mid-cap funds invest predominantly in mid-cap companies. These companies are smaller than large-cap companies and can have greater growth potential, but they can also experience higher volatility. Mid-cap funds may therefore be more suitable for investors who can tolerate fluctuations and have an appropriately long investment horizon.
Large and Mid Cap Fund
Large & Mid-Cap Funds invest across both large-cap and mid-cap companies. This provides exposure to relatively established businesses as well as mid-sized companies with potential for growth. These funds remain equity-oriented and can experience significant market fluctuations.
SEBI has set a clear classification as to what is a large cap, mid cap and small cap:
| Market Capitalization | Description |
|---|---|
| Large cap company | 1st to 100th company in terms of full market capitalization |
| Mid cap company | 101st to 250th company in terms of full market capitalization |
| Small cap company | 251st company onwards in terms of full market capitalization |
Multi Cap Equity Fund
In multi-cap funds, the fund manager invests across the board in large-caps and mid-caps without any restriction (the only restriction being the fund mandate). A minimum of 65 percent of its total assets should be allocated to equities.
Equity Linked Savings Scheme
Equity Linked Savings Schemes (ELSS) is a tax saving fund that comes with a lock-in period of three years. A minimum of 80 percent of its total assets has to be invested in equities.
Dividend Yield Fund
This fund will predominantly invest in dividend yielding stocks. This scheme will invest a minimum 65 percent of its total assets in equities, but in dividend yielding stocks.
Value Fund
This is an equity fund that will follow the value investment strategy.
Contra Fund
This equity scheme will follow the contrarian investment strategy. Value/Contra will invest at least 65 percent of its total assets in equities, but a Mutual Fund house can either offer a value fund or a contra fund, but not both.
Focused Fund
This fund will focus on large, mid, small or multi-cap stocks, but can have a maximum of 30 stocks. focused fund can invest at least 65 percent of its total assets in equities.
Sector/Thematic Fund
These are the funds that invest in a particular sector or a theme. At least 80 percent of the total assets of these schemes will be invested in a particular sector or theme.
Index Funds
Index Funds are passively managed mutual funds that aim to replicate the performance of a market index, such as the Nifty 50 or Sensex. They invest in the securities of the underlying index in similar proportions, subject to tracking error and expenses.
2. Debt Funds
Debt mutual funds invest primarily in fixed-income and money-market instruments such as government securities, corporate bonds and other permitted debt instruments. The risk and return characteristics of debt funds vary depending on factors such as credit quality, interest-rate sensitivity and portfolio duration.
Major debt-fund categories include:
Overnight Fund
Overnight Funds invest in overnight securities with a maturity of one day. These funds generally carry relatively low interest-rate and credit risk because of the very short maturity of their underlying securities.
Liquid Fund
Liquid Funds invest in debt and money market securities with a maturity of up to 91 days. They are generally used by investors looking to park money for a short period while seeking relatively low volatility compared with longer-duration debt funds. Returns are not guaranteed, and the value of the investment can fluctuate.
Ultra Short Duration Fund
Ultra Short Duration Funds invest in debt and money market instruments with a Macaulay duration between three and six months. Their interest-rate sensitivity is generally higher than that of liquid funds because they invest in securities with longer durations.
Low Duration Fund
Low Duration Funds invest in debt and money market instruments with a Macaulay duration between six and 12 months. They generally have higher interest-rate sensitivity than ultra short duration funds.
Money Market Fund
Money Market Funds invest in money market instruments with a maturity of up to one year. These may include instruments such as Treasury Bills, commercial papers and certificates of deposit.
Short Duration Fund
Short Duration Funds invest in debt and money market instruments with a Macaulay duration between one and three years. Their returns can be affected by changes in interest rates as well as the credit quality of the securities in the portfolio.
Medium Duration Fund
Medium Duration Funds invest in debt and money market instruments with a Macaulay duration between three and four years. These funds are more sensitive to changes in interest rates than shorter-duration debt funds.
Medium to Long Duration Fund
Medium to Long Duration Funds invest in debt and money market instruments with a Macaulay duration between four and seven years. Their longer portfolio duration can make them more sensitive to changes in interest rates.
Long Duration Fund
Long Duration Funds invest in debt and money market instruments with a Macaulay duration greater than seven years. These funds can experience greater price fluctuations when interest rates change because of their longer duration.
Dynamic Bond Fund
Dynamic Bond Funds invest across different maturity periods. The fund manager can change the portfolio's duration and maturity profile based on the assessment of interest-rate movements and market conditions. As a result, the level of interest-rate risk can vary over time.
Corporate Bond Fund
Corporate Bond Funds predominantly invest in highly rated corporate bonds. Under the current classification, these schemes are required to invest at least 80% of total assets in AA+ and above rated corporate bonds, subject to the applicable regulations.
Credit Risk Fund
Credit Risk Funds invest predominantly in lower-rated corporate bonds and carry higher credit risk than categories that focus on highly rated securities. Under the current classification, these schemes are required to invest at least 65% of total assets in AA and below rated corporate bonds, excluding securities rated below investment grade.
Banking and PUS Fund
Banking and PSU Funds predominantly invest in debt securities issued by banks, public sector undertakings and public financial institutions. These funds generally focus on securities issued by these institutions, but investors should still consider credit and interest-rate risks before investing.
Gilt Fund
Gilt Funds invest predominantly in government securities issued by the central and state governments. They do not carry the same credit risk associated with corporate debt because the underlying securities are government securities, but they can be sensitive to changes in interest rates. Longer-duration gilt funds may experience greater price volatility when interest rates change.
Gilt Fund with 10-year Constant Duration
These funds invest predominantly in government securities while maintaining a portfolio Macaulay duration of around 10 years, in accordance with the applicable scheme classification. Because of their long duration, they can be particularly sensitive to changes in interest rates.
Floater Fund
Floater Funds predominantly invest in floating-rate instruments. Under the current classification, these schemes invest at least 65% of total assets in floating-rate instruments. Their interest-rate sensitivity can differ from fixed-rate debt funds because the interest payments on floating-rate securities can reset periodically.
3. Hybrid Funds
Hybrid mutual funds invest in more than one asset class, typically combining equity and debt. The allocation between asset classes varies across categories, which means hybrid funds can have different risk and return characteristics. Major hybrid-fund categories include -
Conservative Hybrid Fund
Conservative Hybrid Funds invest predominantly in debt instruments while maintaining a smaller allocation to equity and equity-related instruments. Under the current classification, these schemes invest 75% to 90% of their total assets in debt instruments and 10% to 25% in equity and equity-related instruments.
Balanced Hybrid Fund
Balanced Hybrid Funds invest in both equity and debt instruments, with 40% to 60% of total assets allocated to each. The category is designed to maintain a relatively balanced exposure to equity and debt, although the actual portfolio and risk level can vary within the permitted range.
Aggressive Hybrid Fund
Aggressive Hybrid Funds invest predominantly in equity and equity-related instruments, with 65% to 80% of total assets allocated to equity and equity-related instruments and 20% to 35% to debt instruments. The higher equity allocation gives these funds greater exposure to equity-market movements compared with conservative and balanced hybrid funds.
Dynamic Asset Allocation or Balanced Advantage Fund
This fund dynamically manage their allocation between equity and debt instruments. The fund manager can increase or reduce exposure to different asset classes based on the scheme's investment strategy and market conditions. The allocation can therefore change over time rather than remaining fixed.
Multi Asset Allocation
Multi Asset Allocation Funds invest across at least three asset classes, with a minimum allocation of 10% of total assets to each asset class. Apart from equity and debt, the scheme may invest in another asset class, such as commodities, subject to the applicable regulations. Foreign securities are not treated as a separate asset class for this purpose.
Arbitrage Fund
Arbitrage Funds seek to generate returns by taking advantage of price differences for the same or related securities across different market segments, such as the cash and derivatives markets. These schemes use an arbitrage strategy and must invest at least 65% of their total assets in equity and equity-related instruments.
Equity Savings
This invest in a combination of equity, equity-related instruments, arbitrage opportunities and debt. These schemes must invest at least 65% of total assets in equity and equity-related instruments and at least 10% in debt. The scheme's investment strategy specifies the minimum hedged and unhedged exposure in the Scheme Information Document (SID).
4. Solution Oriented Schemes
Retirement Fund
Retirement Funds are solution-oriented mutual fund schemes designed to help investors build a corpus for retirement. These schemes have a lock-in period of five years or until retirement age, whichever is earlier, subject to the applicable scheme terms.
Children’s Fund
Children's Funds are solution-oriented schemes designed to help investors build a corpus for a child's future needs. These schemes have a lock-in period of five years or until the child reaches the age of majority, whichever is earlier, subject to the applicable scheme terms.
5. Other Schemes
Exchange Traded Funds (ETFs)
ETFs are funds that are traded on stock exchanges like shares. They can track an index, commodity or other underlying assets and are bought and sold during market hours at prevailing market prices. A demat and trading account is generally required to invest in ETFs.
FoFs (Overseas Domestic)
A Fund of Funds (FoF) is a mutual fund scheme that invests primarily in units of other mutual fund schemes or other permitted underlying funds. Instead of directly holding a portfolio of individual securities, investors gain exposure to the underlying funds through a single mutual fund scheme.
6. Other Mutual Fund Categories to Consider
International Funds
International Funds invest in securities of companies, markets or funds outside India, depending on the scheme's investment objective. They may provide investors with exposure to international markets and currencies and can invest across developed markets, emerging markets or specific overseas sectors.
The level of risk depends on the underlying investments, geographical exposure, currency movements and market conditions.
Gold Funds
Gold Funds are mutual fund schemes that primarily invest in gold-related instruments, typically through units of gold ETFs or other permitted gold-related securities.
Unlike Gold ETFs, investors in a Gold Fund do not need a demat or trading account to purchase the mutual fund units. The value of the fund is influenced by movements in gold prices as well as the performance and expenses of the underlying investments.
Best Mutual Funds in India 2026
Fincash's mutual fund lists use quantitative filters and fund-level data to identify schemes for comparison.
Fund Selection Methodology used to find 10 funds
Top 10 Equity Mutual Funds
Fund NAV Net Assets (Cr) 3 MO (%) 6 MO (%) 1 YR (%) 3 YR (%) 5 YR (%) 2025 (%) DSP US Flexible Equity Fund Growth ₹91.9393
↓ -0.64 ₹1,280 0.3 8 31.5 27.2 17.3 33.8 Franklin Asian Equity Fund Growth ₹41.4645
↓ -0.29 ₹981 -6 2.9 19.9 20.8 5.8 23.7 DSP Natural Resources and New Energy Fund Growth ₹102.954
↓ -0.18 ₹2,528 -2.9 -6.2 10 16.5 12.5 17.5 Aditya Birla Sun Life Small Cap Fund Growth ₹93.2851
↓ -2.42 ₹6,120 -3.4 7.1 7.8 11.5 10.6 -3.7 SBI Small Cap Fund Growth ₹172.241
↓ -2.90 ₹41,059 -5.4 3 8.3 10.8 -4.9 Invesco India Growth Opportunities Fund Growth ₹101.65
↓ -1.71 ₹12,178 -7.9 1.5 -2.7 18.3 13.5 4.7 Tata India Tax Savings Fund Growth ₹43.8055
↓ -0.53 ₹4,427 -6.2 -4.1 -3.7 9.8 8.8 4.9 Bandhan Tax Advantage (ELSS) Fund Growth ₹148.454
↓ -0.78 ₹6,596 -3.5 -2.6 -4.9 7.7 8.5 8 Motilal Oswal Multicap 35 Fund Growth ₹59.7114
↓ -1.02 ₹13,446 -1.6 4.9 -5 15.1 10.6 -5.6 Tata Equity PE Fund Growth ₹334.56
↓ -4.42 ₹8,239 -4.7 -5.1 -6.4 10.3 10.3 3.7 Note: Returns up to 1 year are on absolute basis & more than 1 year are on CAGR basis. as on 19 Oct 26 Research Highlights & Commentary of 10 Funds showcased
Commentary DSP US Flexible Equity Fund Franklin Asian Equity Fund DSP Natural Resources and New Energy Fund Aditya Birla Sun Life Small Cap Fund SBI Small Cap Fund Invesco India Growth Opportunities Fund Tata India Tax Savings Fund Bandhan Tax Advantage (ELSS) Fund Motilal Oswal Multicap 35 Fund Tata Equity PE Fund Point 1 Bottom quartile AUM (₹1,280 Cr). Bottom quartile AUM (₹981 Cr). Bottom quartile AUM (₹2,528 Cr). Lower mid AUM (₹6,120 Cr). Highest AUM (₹41,059 Cr). Upper mid AUM (₹12,178 Cr). Lower mid AUM (₹4,427 Cr). Upper mid AUM (₹6,596 Cr). Top quartile AUM (₹13,446 Cr). Upper mid AUM (₹8,239 Cr). Point 2 Established history (14+ yrs). Established history (18+ yrs). Established history (18+ yrs). Established history (19+ yrs). Established history (17+ yrs). Established history (19+ yrs). Established history (12+ yrs). Established history (17+ yrs). Established history (12+ yrs). Oldest track record among peers (22 yrs). Point 3 Top rated. Rating: 5★ (top quartile). Rating: 5★ (upper mid). Rating: 5★ (upper mid). Rating: 5★ (upper mid). Rating: 5★ (lower mid). Rating: 5★ (lower mid). Rating: 5★ (bottom quartile). Rating: 5★ (bottom quartile). Rating: 5★ (bottom quartile). Point 4 Risk profile: High. Risk profile: High. Risk profile: High. Risk profile: Moderately High. Risk profile: Moderately High. Risk profile: Moderately High. Risk profile: Moderately High. Risk profile: Moderately High. Risk profile: Moderately High. Risk profile: Moderately High. Point 5 5Y return: 17.30% (top quartile). 5Y return: 5.77% (bottom quartile). 5Y return: 12.51% (upper mid). 5Y return: 10.64% (upper mid). 5Y return: 10.78% (upper mid). 5Y return: 13.55% (top quartile). 5Y return: 8.79% (bottom quartile). 5Y return: 8.53% (bottom quartile). 5Y return: 10.59% (lower mid). 5Y return: 10.34% (lower mid). Point 6 3Y return: 27.19% (top quartile). 3Y return: 20.75% (top quartile). 3Y return: 16.47% (upper mid). 3Y return: 11.54% (lower mid). 3Y return: 8.26% (bottom quartile). 3Y return: 18.34% (upper mid). 3Y return: 9.82% (bottom quartile). 3Y return: 7.67% (bottom quartile). 3Y return: 15.10% (upper mid). 3Y return: 10.30% (lower mid). Point 7 1Y return: 31.45% (top quartile). 1Y return: 19.94% (top quartile). 1Y return: 9.99% (upper mid). 1Y return: 7.83% (upper mid). 1Y return: 0.00% (upper mid). 1Y return: -2.65% (lower mid). 1Y return: -3.67% (lower mid). 1Y return: -4.95% (bottom quartile). 1Y return: -5.04% (bottom quartile). 1Y return: -6.43% (bottom quartile). Point 8 Alpha: -4.45 (bottom quartile). Alpha: 0.00 (lower mid). Alpha: 0.00 (bottom quartile). Alpha: 0.00 (bottom quartile). Alpha: 1.23 (upper mid). Alpha: 7.80 (top quartile). Alpha: 4.83 (top quartile). Alpha: 0.58 (upper mid). Alpha: 4.27 (upper mid). Alpha: 0.14 (lower mid). Point 9 Sharpe: 1.20 (top quartile). Sharpe: 1.04 (top quartile). Sharpe: 0.50 (upper mid). Sharpe: 0.62 (upper mid). Sharpe: 0.14 (upper mid). Sharpe: 0.14 (lower mid). Sharpe: -0.06 (bottom quartile). Sharpe: -0.30 (bottom quartile). Sharpe: -0.06 (lower mid). Sharpe: -0.30 (bottom quartile). Point 10 Information ratio: -0.08 (bottom quartile). Information ratio: 0.00 (upper mid). Information ratio: 0.00 (lower mid). Information ratio: 0.00 (lower mid). Information ratio: -0.29 (bottom quartile). Information ratio: 1.34 (top quartile). Information ratio: 0.25 (upper mid). Information ratio: -0.66 (bottom quartile). Information ratio: 0.75 (top quartile). Information ratio: 0.34 (upper mid). DSP US Flexible Equity Fund
Franklin Asian Equity Fund
DSP Natural Resources and New Energy Fund
Aditya Birla Sun Life Small Cap Fund
SBI Small Cap Fund
Invesco India Growth Opportunities Fund
Tata India Tax Savings Fund
Bandhan Tax Advantage (ELSS) Fund
Motilal Oswal Multicap 35 Fund
Tata Equity PE Fund
Top Debt 10 Mutual Funds
Fund NAV Net Assets (Cr) 3 MO (%) 6 MO (%) 1 YR (%) 3 YR (%) 2025 (%) Debt Yield (YTM) Mod. Duration Eff. Maturity PGIM India Insta Cash Fund Growth ₹368.049
↑ 0.03 ₹1,438 1.5 3.1 6.4 6.8 6.5 6.15% 1M 10D 1M 10D JM Liquid Fund Growth ₹77.0237
↓ 0.00 ₹1,701 1.5 3.1 6.3 6.7 6.4 6.12% 1M 8D 1M 11D Aditya Birla Sun Life Money Manager Fund Growth ₹401.312
↓ -0.31 ₹26,943 1.5 3.1 6.2 7.2 7.4 7.07% 4M 17D 4M 17D Aditya Birla Sun Life Savings Fund Growth ₹594.213
↓ -0.35 ₹16,279 1.4 3.1 6.2 7.2 7.4 7.61% 6M 7D 7M 13D UTI Banking & PSU Debt Fund Growth ₹23.636
↓ -0.02 ₹1,448 1.4 2.9 5.5 7.2 7.8 6.94% 5M 5D 5M 12D HDFC Banking and PSU Debt Fund Growth ₹24.2447
↓ -0.03 ₹5,055 -0.3 1.5 3.2 6.4 7.5 7.73% 2Y 9M 14D 3Y 9M Aditya Birla Sun Life Corporate Bond Fund Growth ₹118.722
↓ -0.19 ₹22,722 -0.5 1.5 3 6.6 7.4 7.82% 3Y 14D 4Y 1M 2D ICICI Prudential Long Term Plan Growth ₹38.6869
↓ -0.07 ₹12,863 -0.9 1.1 2.7 6.5 7.2 8.14% 5Y 10M 10D 13Y 7M 2D HDFC Corporate Bond Fund Growth ₹34.1169
↓ -0.06 ₹29,479 -0.7 1.3 2.7 6.5 7.3 7.8% 3Y 7M 2D 6Y 1M 20D Aditya Birla Sun Life Medium Term Plan Growth ₹43.6066
↓ -0.07 ₹3,370 0.1 2.3 6.7 9.6 10.9 7.99% 2Y 5M 8D 4Y 25D Note: Returns up to 1 year are on absolute basis & more than 1 year are on CAGR basis. as on 21 Oct 26 Research Highlights & Commentary of 10 Funds showcased
Commentary PGIM India Insta Cash Fund JM Liquid Fund Aditya Birla Sun Life Money Manager Fund Aditya Birla Sun Life Savings Fund UTI Banking & PSU Debt Fund HDFC Banking and PSU Debt Fund Aditya Birla Sun Life Corporate Bond Fund ICICI Prudential Long Term Plan HDFC Corporate Bond Fund Aditya Birla Sun Life Medium Term Plan Point 1 Bottom quartile AUM (₹1,438 Cr). Bottom quartile AUM (₹1,701 Cr). Top quartile AUM (₹26,943 Cr). Upper mid AUM (₹16,279 Cr). Bottom quartile AUM (₹1,448 Cr). Lower mid AUM (₹5,055 Cr). Upper mid AUM (₹22,722 Cr). Upper mid AUM (₹12,863 Cr). Highest AUM (₹29,479 Cr). Lower mid AUM (₹3,370 Cr). Point 2 Established history (19+ yrs). Established history (28+ yrs). Established history (21+ yrs). Established history (23+ yrs). Established history (12+ yrs). Established history (12+ yrs). Oldest track record among peers (29 yrs). Established history (16+ yrs). Established history (16+ yrs). Established history (17+ yrs). Point 3 Top rated. Rating: 5★ (top quartile). Rating: 5★ (upper mid). Rating: 5★ (upper mid). Rating: 5★ (upper mid). Rating: 5★ (lower mid). Rating: 5★ (lower mid). Rating: 5★ (bottom quartile). Rating: 5★ (bottom quartile). Rating: 4★ (bottom quartile). Point 4 Risk profile: Low. Risk profile: Low. Risk profile: Low. Risk profile: Moderately Low. Risk profile: Moderate. Risk profile: Moderately Low. Risk profile: Moderately Low. Risk profile: Moderate. Risk profile: Moderately Low. Risk profile: Moderate. Point 5 1Y return: 6.39% (top quartile). 1Y return: 6.26% (upper mid). 1Y return: 6.22% (upper mid). 1Y return: 6.16% (upper mid). 1Y return: 5.45% (lower mid). 1Y return: 3.23% (lower mid). 1Y return: 3.02% (bottom quartile). 1Y return: 2.72% (bottom quartile). 1Y return: 2.66% (bottom quartile). 1Y return: 6.66% (top quartile). Point 6 1M return: 0.45% (top quartile). 1M return: 0.44% (top quartile). 1M return: 0.30% (upper mid). 1M return: 0.30% (upper mid). 1M return: 0.27% (upper mid). 1M return: -0.56% (lower mid). 1M return: -0.62% (bottom quartile). 1M return: -1.13% (bottom quartile). 1M return: -0.76% (bottom quartile). 1M return: -0.45% (lower mid). Point 7 Sharpe: 3.02 (top quartile). Sharpe: 2.66 (top quartile). Sharpe: 0.88 (upper mid). Sharpe: 0.96 (upper mid). Sharpe: 0.22 (lower mid). Sharpe: -0.47 (bottom quartile). Sharpe: -0.45 (bottom quartile). Sharpe: -0.39 (lower mid). Sharpe: -0.54 (bottom quartile). Sharpe: 0.92 (upper mid). Point 8 Information ratio: 1.28 (top quartile). Information ratio: 0.33 (top quartile). Information ratio: 0.00 (upper mid). Information ratio: 0.00 (upper mid). Information ratio: 0.00 (upper mid). Information ratio: 0.00 (lower mid). Information ratio: 0.00 (lower mid). Information ratio: 0.00 (bottom quartile). Information ratio: 0.00 (bottom quartile). Information ratio: 0.00 (bottom quartile). Point 9 Yield to maturity (debt): 6.15% (bottom quartile). Yield to maturity (debt): 6.12% (bottom quartile). Yield to maturity (debt): 7.07% (lower mid). Yield to maturity (debt): 7.61% (lower mid). Yield to maturity (debt): 6.94% (bottom quartile). Yield to maturity (debt): 7.73% (upper mid). Yield to maturity (debt): 7.82% (upper mid). Yield to maturity (debt): 8.14% (top quartile). Yield to maturity (debt): 7.80% (upper mid). Yield to maturity (debt): 7.99% (top quartile). Point 10 Modified duration: 0.11 yrs (top quartile). Modified duration: 0.11 yrs (top quartile). Modified duration: 0.38 yrs (upper mid). Modified duration: 0.52 yrs (upper mid). Modified duration: 0.43 yrs (upper mid). Modified duration: 2.79 yrs (lower mid). Modified duration: 3.04 yrs (bottom quartile). Modified duration: 5.86 yrs (bottom quartile). Modified duration: 3.59 yrs (bottom quartile). Modified duration: 2.44 yrs (lower mid). PGIM India Insta Cash Fund
JM Liquid Fund
Aditya Birla Sun Life Money Manager Fund
Aditya Birla Sun Life Savings Fund
UTI Banking & PSU Debt Fund
HDFC Banking and PSU Debt Fund
Aditya Birla Sun Life Corporate Bond Fund
ICICI Prudential Long Term Plan
HDFC Corporate Bond Fund
Aditya Birla Sun Life Medium Term Plan
The primary investment objective of the Scheme is to seek to provide long term capital growth by investing predominantly in the JPMorgan Funds - Emerging Markets Opportunities Fund, an equity fund which invests primarily in an aggressively managed portfolio of emerging market companies Research Highlights for Edelweiss Emerging Markets Opportunities Equity Off-shore Fund Below is the key information for Edelweiss Emerging Markets Opportunities Equity Off-shore Fund Returns up to 1 year are on To generate long term capital appreciation from a portfolio that is predominantly in equity and equity related instruments Research Highlights for HDFC Long Term Advantage Fund Below is the key information for HDFC Long Term Advantage Fund Returns up to 1 year are on The primary investment objective of the Scheme is to seek capital appreciation by investing predominantly in units of BGF – USFEF. The Scheme may, at the discretion of the Investment Manager also invest in the units of other similar overseas mutual fund schemes, which may constitute a significant part of its corpus. The Scheme may also invest a certain portion of its corpus in money market securities and/or money market/liquid schemes of DSP BlackRock Mutual Fund, in order to meet liquidity requirements from time to time. However, there is no assurance that the investment objective of the Scheme will be realized. It shall be noted ‘similar overseas mutual fund schemes’ shall have investment objective, investment strategy and risk profile/consideration similar to those of BGF – USFEF. Research Highlights for DSP US Flexible Equity Fund Below is the key information for DSP US Flexible Equity Fund Returns up to 1 year are on (Erstwhile Sundaram Balanced Fund) The scheme seeks to generate capital appreciation and current income through a judicious mix of investments in equities and fixed income securities. Research Highlights for Sundaram Equity Hybrid Fund Below is the key information for Sundaram Equity Hybrid Fund Returns up to 1 year are on The investment objective of the scheme is to provide long-term capital appreciation by investing in an overseas mutual fund scheme that invests in a diversified portfolio of securities as prescribed by SEBI from time to time in global emerging markets. Research Highlights for Kotak Global Emerging Market Fund Below is the key information for Kotak Global Emerging Market Fund Returns up to 1 year are on (Erstwhile Invesco India Pan European Equity Fund) To generate capital appreciation by investing predominantly in units of Invesco Pan European Equity Fund, an overseas equity fund which invests primarily in equity securities of European companies with an emphasis on larger companies.
The Scheme may, at the discretion of Fund Manager, also invest in units of
other similar Overseas Mutual Funds with similar objectives, strategy and
attributes which may constitute a significant portion of its net assets. Research Highlights for Invesco India Feeder- Invesco Pan European Equity Fund Below is the key information for Invesco India Feeder- Invesco Pan European Equity Fund Returns up to 1 year are on The objective of the fund will be to provide investors with an opportunity to invest in a portfolio of a mix of equity and equity related securities and fixed income instruments. The allocation between fixed income and equity instruments will be managed dynamically so as to provide investors with long term capital appreciation However, there can be no assurance that the investment objective of the Scheme will be achieved. Research Highlights for SBI Dynamic Asset Allocation Fund Below is the key information for SBI Dynamic Asset Allocation Fund Returns up to 1 year are on To achieve capital appreciation by investing in
equity and equity related instruments of select
stocks Research Highlights for Sundaram Select Focus Fund Below is the key information for Sundaram Select Focus Fund Returns up to 1 year are on The primary investment objective of Reliance Japan Equity Fund is to provide long term capital appreciation to investors by primarily investing in equity and equity related securities of companies listed on the recognized stock exchanges of Japan and the secondary objective is to generate consistent returns by investing in debt and money market securities of India. However, there can be no assurance or guarantee that the investment objective of the scheme will be achieved. Research Highlights for Nippon India Japan Equity Fund Below is the key information for Nippon India Japan Equity Fund Returns up to 1 year are on "The primary investment objective of the Scheme is to seek capital appreciation by investing predominantly in units of MLIIF - WGF. The Scheme may, at the discretion of the Investment Manager, also invest in the units of other similar overseas mutual fund schemes, which may constitute a significant part of its corpus. The Scheme may also invest a certain portion of its corpus in money market securities and/or units of money market/liquid schemes of DSP Merrill Lynch Mutual Fund, in order to meet liquidity requirements from time to time. However, there is no assurance that the investment objective of the Scheme will be realized." Research Highlights for DSP World Gold Fund Below is the key information for DSP World Gold Fund Returns up to 1 year are on 1. Edelweiss Emerging Markets Opportunities Equity Off-shore Fund
Edelweiss Emerging Markets Opportunities Equity Off-shore Fund
Growth Launch Date 7 Jul 14 NAV (19 Oct 26) ₹27.0085 ↓ -0.08 (-0.28 %) Net Assets (Cr) ₹270 on 30 Sep 26 Category Equity - Global AMC Edelweiss Asset Management Limited Rating ☆☆☆ Risk High Expense Ratio 1.44 Sharpe Ratio 1.42 Information Ratio -0.4 Alpha Ratio 2.42 Min Investment 5,000 Min SIP Investment 1,000 Exit Load 0-1 Years (1%),1 Years and above(NIL) Growth of 10,000 investment over the years.
Date Value 30 Sep 21 ₹10,000 30 Sep 22 ₹7,237 30 Sep 23 ₹7,991 30 Sep 24 ₹9,608 30 Sep 25 ₹11,929 30 Sep 26 ₹17,049 Returns for Edelweiss Emerging Markets Opportunities Equity Off-shore Fund
absolute basis & more than 1 year are on CAGR (Compound Annual Growth Rate) basis. as on 19 Oct 26 Duration Returns 1 Month -4.2% 3 Month -0.6% 6 Month 4.5% 1 Year 36.8% 3 Year 27.5% 5 Year 9.1% 10 Year 15 Year Since launch 8.4% Historical performance (Yearly) on absolute basis
Year Returns 2025 41.1% 2024 5.9% 2023 5.5% 2022 -16.8% 2021 -5.9% 2020 21.7% 2019 25.1% 2018 -7.2% 2017 30% 2016 9.8% Fund Manager information for Edelweiss Emerging Markets Opportunities Equity Off-shore Fund
Name Since Tenure Bhavesh Jain 9 Apr 18 8.4 Yr. Bharat Lahoti 1 Oct 21 4.92 Yr. Data below for Edelweiss Emerging Markets Opportunities Equity Off-shore Fund as on 30 Sep 26
Equity Sector Allocation
Sector Value Technology 36.75% Financial Services 23.82% Consumer Cyclical 9.38% Communication Services 6.79% Industrials 6.01% Energy 3.77% Basic Materials 2.33% Consumer Defensive 2.2% Utility 2% Health Care 0.51% Asset Allocation
Asset Class Value Cash 5.17% Equity 94.83% Debt 0% Top Securities Holdings / Portfolio
Name Holding Value Quantity JPM Emerging Mkts Opps I acc USD
Investment Fund | -96% ₹264 Cr 114,732
↑ 2,676 Clearing Corporation Of India Ltd.
CBLO/Reverse Repo | -4% ₹11 Cr Net Receivables/(Payables)
CBLO | -0% ₹0 Cr Accrued Interest
CBLO | -0% ₹0 Cr 2. HDFC Long Term Advantage Fund
HDFC Long Term Advantage Fund
Growth Launch Date 2 Jan 01 NAV (14 Jan 22) ₹595.168 ↑ 0.28 (0.05 %) Net Assets (Cr) ₹1,318 on 30 Nov 21 Category Equity - ELSS AMC HDFC Asset Management Company Limited Rating ☆☆☆ Risk Moderately High Expense Ratio 2.25 Sharpe Ratio 2.27 Information Ratio -0.15 Alpha Ratio 1.75 Min Investment 500 Min SIP Investment 500 Exit Load NIL Growth of 10,000 investment over the years.
Date Value
Purchase not allowed Returns for HDFC Long Term Advantage Fund
absolute basis & more than 1 year are on CAGR (Compound Annual Growth Rate) basis. as on 19 Oct 26 Duration Returns 1 Month 4.4% 3 Month 1.2% 6 Month 15.4% 1 Year 35.5% 3 Year 20.6% 5 Year 17.4% 10 Year 15 Year Since launch 21.4% Historical performance (Yearly) on absolute basis
Year Returns 2025 2024 2023 2022 2021 2020 2019 2018 2017 2016 Fund Manager information for HDFC Long Term Advantage Fund
Name Since Tenure Data below for HDFC Long Term Advantage Fund as on 30 Nov 21
Equity Sector Allocation
Sector Value Asset Allocation
Asset Class Value Top Securities Holdings / Portfolio
Name Holding Value Quantity 3. DSP US Flexible Equity Fund
DSP US Flexible Equity Fund
Growth Launch Date 3 Aug 12 NAV (19 Oct 26) ₹91.9393 ↓ -0.64 (-0.69 %) Net Assets (Cr) ₹1,280 on 30 Sep 26 Category Equity - Global AMC DSP BlackRock Invmt Managers Pvt. Ltd. Rating ☆☆☆☆☆ Risk High Expense Ratio 1.55 Sharpe Ratio 1.2 Information Ratio -0.08 Alpha Ratio -4.45 Min Investment 1,000 Min SIP Investment 500 Exit Load 0-12 Months (1%),12 Months and above(NIL) Growth of 10,000 investment over the years.
Date Value 30 Sep 21 ₹10,000 30 Sep 22 ₹9,295 30 Sep 23 ₹11,197 30 Sep 24 ₹13,853 30 Sep 25 ₹17,875 30 Sep 26 ₹23,358 Returns for DSP US Flexible Equity Fund
absolute basis & more than 1 year are on CAGR (Compound Annual Growth Rate) basis. as on 19 Oct 26 Duration Returns 1 Month -0.5% 3 Month 0.3% 6 Month 8% 1 Year 31.5% 3 Year 27.2% 5 Year 17.3% 10 Year 15 Year Since launch 16.9% Historical performance (Yearly) on absolute basis
Year Returns 2025 33.8% 2024 17.8% 2023 22% 2022 -5.9% 2021 24.2% 2020 22.6% 2019 27.5% 2018 -1.1% 2017 15.5% 2016 9.8% Fund Manager information for DSP US Flexible Equity Fund
Name Since Tenure Kaivalya Nadkarni 1 May 25 1.34 Yr. Data below for DSP US Flexible Equity Fund as on 30 Sep 26
Equity Sector Allocation
Sector Value Technology 32.91% Industrials 12.97% Communication Services 11.37% Consumer Cyclical 9.78% Financial Services 9.58% Health Care 9.41% Energy 2.81% Basic Materials 2.31% Utility 2.1% Consumer Defensive 0.65% Asset Allocation
Asset Class Value Cash 6.12% Equity 93.87% Debt 0.01% Top Securities Holdings / Portfolio
Name Holding Value Quantity BGF US Flexible Equity I2
Investment Fund | -96% ₹1,220 Cr 1,784,131 Treps / Reverse Repo Investments
CBLO/Reverse Repo | -4% ₹52 Cr Net Receivables/Payables
Net Current Assets | -0% -₹2 Cr 4. Sundaram Equity Hybrid Fund
Sundaram Equity Hybrid Fund
Growth Launch Date 23 Jun 00 NAV (31 Dec 21) ₹135.137 ↑ 0.78 (0.58 %) Net Assets (Cr) ₹1,954 on 30 Nov 21 Category Hybrid - Hybrid Equity AMC Sundaram Asset Management Company Ltd Rating ☆☆ Risk Moderately High Expense Ratio 2.18 Sharpe Ratio 2.64 Information Ratio -0.12 Alpha Ratio 5.81 Min Investment 5,000 Min SIP Investment 100 Exit Load 0-12 Months (1%),12 Months and above(NIL) Growth of 10,000 investment over the years.
Date Value Returns for Sundaram Equity Hybrid Fund
absolute basis & more than 1 year are on CAGR (Compound Annual Growth Rate) basis. as on 19 Oct 26 Duration Returns 1 Month 1.8% 3 Month 0.5% 6 Month 10.5% 1 Year 27.1% 3 Year 16% 5 Year 14.2% 10 Year 15 Year Since launch 12.8% Historical performance (Yearly) on absolute basis
Year Returns 2025 2024 2023 2022 2021 2020 2019 2018 2017 2016 Fund Manager information for Sundaram Equity Hybrid Fund
Name Since Tenure Data below for Sundaram Equity Hybrid Fund as on 30 Nov 21
Asset Allocation
Asset Class Value Equity Sector Allocation
Sector Value Debt Sector Allocation
Sector Value Credit Quality
Rating Value Top Securities Holdings / Portfolio
Name Holding Value Quantity 5. Kotak Global Emerging Market Fund
Kotak Global Emerging Market Fund
Growth Launch Date 26 Sep 07 NAV (19 Oct 26) ₹36.956 ↓ -0.23 (-0.63 %) Net Assets (Cr) ₹1,733 on 30 Sep 26 Category Equity - Global AMC Kotak Mahindra Asset Management Co Ltd Rating ☆☆☆ Risk High Expense Ratio 1.64 Sharpe Ratio 1.09 Information Ratio -0.81 Alpha Ratio -5.87 Min Investment 5,000 Min SIP Investment 1,000 Exit Load 0-1 Years (1%),1 Years and above(NIL) Growth of 10,000 investment over the years.
Date Value 30 Sep 21 ₹10,000 30 Sep 22 ₹7,972 30 Sep 23 ₹8,771 30 Sep 24 ₹10,660 30 Sep 25 ₹13,233 30 Sep 26 ₹17,897 Returns for Kotak Global Emerging Market Fund
absolute basis & more than 1 year are on CAGR (Compound Annual Growth Rate) basis. as on 19 Oct 26 Duration Returns 1 Month -7.7% 3 Month -2.5% 6 Month 2.5% 1 Year 26.5% 3 Year 24.5% 5 Year 9.4% 10 Year 15 Year Since launch 7.1% Historical performance (Yearly) on absolute basis
Year Returns 2025 39.1% 2024 5.9% 2023 10.8% 2022 -15% 2021 -0.5% 2020 29.1% 2019 21.4% 2018 -14.4% 2017 30.4% 2016 -1.2% Fund Manager information for Kotak Global Emerging Market Fund
Name Since Tenure Arjun Khanna 9 May 19 7.32 Yr. Data below for Kotak Global Emerging Market Fund as on 30 Sep 26
Equity Sector Allocation
Sector Value Technology 38.58% Financial Services 21.65% Consumer Cyclical 8.14% Industrials 8.03% Basic Materials 7.19% Communication Services 5.09% Energy 4.9% Health Care 2.46% Asset Allocation
Asset Class Value Cash 3.97% Equity 96.03% Top Securities Holdings / Portfolio
Name Holding Value Quantity CI Emerging Markets Class I
Investment Fund | -98% ₹1,695 Cr 4,595,108
↑ 4,595,108 Triparty Repo
CBLO/Reverse Repo | -2% ₹37 Cr Net Current Assets/(Liabilities)
Net Current Assets | -0% -₹3 Cr CI Emerging Markets Class A
Investment Fund | -₹0 Cr 00
↓ -4,597,762 6. Invesco India Feeder- Invesco Pan European Equity Fund
Invesco India Feeder- Invesco Pan European Equity Fund
Growth Launch Date 31 Jan 14 NAV (21 Oct 26) ₹25.5173 ↓ -0.08 (-0.29 %) Net Assets (Cr) ₹235 on 30 Sep 26 Category Equity - Global AMC Invesco Asset Management (India) Private Ltd Rating ☆☆☆ Risk High Expense Ratio 0.93 Sharpe Ratio 1.29 Information Ratio 0 Alpha Ratio 0 Min Investment 5,000 Min SIP Investment 500 Exit Load 0-1 Years (1%),1 Years and above(NIL) Growth of 10,000 investment over the years.
Date Value 30 Sep 21 ₹10,000 30 Sep 22 ₹8,238 30 Sep 23 ₹11,523 30 Sep 24 ₹13,304 30 Sep 25 ₹15,627 30 Sep 26 ₹20,258 Returns for Invesco India Feeder- Invesco Pan European Equity Fund
absolute basis & more than 1 year are on CAGR (Compound Annual Growth Rate) basis. as on 19 Oct 26 Duration Returns 1 Month -4.8% 3 Month -3.3% 6 Month 2.1% 1 Year 25.8% 3 Year 21.2% 5 Year 13.7% 10 Year 15 Year Since launch 7.6% Historical performance (Yearly) on absolute basis
Year Returns 2025 42.5% 2024 -5.1% 2023 20.5% 2022 1.6% 2021 16.6% 2020 1.6% 2019 17.2% 2018 -11.2% 2017 14.8% 2016 -0.2% Fund Manager information for Invesco India Feeder- Invesco Pan European Equity Fund
Name Since Tenure Sagar Gandhi 1 Mar 25 1.5 Yr. Data below for Invesco India Feeder- Invesco Pan European Equity Fund as on 30 Sep 26
Equity Sector Allocation
Sector Value Industrials 25.57% Financial Services 22.37% Technology 9.07% Health Care 8.4% Consumer Defensive 7.76% Basic Materials 6.54% Energy 6.24% Utility 4.22% Consumer Cyclical 3.36% Communication Services 2.62% Asset Allocation
Asset Class Value Cash 3.86% Equity 96.14% Top Securities Holdings / Portfolio
Name Holding Value Quantity Invesco Pan European Equity C EUR Acc
Investment Fund | -97% ₹222 Cr 463,645 Triparty Repo
CBLO/Reverse Repo | -3% ₹8 Cr Net Receivables / (Payables)
Net Current Assets | -0% ₹0 Cr 7. SBI Dynamic Asset Allocation Fund
SBI Dynamic Asset Allocation Fund
Growth Launch Date 26 Mar 15 NAV (02 Jul 21) ₹15.9463 ↑ 0.03 (0.18 %) Net Assets (Cr) ₹655 on 31 May 21 Category Hybrid - Dynamic Allocation AMC SBI Funds Management Private Limited Rating Risk Moderately High Expense Ratio 2.07 Sharpe Ratio 2.59 Information Ratio 0 Alpha Ratio 0 Min Investment 5,000 Min SIP Investment 500 Exit Load 0-12 Months (1%),12 Months and above(NIL) Growth of 10,000 investment over the years.
Date Value Returns for SBI Dynamic Asset Allocation Fund
absolute basis & more than 1 year are on CAGR (Compound Annual Growth Rate) basis. as on 19 Oct 26 Duration Returns 1 Month 1% 3 Month 3.9% 6 Month 6.2% 1 Year 25.1% 3 Year 6.9% 5 Year 8.3% 10 Year 15 Year Since launch 7.7% Historical performance (Yearly) on absolute basis
Year Returns 2025 2024 2023 2022 2021 2020 2019 2018 2017 2016 Fund Manager information for SBI Dynamic Asset Allocation Fund
Name Since Tenure Data below for SBI Dynamic Asset Allocation Fund as on 31 May 21
Asset Allocation
Asset Class Value Equity Sector Allocation
Sector Value Debt Sector Allocation
Sector Value Credit Quality
Rating Value Top Securities Holdings / Portfolio
Name Holding Value Quantity 8. Sundaram Select Focus Fund
Sundaram Select Focus Fund
Growth Launch Date 30 Jul 02 NAV (24 Dec 21) ₹264.968 ↓ -1.18 (-0.45 %) Net Assets (Cr) ₹1,354 on 30 Nov 21 Category Equity - Focused AMC Sundaram Asset Management Company Ltd Rating ☆☆☆ Risk Moderately High Expense Ratio 2.52 Sharpe Ratio 1.85 Information Ratio -0.52 Alpha Ratio -5.62 Min Investment 5,000 Min SIP Investment 100 Exit Load 0-12 Months (1%),12 Months and above(NIL) Growth of 10,000 investment over the years.
Date Value Returns for Sundaram Select Focus Fund
absolute basis & more than 1 year are on CAGR (Compound Annual Growth Rate) basis. as on 19 Oct 26 Duration Returns 1 Month -2.6% 3 Month -5% 6 Month 8.5% 1 Year 24.5% 3 Year 17% 5 Year 17.3% 10 Year 15 Year Since launch 18.4% Historical performance (Yearly) on absolute basis
Year Returns 2025 2024 2023 2022 2021 2020 2019 2018 2017 2016 Fund Manager information for Sundaram Select Focus Fund
Name Since Tenure Data below for Sundaram Select Focus Fund as on 30 Nov 21
Equity Sector Allocation
Sector Value Asset Allocation
Asset Class Value Top Securities Holdings / Portfolio
Name Holding Value Quantity 9. Nippon India Japan Equity Fund
Nippon India Japan Equity Fund
Growth Launch Date 26 Aug 14 NAV (21 Oct 26) ₹27.6493 ↓ -0.16 (-0.57 %) Net Assets (Cr) ₹358 on 30 Sep 26 Category Equity - Global AMC Nippon Life Asset Management Ltd. Rating ☆☆☆☆ Risk High Expense Ratio 2.45 Sharpe Ratio 1.24 Information Ratio -1.05 Alpha Ratio -4.8 Min Investment 5,000 Min SIP Investment 100 Exit Load 0-1 Years (1%),1 Years and above(NIL) Growth of 10,000 investment over the years.
Date Value 30 Sep 21 ₹10,000 30 Sep 22 ₹7,261 30 Sep 23 ₹8,830 30 Sep 24 ₹10,988 30 Sep 25 ₹12,484 30 Sep 26 ₹15,992 Returns for Nippon India Japan Equity Fund
absolute basis & more than 1 year are on CAGR (Compound Annual Growth Rate) basis. as on 19 Oct 26 Duration Returns 1 Month -1.2% 3 Month 0.7% 6 Month 8.3% 1 Year 24.1% 3 Year 22.3% 5 Year 9.7% 10 Year 15 Year Since launch 10% Historical performance (Yearly) on absolute basis
Year Returns 2025 19.8% 2024 9.3% 2023 18.7% 2022 -15.3% 2021 5.7% 2020 2019 2018 2017 2016 Fund Manager information for Nippon India Japan Equity Fund
Name Since Tenure Kinjal Desai 25 May 18 8.28 Yr. Amber Singhania 11 Mar 26 0.48 Yr. Data below for Nippon India Japan Equity Fund as on 30 Sep 26
Equity Sector Allocation
Sector Value Industrials 27.39% Financial Services 15.8% Consumer Cyclical 11.46% Consumer Defensive 9.44% Technology 7.93% Communication Services 7.12% Basic Materials 5.59% Health Care 3.33% Real Estate 3.16% Asset Allocation
Asset Class Value Cash 8.79% Equity 91.21% Top Securities Holdings / Portfolio
Name Holding Value Quantity Recruit Holdings Co Ltd (Communication Services)
Equity, Since 30 Jun 23 | 60985% ₹18 Cr 16,100 Nippon Yusen Kabushiki Kaisha (Industrials)
Equity, Since 30 Jun 24 | 91014% ₹13 Cr 31,700 Kao Corp (Consumer Defensive)
Equity, Since 30 Jun 23 | 44524% ₹12 Cr 57,000 Bridgestone Corp (Consumer Cyclical)
Equity, Since 30 Jun 25 | 51084% ₹12 Cr 49,900 Nomura Holdings Inc (Financial Services)
Equity, Since 30 Jun 26 | 86043% ₹12 Cr 122,600 Hitachi Ltd (Industrials)
Equity, Since 31 Aug 14 | 65013% ₹12 Cr 36,500 Mitsubishi UFJ Financial Group Inc (Financial Services)
Equity, Since 31 Aug 14 | 83063% ₹12 Cr 53,700 ITOCHU Corp (Industrials)
Equity, Since 30 Jun 26 | 80013% ₹12 Cr 93,300 Terumo Corp (Healthcare)
Equity, Since 30 Jun 25 | 45433% ₹12 Cr 78,100 Keyence Corp (Technology)
Equity, Since 30 Jun 23 | 68613% ₹11 Cr 2,300 10. DSP World Gold Fund
DSP World Gold Fund
Growth Launch Date 14 Sep 07 NAV (19 Oct 26) ₹56.879 ↓ -0.84 (-1.45 %) Net Assets (Cr) ₹1,665 on 30 Sep 26 Category Equity - Global AMC DSP BlackRock Invmt Managers Pvt. Ltd. Rating ☆☆☆ Risk High Expense Ratio 1.41 Sharpe Ratio 0.67 Information Ratio -0.8 Alpha Ratio 4.06 Min Investment 1,000 Min SIP Investment 500 Exit Load 0-12 Months (1%),12 Months and above(NIL) Growth of 10,000 investment over the years.
Date Value 30 Sep 21 ₹10,000 30 Sep 22 ₹8,263 30 Sep 23 ₹9,670 30 Sep 24 ₹14,147 30 Sep 25 ₹28,247 30 Sep 26 ₹37,014 Returns for DSP World Gold Fund
absolute basis & more than 1 year are on CAGR (Compound Annual Growth Rate) basis. as on 19 Oct 26 Duration Returns 1 Month -8.8% 3 Month 19.8% 6 Month -10.9% 1 Year 21.5% 3 Year 51.2% 5 Year 26.2% 10 Year 15 Year Since launch 9.5% Historical performance (Yearly) on absolute basis
Year Returns 2025 167.1% 2024 15.9% 2023 7% 2022 -7.7% 2021 -9% 2020 31.4% 2019 35.1% 2018 -10.7% 2017 -4% 2016 52.7% Fund Manager information for DSP World Gold Fund
Name Since Tenure Kaivalya Nadkarni 1 May 25 1.34 Yr. Data below for DSP World Gold Fund as on 30 Sep 26
Equity Sector Allocation
Sector Value Basic Materials 92.97% Asset Allocation
Asset Class Value Cash 4.49% Equity 93.67% Debt 0% Other 1.84% Top Securities Holdings / Portfolio
Name Holding Value Quantity BGF World Gold I2
Investment Fund | -67% ₹1,220 Cr 958,135
↓ -25,317 VanEck Gold Miners ETF
- | GDX30% ₹539 Cr 573,719 Treps / Reverse Repo Investments
CBLO/Reverse Repo | -4% ₹74 Cr Net Receivables/Payables
Net Current Assets | -0% -₹5 Cr
Mutual Fund Companies in India
Mutual fund companies in India are commonly referred to as Asset Management Companies (AMCs). They manage mutual fund schemes across categories such as equity, debt, hybrid and other asset classes. Investors can compare mutual fund schemes based on their individual objectives rather than selecting a fund house solely because of its size.
Some of the major AMCs operating in India include SBI Mutual Fund, HDFC Mutual Fund, ICICI Prudential Mutual Fund, Nippon India Mutual Fund, UTI Mutual Fund, Aditya Birla Sun Life Mutual Fund, Kotak Mutual Fund, Axis Mutual Fund and others.
How to Invest in Mutual Funds in India
Investors can invest in mutual funds through several routes, including directly through a mutual fund house or through an investment platform, distributor or financial intermediary.
Before investing, consider the following steps:
- Define your financial goal — Determine what you are investing for and when you may need the money
- Assess your risk tolerance — Understand how much market fluctuation you can comfortably handle
- Choose the appropriate mutual fund category — Select a category based on your goal, time horizon and risk profile
- Compare suitable schemes — Review performance, risk, costs, portfolio and investment strategy
- Choose SIP or lump-sum investing — Select an investment method that fits your cash flow and financial plan
- Review periodically — Monitor whether the investment continues to suit your financial goals
Choosing a Mutual Fund Based on Your Goal
The mutual fund category you choose should depend on your financial objective, investment horizon and risk tolerance. For example, an investor with a long-term wealth-creation goal and a higher tolerance for equity-market volatility may consider equity-oriented funds, while an investor seeking exposure to fixed-income securities may consider debt funds.
Hybrid funds combine different asset classes and may be considered by investors looking for a diversified approach across equity and debt. There is no single mutual fund category that is appropriate for every investor or every financial goal.
What Is Mutual Fund NAV?
Net Asset Value (NAV) represents the per-unit value of a mutual fund scheme. The NAV is calculated based on the value of the scheme's assets after accounting for applicable liabilities and expenses. Mutual fund NAVs are published regularly as required under applicable regulations.
Importantly, a lower NAV does not automatically mean that a mutual fund is cheaper or a better investment. Fund selection should be based on the scheme's portfolio, objective, performance, risk and other relevant factors.
Mutual Fund Calculator
A mutual fund calculator can help investors estimate how much they may need to invest to work towards a financial goal. For SIP calculations, you can enter the investment amount, expected rate of return and investment period to estimate the potential value of the investment.
These calculations are only illustrations. Actual mutual fund returns can vary because market-linked investments do not provide guaranteed returns.
Know Your Monthly SIP Amount
Mutual Fund Ratings
Mutual fund ratings and rankings can be useful as a starting point when comparing schemes, but they should not be the only basis for an investment decision. Different rating methodologies may consider factors such as historical performance, risk, consistency and portfolio characteristics.
Before investing, investors should also examine the fund's category, investment objective, risk level, costs and portfolio.
Conclusion
Mutual funds provide investors with access to different asset classes and investment strategies through professionally managed schemes. However, choosing a mutual fund should not begin with simply searching for the fund with the highest return. Investors should first identify their financial goal, investment horizon and risk tolerance, then select an appropriate category and compare suitable schemes based on performance, risk, costs, portfolio and investment strategy.
A disciplined approach to Mutual Fund Investing can help investors make decisions that are aligned with their individual financial goals.
All efforts have been made to ensure the information provided here is accurate. However, no guarantees are made regarding correctness of data. Please verify with scheme information document before making any investment.







AMFI Registration No. 112358 | CIN: U74999MH2016PTC282153
Shepard Technologies Pvt. Ltd. (with ARN code 112358) makes no warranties or representations, express or implied, on products offered through the platform. It accepts no liability for any damages or losses, however caused, in connection with the use of, or on the reliance of its product or related services. Terms and conditions of the website are applicable.
©2026 Shepard Technologies Private Limited. All Rights Reserved
Thanks A Lot for more valuable information. Please provide such information on insurance life and health
Best mutual fund for 2 to 5 year investment in single schemes
Educative and very Useful information. Thank you.
Great Read. Informative Page about all types of mutual funds.