8 Best International Mutual Funds 2026
Indian investors have traditionally preferred domestic investments like equity Mutual Funds, fixed deposits, and Real Estate. But in today’s interconnected world, relying only on India’s growth story can be limiting. International Mutual Funds give you a chance to invest in global markets — from Silicon Valley’s tech giants like Apple and Microsoft to Europe’s luxury brands and Asia’s fast-growing economies.

With the Indian economy becoming more globalised and investors looking for smarter diversification, International Mutual Funds are emerging as an attractive option in 2026. This guide explains everything — meaning, benefits, risks, taxation, best-performing funds, and whether you should add them to your Portfolio.
What Are International Mutual Funds?
International Mutual Funds are schemes that invest in companies outside India. Instead of buying foreign shares directly (which requires opening a global Trading Account and dealing with complex taxation), you can invest in such companies through Indian AMCs (Asset Management Companies).
Types of Structures
Feeder Funds – Indian AMCs collect money from investors and channel it into an overseas fund. Example: Franklin India Feeder – Franklin U.S. Opportunities Fund.
fund of funds (FoFs) – A fund that invests in another international mutual fund, ETF, or index abroad.
Direct International Equity Funds – A few funds may directly buy foreign stocks (less common).
Why Should Indians Invest in International Mutual Funds?
1. Geographic Diversification
Putting all your money in India means your wealth depends solely on how the Indian economy performs. Global exposure spreads risk. For example, if Indian IT underperforms but U.S. tech thrives, international funds balance your portfolio.
2. Exposure to Global Giants
Think about this: India doesn’t have companies like Apple, Tesla, Microsoft, Amazon, or NVIDIA listed on NSE/BSE. International funds give access to these global leaders.
3. Currency Advantage
If the Indian Rupee depreciates against the U.S. Dollar (which historically it has — from ₹45/USD in 2010 to ~₹83/USD in 2025), your international fund value rises in INR terms.
4. Thematic Opportunities
Global themes like Artificial Intelligence, Electric Vehicles, Green Energy, Biotechnology, and Semiconductors can be tapped into via such funds.
5. Risk Balancing
Different economies move differently. For instance, when India faced COVID shocks in 2020, U.S. tech rallied. This balance helps reduce Volatility.
Risks of International Mutual Funds
Currency Fluctuations – A strong rupee may reduce your returns.
Geopolitical Risks – Wars, trade disputes, sanctions can affect global companies.
Regulatory Risks – India’s RBI and SEBI impose limits under the Liberalised Remittance Scheme (LRS).
Higher Expense Ratios – Because of fund-of-fund structures and foreign management costs.
Concentration Risk – Many funds are U.S.-centric; you may lack true global diversification.
Background of International Mutual Funds in India
With the permission of Reserve Bank of India (RBI), International Mutual Funds opened up in India in 2007. Each fund is allowed to get a corpus of USD 500 million.
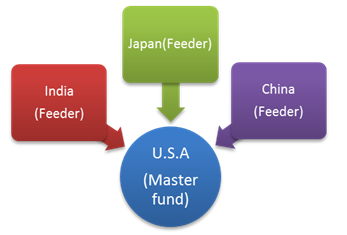
Master-Feeder Structure of International Mutual Funds
International Mutual Funds follow a master-feeder structure. A master-feeder structure is a three-tier structure where investors place their money in the feeder fund which then invests in the master fund. The master fund then invests the money in the market. A feeder fund is based on-shore i.e. in India, whereas, the master fund is based off-shore (in a foreign geography like Luxembourg etc).
A master fund can have multiple feeder funds. For example,
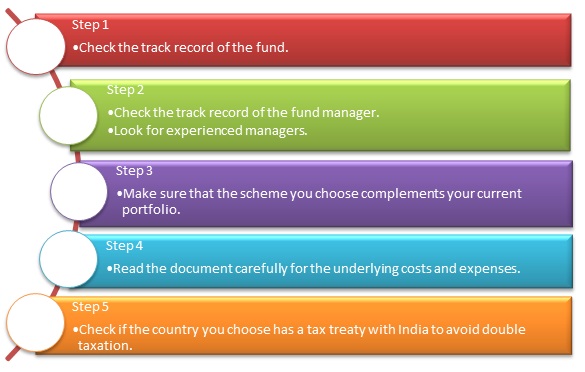
How to Pick an International Mutual Fund?
There are certain things to be kept in mind while choosing a suitable fund.
Fund Selection Methodology used to find 9 funds
Best International Mutual Funds to Invest in FY 26 - 27
Fund NAV Net Assets (Cr) Min SIP Investment 3 MO (%) 6 MO (%) 1 YR (%) 3 YR (%) 5 YR (%) 2025 (%) DSP World Mining Fund Growth ₹29.2793
↑ 0.18 ₹164 500 -12.3 -4.4 64.9 21 16 79 DSP World Gold Fund Growth ₹47.5904
↑ 0.09 ₹1,433 500 -25.1 -23.7 58.4 38.9 21.6 167.1 Edelweiss Emerging Markets Opportunities Equity Off-shore Fund Growth ₹27.5124
↑ 0.33 ₹259 1,000 6.3 22 57.2 24.8 9.6 41.1 DSP World Energy Fund Growth ₹29.0897
↑ 0.21 ₹117 500 2.5 18.2 47.1 16.1 13.5 39.2 Kotak Global Emerging Market Fund Growth ₹37.711
↓ -0.19 ₹1,767 1,000 3.8 14.1 45.9 23.3 10.3 39.1 DSP US Flexible Equity Fund Growth ₹92.7456
↑ 1.10 ₹1,291 500 8.6 18.1 45 26 18.3 33.8 Franklin Asian Equity Fund Growth ₹44.1318
↑ 0.72 ₹979 500 9.6 17.7 40.4 19.6 7.3 23.7 Nippon India Japan Equity Fund Growth ₹27.464
↑ 0.42 ₹332 100 7.6 16.8 38.7 19.1 10.3 19.8 Note: Returns up to 1 year are on absolute basis & more than 1 year are on CAGR basis. as on 20 Jul 26 Research Highlights & Commentary of 8 Funds showcased
Commentary DSP World Mining Fund DSP World Gold Fund Edelweiss Emerging Markets Opportunities Equity Off-shore Fund DSP World Energy Fund Kotak Global Emerging Market Fund DSP US Flexible Equity Fund Franklin Asian Equity Fund Nippon India Japan Equity Fund Point 1 Bottom quartile AUM (₹164 Cr). Top quartile AUM (₹1,433 Cr). Lower mid AUM (₹259 Cr). Bottom quartile AUM (₹117 Cr). Highest AUM (₹1,767 Cr). Upper mid AUM (₹1,291 Cr). Upper mid AUM (₹979 Cr). Lower mid AUM (₹332 Cr). Point 2 Established history (16+ yrs). Oldest track record among peers (18 yrs). Established history (12+ yrs). Established history (16+ yrs). Established history (18+ yrs). Established history (13+ yrs). Established history (18+ yrs). Established history (11+ yrs). Point 3 Rating: 3★ (upper mid). Rating: 3★ (lower mid). Rating: 3★ (lower mid). Rating: 2★ (bottom quartile). Rating: 3★ (bottom quartile). Top rated. Rating: 5★ (top quartile). Rating: 4★ (upper mid). Point 4 Risk profile: High. Risk profile: High. Risk profile: High. Risk profile: High. Risk profile: High. Risk profile: High. Risk profile: High. Risk profile: High. Point 5 5Y return: 16.01% (upper mid). 5Y return: 21.56% (top quartile). 5Y return: 9.58% (bottom quartile). 5Y return: 13.48% (upper mid). 5Y return: 10.25% (lower mid). 5Y return: 18.35% (top quartile). 5Y return: 7.33% (bottom quartile). 5Y return: 10.27% (lower mid). Point 6 3Y return: 21.04% (lower mid). 3Y return: 38.86% (top quartile). 3Y return: 24.75% (upper mid). 3Y return: 16.08% (bottom quartile). 3Y return: 23.30% (upper mid). 3Y return: 26.00% (top quartile). 3Y return: 19.56% (lower mid). 3Y return: 19.14% (bottom quartile). Point 7 1Y return: 64.91% (top quartile). 1Y return: 58.43% (top quartile). 1Y return: 57.19% (upper mid). 1Y return: 47.07% (upper mid). 1Y return: 45.91% (lower mid). 1Y return: 44.99% (lower mid). 1Y return: 40.41% (bottom quartile). 1Y return: 38.66% (bottom quartile). Point 8 Alpha: 0.00 (upper mid). Alpha: 2.12 (top quartile). Alpha: 6.30 (top quartile). Alpha: 0.00 (upper mid). Alpha: -1.76 (lower mid). Alpha: -4.10 (bottom quartile). Alpha: 0.00 (lower mid). Alpha: -4.53 (bottom quartile). Point 9 Sharpe: 1.74 (lower mid). Sharpe: 1.22 (bottom quartile). Sharpe: 2.20 (top quartile). Sharpe: 2.76 (top quartile). Sharpe: 1.88 (upper mid). Sharpe: 1.93 (upper mid). Sharpe: 1.54 (lower mid). Sharpe: 1.34 (bottom quartile). Point 10 Information ratio: 0.00 (top quartile). Information ratio: -0.50 (bottom quartile). Information ratio: -0.41 (lower mid). Information ratio: 0.00 (upper mid). Information ratio: -0.25 (lower mid). Information ratio: 0.15 (top quartile). Information ratio: 0.00 (upper mid). Information ratio: -1.06 (bottom quartile). DSP World Mining Fund
DSP World Gold Fund
Edelweiss Emerging Markets Opportunities Equity Off-shore Fund
DSP World Energy Fund
Kotak Global Emerging Market Fund
DSP US Flexible Equity Fund
Franklin Asian Equity Fund
Nippon India Japan Equity Fund
All the funds mentioned above are ideal, we are giving you detailed analysis of 4 funds.
The primary investment objective of the Scheme is to seek capital appreciation by investing predominantly in the units of BlackRock Global Funds – World Mining Fund. The Scheme may, at the discretion of the Investment Manager, also invest in the units of other similar overseas mutual fund schemes, which may
constitute a significant part of its corpus. The Scheme may also invest a certain portion of its corpus in money market securities and/or money market/liquid schemes of DSP BlackRock Mutual Fund, in order to meet liquidity requirements from time to time. Research Highlights for DSP World Mining Fund Below is the key information for DSP World Mining Fund Returns up to 1 year are on "The primary investment objective of the Scheme is to seek capital appreciation by investing predominantly in units of MLIIF - WGF. The Scheme may, at the discretion of the Investment Manager, also invest in the units of other similar overseas mutual fund schemes, which may constitute a significant part of its corpus. The Scheme may also invest a certain portion of its corpus in money market securities and/or units of money market/liquid schemes of DSP Merrill Lynch Mutual Fund, in order to meet liquidity requirements from time to time. However, there is no assurance that the investment objective of the Scheme will be realized." Research Highlights for DSP World Gold Fund Below is the key information for DSP World Gold Fund Returns up to 1 year are on The primary investment objective of the Scheme is to seek to provide long term capital growth by investing predominantly in the JPMorgan Funds - Emerging Markets Opportunities Fund, an equity fund which invests primarily in an aggressively managed portfolio of emerging market companies Research Highlights for Edelweiss Emerging Markets Opportunities Equity Off-shore Fund Below is the key information for Edelweiss Emerging Markets Opportunities Equity Off-shore Fund Returns up to 1 year are on The primary investment objective of the Scheme is to seek capital appreciation by investing predominantly in the units of BlackRock Global Funds – World Energy Fund and BlackRock Global Funds – New Energy Fund. The Scheme may, at the discretion of the Investment Manager, also invest in the units of other similar overseas mutual fund schemes, which may constitute a significant part of its corpus. The Scheme may also invest a certain portion of its corpus in money market securities
and/or money market/liquid schemes of DSP BlackRock Mutual Fund, in order to meet liquidity
requirements from time to time. Research Highlights for DSP World Energy Fund Below is the key information for DSP World Energy Fund Returns up to 1 year are on 1. DSP World Mining Fund
DSP World Mining Fund
Growth Launch Date 29 Dec 09 NAV (20 Jul 26) ₹29.2793 ↑ 0.18 (0.63 %) Net Assets (Cr) ₹164 on 30 Jun 26 Category Equity - Global AMC DSP BlackRock Invmt Managers Pvt. Ltd. Rating ☆☆☆ Risk High Expense Ratio 1.14 Sharpe Ratio 1.74 Information Ratio 0 Alpha Ratio 0 Min Investment 1,000 Min SIP Investment 500 Exit Load 0-12 Months (1%),12 Months and above(NIL) Growth of 10,000 investment over the years.
Date Value 30 Jun 21 ₹10,000 30 Jun 22 ₹9,282 30 Jun 23 ₹10,814 30 Jun 24 ₹11,032 30 Jun 25 ₹11,747 30 Jun 26 ₹20,331 Returns for DSP World Mining Fund
absolute basis & more than 1 year are on CAGR (Compound Annual Growth Rate) basis. as on 20 Jul 26 Duration Returns 1 Month -7.5% 3 Month -12.3% 6 Month -4.4% 1 Year 64.9% 3 Year 21% 5 Year 16% 10 Year 15 Year Since launch 6.7% Historical performance (Yearly) on absolute basis
Year Returns 2025 79% 2024 -8.1% 2023 0% 2022 12.2% 2021 18% 2020 34.9% 2019 21.5% 2018 -9.4% 2017 21.1% 2016 49.7% Fund Manager information for DSP World Mining Fund
Name Since Tenure Kaivalya Nadkarni 1 May 25 1.17 Yr. Data below for DSP World Mining Fund as on 30 Jun 26
Equity Sector Allocation
Sector Value Basic Materials 93.17% Energy 1.11% Asset Allocation
Asset Class Value Cash 5.71% Equity 94.28% Debt 0.01% Top Securities Holdings / Portfolio
Name Holding Value Quantity BGF World Mining I2
Investment Fund | -96% ₹180 Cr 141,035 Treps / Reverse Repo Investments
CBLO/Reverse Repo | -4% ₹7 Cr Net Receivables/Payables
Net Current Assets | -0% ₹0 Cr 2. DSP World Gold Fund
DSP World Gold Fund
Growth Launch Date 14 Sep 07 NAV (20 Jul 26) ₹47.5904 ↑ 0.09 (0.20 %) Net Assets (Cr) ₹1,433 on 30 Jun 26 Category Equity - Global AMC DSP BlackRock Invmt Managers Pvt. Ltd. Rating ☆☆☆ Risk High Expense Ratio 1.41 Sharpe Ratio 1.22 Information Ratio -0.5 Alpha Ratio 2.12 Min Investment 1,000 Min SIP Investment 500 Exit Load 0-12 Months (1%),12 Months and above(NIL) Growth of 10,000 investment over the years.
Date Value 30 Jun 21 ₹10,000 30 Jun 22 ₹8,181 30 Jun 23 ₹9,294 30 Jun 24 ₹10,640 30 Jun 25 ₹16,808 30 Jun 26 ₹27,693 Returns for DSP World Gold Fund
absolute basis & more than 1 year are on CAGR (Compound Annual Growth Rate) basis. as on 20 Jul 26 Duration Returns 1 Month -13.5% 3 Month -25.1% 6 Month -23.7% 1 Year 58.4% 3 Year 38.9% 5 Year 21.6% 10 Year 15 Year Since launch 8.6% Historical performance (Yearly) on absolute basis
Year Returns 2025 167.1% 2024 15.9% 2023 7% 2022 -7.7% 2021 -9% 2020 31.4% 2019 35.1% 2018 -10.7% 2017 -4% 2016 52.7% Fund Manager information for DSP World Gold Fund
Name Since Tenure Kaivalya Nadkarni 1 May 25 1.17 Yr. Data below for DSP World Gold Fund as on 30 Jun 26
Equity Sector Allocation
Sector Value Basic Materials 94.47% Asset Allocation
Asset Class Value Cash 3.62% Equity 94.47% Debt 0% Other 1.91% Top Securities Holdings / Portfolio
Name Holding Value Quantity BGF World Gold I2
Investment Fund | -68% ₹1,141 Cr 1,005,044 VanEck Gold Miners ETF
- | GDX29% ₹490 Cr 573,719 Treps / Reverse Repo Investments
CBLO/Reverse Repo | -3% ₹54 Cr Net Receivables/Payables
Net Current Assets | -0% -₹6 Cr 3. Edelweiss Emerging Markets Opportunities Equity Off-shore Fund
Edelweiss Emerging Markets Opportunities Equity Off-shore Fund
Growth Launch Date 7 Jul 14 NAV (20 Jul 26) ₹27.5124 ↑ 0.33 (1.22 %) Net Assets (Cr) ₹259 on 30 Jun 26 Category Equity - Global AMC Edelweiss Asset Management Limited Rating ☆☆☆ Risk High Expense Ratio 1.04 Sharpe Ratio 2.2 Information Ratio -0.41 Alpha Ratio 6.3 Min Investment 5,000 Min SIP Investment 1,000 Exit Load 0-1 Years (1%),1 Years and above(NIL) Growth of 10,000 investment over the years.
Date Value 30 Jun 21 ₹10,000 30 Jun 22 ₹7,234 30 Jun 23 ₹7,605 30 Jun 24 ₹8,447 30 Jun 25 ₹9,445 30 Jun 26 ₹15,783 Returns for Edelweiss Emerging Markets Opportunities Equity Off-shore Fund
absolute basis & more than 1 year are on CAGR (Compound Annual Growth Rate) basis. as on 20 Jul 26 Duration Returns 1 Month -6.5% 3 Month 6.3% 6 Month 22% 1 Year 57.2% 3 Year 24.8% 5 Year 9.6% 10 Year 15 Year Since launch 8.8% Historical performance (Yearly) on absolute basis
Year Returns 2025 41.1% 2024 5.9% 2023 5.5% 2022 -16.8% 2021 -5.9% 2020 21.7% 2019 25.1% 2018 -7.2% 2017 30% 2016 9.8% Fund Manager information for Edelweiss Emerging Markets Opportunities Equity Off-shore Fund
Name Since Tenure Bhavesh Jain 9 Apr 18 8.23 Yr. Bharat Lahoti 1 Oct 21 4.75 Yr. Data below for Edelweiss Emerging Markets Opportunities Equity Off-shore Fund as on 30 Jun 26
Equity Sector Allocation
Sector Value Technology 35.88% Financial Services 20.6% Consumer Cyclical 10.01% Communication Services 7.79% Industrials 5.82% Energy 5.13% Basic Materials 2.8% Consumer Defensive 1.98% Utility 1.27% Health Care 0.52% Asset Allocation
Asset Class Value Cash 6.04% Equity 93.14% Debt 0.01% Other 0.49% Top Securities Holdings / Portfolio
Name Holding Value Quantity JPM Emerging Mkts Opps I acc USD
Investment Fund | -96% ₹241 Cr 102,137
↑ 3,897 Clearing Corporation Of India Ltd.
CBLO/Reverse Repo | -4% ₹10 Cr Net Receivables/(Payables)
CBLO | -0% -₹1 Cr Accrued Interest
CBLO | -0% ₹0 Cr 4. DSP World Energy Fund
DSP World Energy Fund
Growth Launch Date 14 Aug 09 NAV (20 Jul 26) ₹29.0897 ↑ 0.21 (0.71 %) Net Assets (Cr) ₹117 on 30 Jun 26 Category Equity - Global AMC DSP BlackRock Invmt Managers Pvt. Ltd. Rating ☆☆ Risk High Expense Ratio 1.18 Sharpe Ratio 2.76 Information Ratio 0 Alpha Ratio 0 Min Investment 1,000 Min SIP Investment 500 Exit Load 0-12 Months (1%),12 Months and above(NIL) Growth of 10,000 investment over the years.
Date Value 30 Jun 21 ₹10,000 30 Jun 22 ₹8,249 30 Jun 23 ₹10,979 30 Jun 24 ₹10,687 30 Jun 25 ₹11,189 30 Jun 26 ₹18,095 Returns for DSP World Energy Fund
absolute basis & more than 1 year are on CAGR (Compound Annual Growth Rate) basis. as on 20 Jul 26 Duration Returns 1 Month -4.6% 3 Month 2.5% 6 Month 18.2% 1 Year 47.1% 3 Year 16.1% 5 Year 13.5% 10 Year 15 Year Since launch 6.5% Historical performance (Yearly) on absolute basis
Year Returns 2025 39.2% 2024 -6.8% 2023 12.9% 2022 -8.6% 2021 29.5% 2020 0% 2019 18.2% 2018 -11.3% 2017 -1.9% 2016 22.5% Fund Manager information for DSP World Energy Fund
Name Since Tenure Kaivalya Nadkarni 1 May 25 1.17 Yr. Data below for DSP World Energy Fund as on 30 Jun 26
Equity Sector Allocation
Sector Value Industrials 36.73% Utility 22.76% Technology 22.09% Basic Materials 9.94% Consumer Cyclical 0.71% Asset Allocation
Asset Class Value Cash 7.75% Equity 92.23% Debt 0.02% Top Securities Holdings / Portfolio
Name Holding Value Quantity BGF Sustainable Energy I2
Investment Fund | -97% ₹118 Cr 404,670 Treps / Reverse Repo Investments
CBLO/Reverse Repo | -3% ₹4 Cr Net Receivables/Payables
Net Current Assets | -0% ₹0 Cr
Types of International Mutual Funds
1. Emerging Market Funds
These invest in developing economies such as China, Brazil, South Korea, Taiwan and India. Emerging markets offer faster growth potential, young demographics and rising consumption — but also carry higher volatility and political risk. Examples: Franklin Asian Equity FoF, Kotak Global Emerging Market Fund.
Talk to our investment specialist
2. Developed Market Funds
These invest in stable economies like the US, Japan and Europe. Developed markets tend to be more resilient during global uncertainty and provide access to global leaders (Apple, Microsoft, Toyota, Nestlé, etc.). Examples: Motilal Oswal S&P 500 Index FoF, Nippon India Japan Equity Fund.
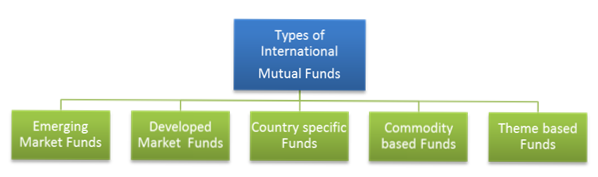
3. Country Specific Funds
Focused on one nation’s equity market. These are higher risk since all exposure is tied to a single economy, but can deliver strong returns if that market performs well. Examples: Kotak US Equity FoF, Mirae Asset China Advantage Fund.
4. Commodity Based Funds
Invest in commodities like gold, silver, energy or agriculture. They provide an inflation hedge and low correlation with equity. Examples: DSP World Gold Fund, Kotak Global Energy FoF.
5. Theme-Based Funds
Target a global theme — e.g., technology, healthcare, energy, real assets, or ESG. Broader than sector funds, thematic funds spread investments across multiple industries tied to the same theme. Examples: Edelweiss US Technology Equity FoF, L&T Global Real Assets Fund.
Why Invest Abroad? Main benefits
Geographic diversification — Over-concentration in any single economy raises risk; global fund spread it.
Access to global leaders & themes — Apple, Microsoft, Nvidia, Tesla, advanced semiconductor firms and global biotech companies are easier to access via international funds.
Currency hedge — If INR weakens vs USD, overseas investments gain in INR terms (on top of market returns).
Participation in long-term megatrends — AI, EVs, cloud, green energy and semiconductors have most depth outside India today.
Portfolio smoothing — Different economies and sectors often move out of sync, reducing portfolio volatility.
Key Risks to Keep in Mind
- Currency risk — A strengthening INR can erode returns in INR terms.
- Geopolitical & regulatory risk — Sanctions, trade wars or local rules can hit sectors or countries you’ve invested in.
- Higher costs — FoFs/feeder funds often carry two layers of fees (Indian AMC + overseas fund).
- SEBI / RBI caps & flow limits — At times, AMCs may pause new inflows if industry/AMC overseas headroom is full.
How Much of Your Portfolio Should Be International?
Common planner guidance for retail investors: 5–15% of total investible assets in international equities/FoFs. For more aggressive investors or HNIs who already have large domestic exposure, this can be higher. Keep the bulk in Indian equity + debt for local goals and stability. (This is a rule of thumb — adapt to risk appetite and Financial goals.)
How to Invest in International Mutual Fund Online?
Open Free Investment Account for Lifetime at Fincash.com.
Complete your Registration and KYC Process
Upload Documents (PAN, Aadhaar, etc.). And, You are Ready to Invest!
According to experts, an investor should have around 10-12% of the portfolio invested in international mutual funds. So with the basics covered now, start building up that portfolio with international mutual funds today.
Conclusion
International mutual funds are a convenient, regulated route for Indian investors to own global companies and themes. They provide diversification, access to non-Indian market leaders, and an effective currency hedge — but they come with tax, currency and theme-concentration risks. For most retail investors, a measured exposure (5–15%) combined with SIP discipline and a long-term view will work well.
FAQs
1. Are international mutual funds taxed like equity or debt?
A: Many international FoFs are treated as “specified mutual funds” under Section 50AA; units acquired on/after 1 April 2023 are typically taxed as short-term gains at slab rates. Check the AMC factsheet and AMFI guidance for specifics.
2. Can an Indian investor buy US ETFs directly?
A: Yes — via international brokers (Vested, INDmoney, Hatch) or by Investing in India-domiciled FoFs/ETFs that replicate US ETFs. Direct purchases are subject to LRS limits and additional compliance.
3. Which is better: NASDAQ FoF or S&P 500 FoF?
A: Nasdaq is tech-heavy (higher growth, higher volatility). S&P 500 is broader and less concentrated. Choose based on risk tolerance and time horizon.
4. Will SEBI/RBI restrict new international fund flows?
A: SEBI sets industry-level overseas headroom (historically adjustments in 2020/2021 and temporary pauses in 2022). AMCs may pause inflows if headroom is exhausted. Always check AMC notices.
All efforts have been made to ensure the information provided here is accurate. However, no guarantees are made regarding correctness of data. Please verify with scheme information document before making any investment.


AMFI Registration No. 112358 | CIN: U74999MH2016PTC282153
Shepard Technologies Pvt. Ltd. (with ARN code 112358) makes no warranties or representations, express or implied, on products offered through the platform. It accepts no liability for any damages or losses, however caused, in connection with the use of, or on the reliance of its product or related services. Terms and conditions of the website are applicable.
©2026 Shepard Technologies Private Limited. All Rights Reserved
Very good article I got all the required information.