How to Get ₹10 Crore Through Mutual Fund SIP
For many investors in India, building a corpus of ₹10 crore is considered a major financial milestone.

Whether your goal is Retirement planning, achieving financial freedom, creating a legacy for your family, or funding future aspirations, systematic Investing through Mutual Funds can help you reach this target over the long term.
One of the most effective ways to build wealth is through a SIP (Systematic Investment plan). SIPs allow investors to invest a fixed amount regularly, benefit from rupee cost averaging, and harness the Power of Compounding over time.
Equity Mutual Funds have historically delivered attractive long-term returns compared to many traditional investment options. While returns are never guaranteed, disciplined investing over a long period can significantly increase the probability of achieving large Financial goals.
Before calculating how much SIP is required to build ₹10 crore, it is important to understand that the actual amount depends on three key factors:
- Investment duration
- Expected rate of return
- Annual increase in investments (Step-Up SIP)
Let's see how much SIP may be required under different scenarios.
How Much SIP is Required to Build ₹10 Crore?
The table below illustrates the approximate monthly SIP required to accumulate ₹10 crore at different return assumptions.
| Investment Period | 10% Return | 12% Return | 14% Return |
|---|---|---|---|
| 10 Years | ₹4.96 Lakh | ₹4.46 Lakh | ₹3.80 Lakh |
| 15 Years | ₹2.48 Lakh | ₹2.10 Lakh | ₹1.76 Lakh |
| 20 Years | ₹1.38 Lakh | ₹1.08 Lakh | ₹85,218 |
| 25 Years | ₹80,441 | ₹58,748 | ₹42,651 |
| 30 Years | ₹48,094 | ₹32,458 | ₹21,741 |
As evident, time plays a crucial role in wealth creation. The longer you stay invested, the lower the monthly investment required to achieve the same financial goal.
The Power of Compounding
Compounding is often called the eighth wonder of the world. It allows your investment returns to generate further returns over time.
For example:
- Investor A starts investing for 30 years.
- Investor B starts investing for 15 years.
Even if Investor A invests significantly less every month, the power of compounding can help generate a similar or even larger corpus over the long term. This is why starting early is often more important than investing a larger amount later.
Is ₹10 Crore Enough in the Future?
Many investors set a target of ₹10 crore without considering inflation.
Inflation gradually reduces the purchasing power of money over time. A corpus that appears large today may not have the same value after 20 or 30 years.
The table below illustrates how inflation impacts the future value of money.
| Inflation Rate | Equivalent Future Requirement After 20 Years |
|---|---|
| 5% | ₹26.5 Crore |
| 6% | ₹32 Crore |
| 7% | ₹38.7 Crore |
This means that ₹10 crore after 20 years may provide purchasing power similar to only ₹3–4 crore today. Investors should therefore periodically review their financial goals and increase investments accordingly.
Talk to our investment specialist
How to Get 10 Crore in 20 Years
Start Investing Via Mutual Funds SIP of Rs. 76,000 Per Month
If you can spare Rs. 76,000 every month, start an SIP immediately in equity mutual funds. If you need help with selecting schemes, you can check our recommended equity mutual fund portfolios and pick a Portfolio based on your risk appetite and SIP amount.
If your mutual fund portfolio delivers an annualised return of 14%, a monthly SIP of ₹76,000 could potentially grow into a corpus of approximately ₹10 crore over 20 years. The illustration below is based on historical return assumptions and is intended for educational purposes only. Actual returns may vary depending on market conditions and fund performance.

Key Assumption based on historical returns are as below:
| Assumptions | Data |
|---|---|
| Growth Rate | 14% |
| Inflation | Not Included In Calculation* |
| Investment Amount (pm) | 76,000 |
| Time Period | 20 years |
| Amount Invested | 1,82,40,000 |
| Total Corpus | 10,00,42,317 |
| Net Gains | 8,18,02,317 |
*Note: Inflation has not been considered in the above illustration. The future purchasing power of ₹10 crore may be significantly lower after 20 years due to inflation. Investors should review their financial goals periodically and adjust SIP amounts accordingly.
More details can be worked our using our sip calculator by clicking on button below-
How to Get 10 Crore in 15 Years
Start Investing Via Mutual Funds SIP of Rs. 1,63,200 Per Month
If you can spare Rs 1,63,200 every month, start an SIP immediately in equity mutual funds. If you need help with selecting schemes, you can check our recommended equity mutual fund portfolios and pick a portfolio based on your risk appetite and SIP amount. If your portfolio of mutual funds manages to offer an annual return of 14 per cent (Which is lower than CAGR offered by BSE Sensex since inception in 1979), you would be able to create a corpus of Rs 10 crore in 15 years as show below.
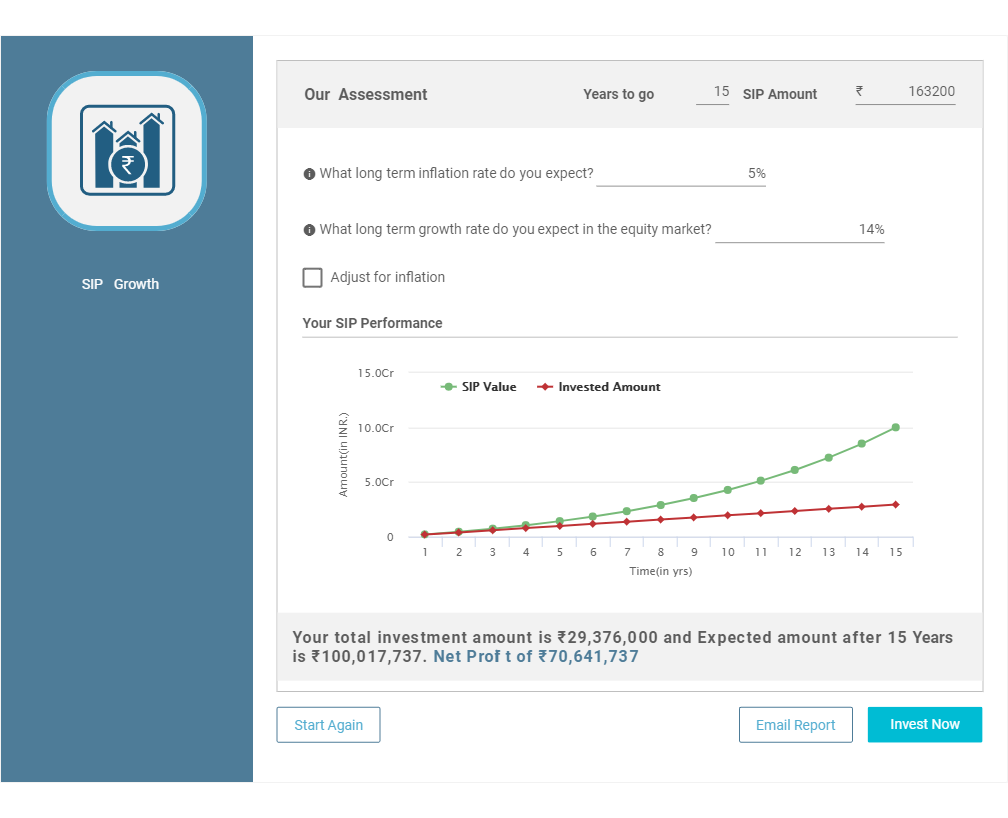
Key Assumption based on historical returns are as below-
| Assumptions | Data |
|---|---|
| Growth Rate | 14% |
| Inflation | Not Factored |
| Investment Amount (pm) | 1,63,200 |
| Time Period | 15 years |
| Amount Invested | 2,93,76,000 |
| Total Corpus | 10,00,17,737 |
| Net Gains | 7,06,41,737 |
More details can be worked our using our SIP calculator by clicking on button below-
How to Get 10 Crore in 10 Years
Start Investing Via Mutual Funds SIP of Rs. 3,81,600 Per Month
If you can spare Rs 3,81,600 every month, start an SIP immediately in equity mutual funds. If you need help with selecting schemes, you can check our recommended equity mutual fund portfolios and pick a portfolio based on your risk appetite and SIP amount. If your portfolio of mutual funds manages to offer an annual return of 14 per cent (Which is lower than CAGR offered by BSE SENSEX since inception in 1979), you would be able to create a corpus of Rs 10 crore in 10 years as show below.
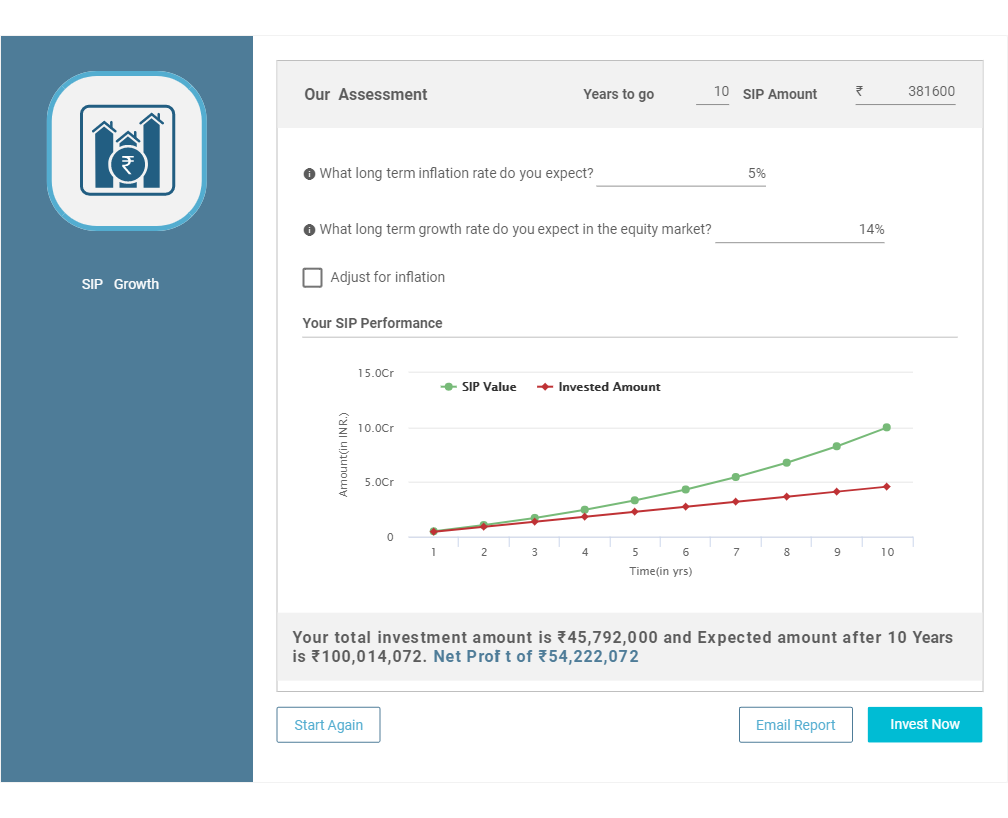
Key Assumption based on historical returns are as below-
| Assumptions | Data |
|---|---|
| Growth Rate | 14% |
| Inflation | Not Factored |
| Investment Amount (pm) | 3,81,600 |
| Time Period | 10 years |
| Amount Invested | 4,57,92,000 |
| Total Corpus | 10,00,14,072 |
| Net Gains | 5,42,22,072 |
More details can be worked our using our SIP calculator by clicking on button below-
Fund Selection Methodology used to find 10 funds
Can You Build ₹10 Crore Using a Step-Up SIP?
Many investors may find it difficult to invest ₹76,000 or more every month.
Fortunately, there is an alternative.
A Step-Up SIP allows investors to increase their SIP amount every year, usually in line with salary increments.
For example:
- Starting SIP: ₹20,000 per month
- Annual SIP Increase: 10%
- Investment Period: 30 Years
- Expected Return: 14%
In such a scenario, the final corpus can potentially exceed ₹10 crore.
A Step-Up SIP is often one of the most practical ways to achieve large financial goals without putting excessive pressure on current income.
Example of Building ₹10 Crore Through SIP
Consider the example of Rahul, aged 30.
- Monthly SIP: ₹25,000
- Annual SIP Increase: 10%
- Investment Period: 30 Years
- Expected Return: 14%
By the age of 60, Rahul's disciplined investing approach could potentially help him build a corpus exceeding ₹10 crore.
The example highlights an important lesson - Building wealth is not necessarily about investing huge amounts from day one. Consistency and patience often matter more than the initial investment size.
Should You Invest Only in Equity Mutual Funds?
For long-term goals exceeding 15 years, equity mutual funds are generally preferred because of their growth potential. However, investors should also consider diversification.
A balanced Asset Allocation may look like:
- 70–90% Equity Mutual Funds
- 10–30% Debt Mutual Funds
As investors approach their target date, gradually shifting a portion of the corpus towards debt funds may help reduce market Volatility and protect accumulated wealth.
Can ₹10 Crore Be Enough for Retirement?
A retirement corpus of ₹10 crore can potentially generate substantial income.
For example:
- Corpus: ₹10 Crore
- Withdrawal Rate: 4% per year
Annual Income = ₹40 Lakh Monthly Income = Approximately ₹3.3 Lakh
However, retirement requirements vary depending on:
- Lifestyle expectations
- Inflation
- Healthcare expenses
- Family responsibilities
- Retirement age
Therefore, investors should calculate their retirement corpus based on individual financial needs rather than relying on a generic target.
Fund Selection Methodology used to find 10 funds
Top 10 Performing Mutual Funds
*List of funds based on To generate capital appreciation and income distribution to unit holders by investing predominantly in equity/equity related securities of the companies belonging to the infrastructure development and balance in debt securities and money market instruments. Below is the key information for ICICI Prudential Infrastructure Fund Returns up to 1 year are on The objective of the scheme would be to provide investors with opportunities for long-term growth in capital along with the liquidity of an open-ended scheme through an active management of investments in a diversified basket of equity stocks of domestic Public Sector Undertakings and in debt and money market instruments issued by PSUs AND others. Research Highlights for SBI PSU Fund Below is the key information for SBI PSU Fund Returns up to 1 year are on The investment objective of the scheme is to provide long term growth from a portfolio of equity / equity related instruments of companies engaged either directly or indirectly in the infrastructure sector. Research Highlights for LIC MF Infrastructure Fund Below is the key information for LIC MF Infrastructure Fund Returns up to 1 year are on To generate capital appreciation, from a portfolio that is substantially constituted of equity securities and equity related securities of corporates, which could benefit from structural changes brought about by continuing liberalization in economic policies by the government and/or continuing investments in infrastructure, both by the public and private sector. Research Highlights for DSP India T.I.G.E.R Fund Below is the key information for DSP India T.I.G.E.R Fund Returns up to 1 year are on (Erstwhile Reliance Diversified Power Sector Fund) The primary investment objective of the scheme is to generate long term capital appreciation by investing predominantly in equity and equity related securities of companies in the power sector. Research Highlights for Nippon India Power and Infra Fund Below is the key information for Nippon India Power and Infra Fund Returns up to 1 year are on "The primary investment objective of the Scheme is to seek capital appreciation by investing predominantly in units of MLIIF - WGF. The Scheme may, at the discretion of the Investment Manager, also invest in the units of other similar overseas mutual fund schemes, which may constitute a significant part of its corpus. The Scheme may also invest a certain portion of its corpus in money market securities and/or units of money market/liquid schemes of DSP Merrill Lynch Mutual Fund, in order to meet liquidity requirements from time to time. However, there is no assurance that the investment objective of the Scheme will be realized." Research Highlights for DSP World Gold Fund Below is the key information for DSP World Gold Fund Returns up to 1 year are on To generate capital appreciation by investing in Equity and Equity Related Instruments of companies where the Central / State Government(s) has majority shareholding or management control or has powers to appoint majority of directors. However, there is no assurance or guarantee that the investment objective of the Scheme will be achieved. The Scheme does not assure or guarantee any returns. Research Highlights for Invesco India PSU Equity Fund Below is the key information for Invesco India PSU Equity Fund Returns up to 1 year are on The Scheme seeks to generate long term capital appreciation through a portfolio of predominantly equity and equity related securities of companies engaged in manufacturing and infrastructure and related sectors. Further, there can be no assurance that the investment objectives of the scheme will be realized. The Scheme is not providing any assured or guaranteed returns Research Highlights for BOI AXA Manufacturing and Infrastructure Fund Below is the key information for BOI AXA Manufacturing and Infrastructure Fund Returns up to 1 year are on T o g e n e r a t e income/capital appreciation by investing in equities and equity related instruments of companies in the infrastructure sector. However, there can be no assurance that the investment objective of the scheme will be realized. Research Highlights for Canara Robeco Infrastructure Below is the key information for Canara Robeco Infrastructure Returns up to 1 year are on The Scheme seeks to achieve capital appreciation by investing in companies engaged directly or indirectly in infrastructure related activities. Research Highlights for Franklin Build India Fund Below is the key information for Franklin Build India Fund Returns up to 1 year are on Assets>= 200 Crore & Sorted on 5 year CAGR Returns.
1. ICICI Prudential Infrastructure Fund
ICICI Prudential Infrastructure Fund
Growth Launch Date 31 Aug 05 NAV (22 Jul 26) ₹202.32 ↓ -2.57 (-1.25 %) Net Assets (Cr) ₹8,550 on 30 Jun 26 Category Equity - Sectoral AMC ICICI Prudential Asset Management Company Limited Rating ☆☆☆ Risk High Expense Ratio 1.89 Sharpe Ratio -0.07 Information Ratio 0 Alpha Ratio 0 Min Investment 5,000 Min SIP Investment 100 Exit Load 0-1 Years (1%),1 Years and above(NIL) Growth of 10,000 investment over the years.
Date Value 30 Jun 21 ₹10,000 30 Jun 22 ₹11,534 30 Jun 23 ₹16,346 30 Jun 24 ₹27,296 30 Jun 25 ₹28,743 30 Jun 26 ₹29,425 Returns for ICICI Prudential Infrastructure Fund
absolute basis & more than 1 year are on CAGR (Compound Annual Growth Rate) basis. as on 22 Jul 26 Duration Returns 1 Month -2.2% 3 Month -0.2% 6 Month 7% 1 Year 1.7% 3 Year 19.9% 5 Year 23.2% 10 Year 15 Year Since launch 15.5% Historical performance (Yearly) on absolute basis
Year Returns 2025 6.7% 2024 27.4% 2023 44.6% 2022 28.8% 2021 50.1% 2020 3.6% 2019 2.6% 2018 -14% 2017 40.8% 2016 2% Fund Manager information for ICICI Prudential Infrastructure Fund
Name Since Tenure Ihab Dalwai 3 Jun 17 9.08 Yr. Sharmila D’mello 30 Jun 22 4.01 Yr. Data below for ICICI Prudential Infrastructure Fund as on 30 Jun 26
Equity Sector Allocation
Sector Value Industrials 47.57% Financial Services 10.57% Utility 10.32% Basic Materials 9.74% Real Estate 8.09% Energy 5.04% Consumer Cyclical 1.98% Communication Services 0.09% Asset Allocation
Asset Class Value Cash 5.83% Equity 94.17% Top Securities Holdings / Portfolio
Name Holding Value Quantity InterGlobe Aviation Ltd (Industrials)
Equity, Since 28 Feb 23 | INDIGO9% ₹745 Cr 1,691,985
↑ 50,000 Larsen & Toubro Ltd (Industrials)
Equity, Since 30 Nov 09 | LT7% ₹614 Cr 1,505,704 Oberoi Realty Ltd (Real Estate)
Equity, Since 31 May 23 | OBEROIRLTY4% ₹365 Cr 2,139,426 Gujarat Energy Ltd (Utilities)
Equity, Since 31 Jan 23 | GUJGASLTD4% ₹340 Cr 8,482,024
↑ 156,557 NTPC Ltd (Utilities)
Equity, Since 29 Feb 16 | NTPC4% ₹334 Cr 8,626,448 Shree Cement Ltd (Basic Materials)
Equity, Since 30 Apr 24 | SHREECEM3% ₹270 Cr 106,892
↑ 3,387 Kalpataru Projects International Ltd (Industrials)
Equity, Since 30 Sep 06 | KPIL3% ₹262 Cr 2,005,608 AIA Engineering Ltd (Industrials)
Equity, Since 28 Feb 21 | AIAENG3% ₹258 Cr 572,697 HDFC Bank Ltd (Financial Services)
Equity, Since 31 Jan 22 | HDFCBANK3% ₹250 Cr 3,357,506
↑ 1,057,506 Container Corporation of India Ltd (Industrials)
Equity, Since 31 Jan 16 | CONCOR3% ₹227 Cr 4,885,153 2. SBI PSU Fund
SBI PSU Fund
Growth Launch Date 7 Jul 10 NAV (22 Jul 26) ₹34.4177 ↓ -0.17 (-0.50 %) Net Assets (Cr) ₹6,684 on 30 Jun 26 Category Equity - Sectoral AMC SBI Funds Management Private Limited Rating ☆☆ Risk High Expense Ratio 1.89 Sharpe Ratio 0.12 Information Ratio -0.11 Alpha Ratio -0.3 Min Investment 5,000 Min SIP Investment 500 Exit Load 0-1 Years (1%),1 Years and above(NIL) Growth of 10,000 investment over the years.
Date Value 30 Jun 21 ₹10,000 30 Jun 22 ₹9,973 30 Jun 23 ₹13,609 30 Jun 24 ₹26,792 30 Jun 25 ₹26,602 30 Jun 26 ₹28,255 Returns for SBI PSU Fund
absolute basis & more than 1 year are on CAGR (Compound Annual Growth Rate) basis. as on 22 Jul 26 Duration Returns 1 Month -3.3% 3 Month -6.1% 6 Month 1.3% 1 Year 6.9% 3 Year 24.1% 5 Year 23.1% 10 Year 15 Year Since launch 8% Historical performance (Yearly) on absolute basis
Year Returns 2025 11.3% 2024 23.5% 2023 54% 2022 29% 2021 32.4% 2020 -10% 2019 6% 2018 -23.8% 2017 21.9% 2016 16.2% Fund Manager information for SBI PSU Fund
Name Since Tenure Rohit Shimpi 1 Jun 24 2.08 Yr. Data below for SBI PSU Fund as on 30 Jun 26
Equity Sector Allocation
Sector Value Financial Services 32.54% Utility 31.22% Industrials 14.07% Energy 11.97% Basic Materials 6.94% Asset Allocation
Asset Class Value Cash 3.18% Equity 96.74% Debt 0.07% Top Securities Holdings / Portfolio
Name Holding Value Quantity State Bank of India (Financial Services)
Equity, Since 31 Jul 10 | SBIN17% ₹1,112 Cr 11,527,500
↑ 1,000,000 GAIL (India) Ltd (Utilities)
Equity, Since 31 May 24 | GAIL10% ₹628 Cr 38,150,000 NTPC Ltd (Utilities)
Equity, Since 31 Jul 10 | NTPC9% ₹597 Cr 15,443,244 Bharat Electronics Ltd (Industrials)
Equity, Since 30 Jun 24 | BEL9% ₹583 Cr 14,185,000
↑ 800,000 Power Grid Corp Of India Ltd (Utilities)
Equity, Since 31 Jul 10 | POWERGRID9% ₹579 Cr 19,935,554 Oil & Natural Gas Corp Ltd (Energy)
Equity, Since 31 May 20 | ONGC6% ₹389 Cr 14,655,000 Bank of Baroda (Financial Services)
Equity, Since 31 Aug 24 | BANKBARODA5% ₹352 Cr 13,100,000 Bharat Petroleum Corp Ltd (Energy)
Equity, Since 31 Aug 24 | BPCL4% ₹289 Cr 9,700,000 Bharat Heavy Electricals Ltd (Industrials)
Equity, Since 30 Jun 25 | BHEL4% ₹271 Cr 6,500,000 NMDC Ltd (Basic Materials)
Equity, Since 31 Oct 23 | NMDC4% ₹245 Cr 27,900,000 3. LIC MF Infrastructure Fund
LIC MF Infrastructure Fund
Growth Launch Date 29 Feb 08 NAV (22 Jul 26) ₹53.8358 ↓ -0.59 (-1.09 %) Net Assets (Cr) ₹1,137 on 30 Jun 26 Category Equity - Sectoral AMC LIC Mutual Fund Asset Mgmt Co Ltd Rating Risk High Expense Ratio 2.21 Sharpe Ratio 0.22 Information Ratio 0.58 Alpha Ratio 8.41 Min Investment 5,000 Min SIP Investment 1,000 Exit Load 0-1 Years (1%),1 Years and above(NIL) Growth of 10,000 investment over the years.
Date Value 30 Jun 21 ₹10,000 30 Jun 22 ₹11,137 30 Jun 23 ₹14,179 30 Jun 24 ₹26,268 30 Jun 25 ₹26,896 30 Jun 26 ₹29,151 Returns for LIC MF Infrastructure Fund
absolute basis & more than 1 year are on CAGR (Compound Annual Growth Rate) basis. as on 22 Jul 26 Duration Returns 1 Month -3.5% 3 Month 4.2% 6 Month 15.6% 1 Year 6.4% 3 Year 25.1% 5 Year 22.4% 10 Year 15 Year Since launch 9.6% Historical performance (Yearly) on absolute basis
Year Returns 2025 -3.7% 2024 47.8% 2023 44.4% 2022 7.9% 2021 46.6% 2020 -0.1% 2019 13.3% 2018 -14.6% 2017 42.2% 2016 -2.2% Fund Manager information for LIC MF Infrastructure Fund
Name Since Tenure Sumit Bhatnagar 7 Apr 26 0.23 Yr. Mahesh Bendre 1 Jul 24 2 Yr. Data below for LIC MF Infrastructure Fund as on 30 Jun 26
Equity Sector Allocation
Sector Value Industrials 37.05% Consumer Cyclical 20.88% Basic Materials 12.42% Utility 11.88% Communication Services 5.02% Financial Services 3.98% Real Estate 1.97% Health Care 1.89% Technology 1.08% Asset Allocation
Asset Class Value Cash 3.82% Equity 96.18% Top Securities Holdings / Portfolio
Name Holding Value Quantity Larsen & Toubro Ltd (Industrials)
Equity, Since 30 Apr 09 | LT4% ₹44 Cr 106,968
↓ -10,884 Garware Hi-Tech Films Ltd (Basic Materials)
Equity, Since 31 Aug 23 | 5006554% ₹40 Cr 65,325
↓ -7,684 Tata Motors Passenger Vehicles Ltd (Consumer Cyclical)
Equity, Since 28 Feb 26 | TMPV4% ₹39 Cr 982,891
↓ -332,760 Tata Motors Ltd (Consumer Cyclical)
Equity, Since 31 Oct 25 | TMCV4% ₹39 Cr 1,015,933
↑ 26,983 Tata Power Co Ltd (Utilities)
Equity, Since 29 Feb 24 | TATAPOWER3% ₹36 Cr 861,040
↑ 524,312 KSH International Ltd (Industrials)
Equity, Since 31 Dec 25 | KSHINTL3% ₹34 Cr 432,816
↑ 6,280 Siemens Energy India Ltd (Utilities)
Equity, Since 31 Aug 25 | ENRIN3% ₹34 Cr 87,106
↑ 24,800 JSW Infrastructure Ltd (Industrials)
Equity, Since 30 Apr 26 | JSWINFRA3% ₹31 Cr 1,133,858
↑ 745,681 Carraro India Ltd (Consumer Cyclical)
Equity, Since 31 Dec 24 | CARRARO3% ₹31 Cr 572,991 Bharat Dynamics Ltd Ordinary Shares (Industrials)
Equity, Since 31 Jan 26 | BDL3% ₹29 Cr 242,954
↑ 157,744 4. DSP India T.I.G.E.R Fund
DSP India T.I.G.E.R Fund
Growth Launch Date 11 Jun 04 NAV (22 Jul 26) ₹360.496 ↓ -2.11 (-0.58 %) Net Assets (Cr) ₹6,264 on 30 Jun 26 Category Equity - Sectoral AMC DSP BlackRock Invmt Managers Pvt. Ltd. Rating ☆☆☆☆ Risk High Expense Ratio 1.89 Sharpe Ratio 0.44 Information Ratio 0 Alpha Ratio 0 Min Investment 1,000 Min SIP Investment 500 Exit Load 0-12 Months (1%),12 Months and above(NIL) Growth of 10,000 investment over the years.
Date Value 30 Jun 21 ₹10,000 30 Jun 22 ₹10,551 30 Jun 23 ₹14,508 30 Jun 24 ₹25,980 30 Jun 25 ₹25,049 30 Jun 26 ₹28,384 Returns for DSP India T.I.G.E.R Fund
absolute basis & more than 1 year are on CAGR (Compound Annual Growth Rate) basis. as on 22 Jul 26 Duration Returns 1 Month -1.9% 3 Month 4.9% 6 Month 19.6% 1 Year 13.4% 3 Year 23% 5 Year 21.9% 10 Year 15 Year Since launch 17.6% Historical performance (Yearly) on absolute basis
Year Returns 2025 -2.5% 2024 32.4% 2023 49% 2022 13.9% 2021 51.6% 2020 2.7% 2019 6.7% 2018 -17.2% 2017 47% 2016 4.1% Fund Manager information for DSP India T.I.G.E.R Fund
Name Since Tenure Rohit Singhania 21 Jun 10 16.04 Yr. Data below for DSP India T.I.G.E.R Fund as on 30 Jun 26
Equity Sector Allocation
Sector Value Industrials 28.69% Basic Materials 13.29% Energy 9.47% Utility 9.46% Financial Services 8.49% Consumer Cyclical 6.52% Health Care 6.13% Communication Services 2.58% Technology 1.52% Real Estate 1.49% Consumer Defensive 0.71% Asset Allocation
Asset Class Value Cash 11.66% Equity 88.34% Top Securities Holdings / Portfolio
Name Holding Value Quantity Reliance Industries Ltd (Energy)
Equity, Since 31 Aug 19 | RELIANCE4% ₹262 Cr 1,983,815
↑ 1,304,235 NTPC Ltd (Utilities)
Equity, Since 30 Nov 17 | NTPC4% ₹249 Cr 6,433,748
↓ -94,844 Apollo Hospitals Enterprise Ltd (Healthcare)
Equity, Since 31 Dec 24 | APOLLOHOSP4% ₹247 Cr 301,630 Larsen & Toubro Ltd (Industrials)
Equity, Since 30 Jun 04 | LT4% ₹240 Cr 588,665 Kirloskar Oil Engines Ltd (Industrials)
Equity, Since 31 Mar 23 | 5332933% ₹161 Cr 834,973 Bharti Airtel Ltd (Communication Services)
Equity, Since 31 Oct 18 | BHARTIARTL3% ₹155 Cr 849,969 Coal India Ltd (Energy)
Equity, Since 31 Dec 23 | COALINDIA3% ₹154 Cr 3,352,298
↑ 647,118 INOX India Ltd (Industrials)
Equity, Since 31 Dec 23 | INOXINDIA2% ₹139 Cr 931,429
↓ -9,412 UltraTech Cement Ltd (Basic Materials)
Equity, Since 31 Dec 14 | ULTRACEMCO2% ₹135 Cr 118,010
↑ 51,464 Hindustan Aeronautics Ltd Ordinary Shares (Industrials)
Equity, Since 31 Oct 25 | HAL2% ₹131 Cr 305,098 5. Nippon India Power and Infra Fund
Nippon India Power and Infra Fund
Growth Launch Date 8 May 04 NAV (22 Jul 26) ₹379.336 ↓ -2.44 (-0.64 %) Net Assets (Cr) ₹8,043 on 30 Jun 26 Category Equity - Sectoral AMC Nippon Life Asset Management Ltd. Rating ☆☆☆☆ Risk High Expense Ratio 1.85 Sharpe Ratio 0.24 Information Ratio 0.56 Alpha Ratio 8.81 Min Investment 5,000 Min SIP Investment 100 Exit Load 0-1 Years (1%),1 Years and above(NIL) Growth of 10,000 investment over the years.
Date Value 30 Jun 21 ₹10,000 30 Jun 22 ₹10,223 30 Jun 23 ₹15,004 30 Jun 24 ₹27,370 30 Jun 25 ₹26,049 30 Jun 26 ₹28,381 Returns for Nippon India Power and Infra Fund
absolute basis & more than 1 year are on CAGR (Compound Annual Growth Rate) basis. as on 22 Jul 26 Duration Returns 1 Month -3.2% 3 Month 0.4% 6 Month 16.1% 1 Year 9.2% 3 Year 21.1% 5 Year 21.8% 10 Year 15 Year Since launch 17.8% Historical performance (Yearly) on absolute basis
Year Returns 2025 -0.5% 2024 26.9% 2023 58% 2022 10.9% 2021 48.9% 2020 10.8% 2019 -2.9% 2018 -21.1% 2017 61.7% 2016 0.1% Fund Manager information for Nippon India Power and Infra Fund
Name Since Tenure Kinjal Desai 25 May 18 8.11 Yr. Rahul Modi 19 Aug 24 1.87 Yr. Amber Singhania 11 Mar 26 0.31 Yr. Data below for Nippon India Power and Infra Fund as on 30 Jun 26
Equity Sector Allocation
Sector Value Industrials 34.92% Utility 22.36% Consumer Cyclical 11.45% Energy 9.18% Basic Materials 6.78% Technology 4.51% Financial Services 4.09% Communication Services 2.39% Real Estate 1.47% Health Care 1.24% Asset Allocation
Asset Class Value Cash 1.59% Equity 98.41% Top Securities Holdings / Portfolio
Name Holding Value Quantity Reliance Industries Ltd (Energy)
Equity, Since 30 Nov 18 | RELIANCE8% ₹616 Cr 4,660,000 Larsen & Toubro Ltd (Industrials)
Equity, Since 30 Nov 07 | LT7% ₹557 Cr 1,366,958
↑ 20,000 NTPC Ltd (Utilities)
Equity, Since 31 May 09 | NTPC6% ₹487 Cr 12,600,000
↓ -554,060 NTPC Green Energy Ltd (Utilities)
Equity, Since 30 Nov 24 | NTPCGREEN4% ₹296 Cr 28,594,584
↑ 2,403,505 Tata Power Co Ltd (Utilities)
Equity, Since 30 Apr 23 | TATAPOWER3% ₹246 Cr 5,850,789
↓ -100,000 Bharat Heavy Electricals Ltd (Industrials)
Equity, Since 30 Sep 24 | BHEL3% ₹242 Cr 5,800,000
↓ -1,148,468 Triveni Turbine Ltd (Industrials)
Equity, Since 30 Jun 25 | TRITURBINE3% ₹237 Cr 3,193,288
↑ 120,000 Power Finance Corp Ltd (Financial Services)
Equity, Since 31 Oct 24 | PFC3% ₹198 Cr 4,620,000
↑ 720,000 Bharti Airtel Ltd (Communication Services)
Equity, Since 30 Apr 18 | BHARTIARTL2% ₹188 Cr 1,030,000
↑ 180,000 CG Power & Industrial Solutions Ltd (Industrials)
Equity, Since 30 Sep 24 | CGPOWER2% ₹174 Cr 1,893,400
↓ -276,614 6. DSP World Gold Fund
DSP World Gold Fund
Growth Launch Date 14 Sep 07 NAV (21 Jul 26) ₹48.8587 ↑ 1.27 (2.67 %) Net Assets (Cr) ₹1,433 on 30 Jun 26 Category Equity - Global AMC DSP BlackRock Invmt Managers Pvt. Ltd. Rating ☆☆☆ Risk High Expense Ratio 1.41 Sharpe Ratio 1.22 Information Ratio -0.5 Alpha Ratio 2.12 Min Investment 1,000 Min SIP Investment 500 Exit Load 0-12 Months (1%),12 Months and above(NIL) Growth of 10,000 investment over the years.
Date Value 30 Jun 21 ₹10,000 30 Jun 22 ₹8,181 30 Jun 23 ₹9,294 30 Jun 24 ₹10,640 30 Jun 25 ₹16,808 30 Jun 26 ₹27,693 Returns for DSP World Gold Fund
absolute basis & more than 1 year are on CAGR (Compound Annual Growth Rate) basis. as on 22 Jul 26 Duration Returns 1 Month -13.5% 3 Month -25.1% 6 Month -23.7% 1 Year 58.4% 3 Year 38.9% 5 Year 21.6% 10 Year 15 Year Since launch 8.6% Historical performance (Yearly) on absolute basis
Year Returns 2025 167.1% 2024 15.9% 2023 7% 2022 -7.7% 2021 -9% 2020 31.4% 2019 35.1% 2018 -10.7% 2017 -4% 2016 52.7% Fund Manager information for DSP World Gold Fund
Name Since Tenure Kaivalya Nadkarni 1 May 25 1.17 Yr. Data below for DSP World Gold Fund as on 30 Jun 26
Equity Sector Allocation
Sector Value Basic Materials 94.47% Asset Allocation
Asset Class Value Cash 3.62% Equity 94.47% Debt 0% Other 1.91% Top Securities Holdings / Portfolio
Name Holding Value Quantity BGF World Gold I2
Investment Fund | -68% ₹1,141 Cr 1,005,044 VanEck Gold Miners ETF
- | GDX29% ₹490 Cr 573,719 Treps / Reverse Repo Investments
CBLO/Reverse Repo | -3% ₹54 Cr Net Receivables/Payables
Net Current Assets | -0% -₹6 Cr 7. Invesco India PSU Equity Fund
Invesco India PSU Equity Fund
Growth Launch Date 18 Nov 09 NAV (22 Jul 26) ₹64.28 ↓ -0.84 (-1.29 %) Net Assets (Cr) ₹1,473 on 30 Jun 26 Category Equity - Sectoral AMC Invesco Asset Management (India) Private Ltd Rating ☆☆☆ Risk High Expense Ratio 2.14 Sharpe Ratio -0.16 Information Ratio -0.57 Alpha Ratio -6.88 Min Investment 5,000 Min SIP Investment 500 Exit Load 0-1 Years (1%),1 Years and above(NIL) Growth of 10,000 investment over the years.
Date Value 30 Jun 21 ₹10,000 30 Jun 22 ₹9,722 30 Jun 23 ₹13,891 30 Jun 24 ₹27,099 30 Jun 25 ₹26,286 30 Jun 26 ₹26,262 Returns for Invesco India PSU Equity Fund
absolute basis & more than 1 year are on CAGR (Compound Annual Growth Rate) basis. as on 22 Jul 26 Duration Returns 1 Month -4.3% 3 Month -7% 6 Month -2.9% 1 Year 0% 3 Year 21% 5 Year 20.7% 10 Year 15 Year Since launch 11.8% Historical performance (Yearly) on absolute basis
Year Returns 2025 10.3% 2024 25.6% 2023 54.5% 2022 20.5% 2021 31.1% 2020 6.1% 2019 10.1% 2018 -16.9% 2017 24.3% 2016 17.9% Fund Manager information for Invesco India PSU Equity Fund
Name Since Tenure Hiten Jain 1 Jul 25 1 Yr. Sagar Gandhi 1 Jul 25 1 Yr. Data below for Invesco India PSU Equity Fund as on 30 Jun 26
Equity Sector Allocation
Sector Value Financial Services 30.26% Industrials 29.89% Utility 19.1% Energy 13.91% Basic Materials 3.59% Consumer Cyclical 1.59% Asset Allocation
Asset Class Value Cash 1.66% Equity 98.34% Top Securities Holdings / Portfolio
Name Holding Value Quantity State Bank of India (Financial Services)
Equity, Since 28 Feb 21 | SBIN9% ₹128 Cr 1,323,094
↑ 151,862 Hindustan Aeronautics Ltd Ordinary Shares (Industrials)
Equity, Since 31 May 22 | HAL8% ₹112 Cr 261,137 Indian Bank (Financial Services)
Equity, Since 30 Jun 21 | INDIANB8% ₹112 Cr 1,341,970
↑ 78,651 Bharat Petroleum Corp Ltd (Energy)
Equity, Since 30 Sep 18 | BPCL6% ₹92 Cr 3,076,024 Bharat Electronics Ltd (Industrials)
Equity, Since 31 Mar 17 | BEL6% ₹85 Cr 2,078,629 Dredging Corp of India Ltd (Industrials)
Equity, Since 31 Jul 25 | DREDGECORP5% ₹75 Cr 646,300 NTPC Green Energy Ltd (Utilities)
Equity, Since 30 Nov 24 | NTPCGREEN5% ₹71 Cr 6,852,914 Bank of Baroda (Financial Services)
Equity, Since 30 Jun 21 | BANKBARODA5% ₹70 Cr 2,611,219 NTPC Ltd (Utilities)
Equity, Since 31 May 19 | NTPC5% ₹70 Cr 1,801,543 REC Ltd (Financial Services)
Equity, Since 31 Aug 23 | RECLTD4% ₹58 Cr 1,703,577 8. BOI AXA Manufacturing and Infrastructure Fund
BOI AXA Manufacturing and Infrastructure Fund
Growth Launch Date 5 Mar 10 NAV (22 Jul 26) ₹66.7 ↓ -0.41 (-0.61 %) Net Assets (Cr) ₹837 on 30 Jun 26 Category Equity - Sectoral AMC BOI AXA Investment Mngrs Private Ltd Rating Risk High Expense Ratio 2.4 Sharpe Ratio 0.53 Information Ratio 0 Alpha Ratio 0 Min Investment 5,000 Min SIP Investment 1,000 Exit Load 0-1 Years (1%),1 Years and above(NIL) Growth of 10,000 investment over the years.
Date Value 30 Jun 21 ₹10,000 30 Jun 22 ₹10,067 30 Jun 23 ₹13,588 30 Jun 24 ₹22,409 30 Jun 25 ₹22,619 30 Jun 26 ₹25,882 Returns for BOI AXA Manufacturing and Infrastructure Fund
absolute basis & more than 1 year are on CAGR (Compound Annual Growth Rate) basis. as on 22 Jul 26 Duration Returns 1 Month 1.4% 3 Month 7.7% 6 Month 17.9% 1 Year 15.5% 3 Year 23.5% 5 Year 20.6% 10 Year 15 Year Since launch 12.3% Historical performance (Yearly) on absolute basis
Year Returns 2025 7.8% 2024 25.7% 2023 44.7% 2022 3.3% 2021 52.5% 2020 28.1% 2019 2.5% 2018 -22.8% 2017 56% 2016 1% Fund Manager information for BOI AXA Manufacturing and Infrastructure Fund
Name Since Tenure Nitin Gosar 27 Sep 22 3.76 Yr. Data below for BOI AXA Manufacturing and Infrastructure Fund as on 30 Jun 26
Equity Sector Allocation
Sector Value Industrials 24.81% Basic Materials 13.14% Consumer Cyclical 12.85% Health Care 11.87% Energy 10.92% Utility 6.13% Communication Services 4.02% Technology 3.57% Consumer Defensive 3.15% Real Estate 1.14% Asset Allocation
Asset Class Value Cash 6.24% Equity 93.66% Debt 0.1% Top Securities Holdings / Portfolio
Name Holding Value Quantity Larsen & Toubro Ltd (Industrials)
Equity, Since 31 Mar 10 | LT7% ₹52 Cr 127,443
↓ -23,672 NTPC Ltd (Utilities)
Equity, Since 31 May 21 | NTPC6% ₹48 Cr 1,250,367 Reliance Industries Ltd (Energy)
Equity, Since 31 Oct 20 | RELIANCE6% ₹47 Cr 356,510 Bharti Airtel Ltd (Communication Services)
Equity, Since 31 Dec 22 | BHARTIARTL4% ₹32 Cr 173,416 Dixon Technologies (India) Ltd (Technology)
Equity, Since 30 Apr 26 | DIXON4% ₹28 Cr 24,451
↑ 8,155 Aurobindo Pharma Ltd (Healthcare)
Equity, Since 31 May 25 | AUROPHARMA4% ₹28 Cr 196,331 Cemindia Projects Ltd (Industrials)
Equity, Since 31 Dec 22 | CEMPRO3% ₹26 Cr 243,152
↓ -65,994 Petronet LNG Ltd (Energy)
Equity, Since 31 Jan 26 | PETRONET3% ₹25 Cr 931,486
↑ 138,246 Stylam Industries Ltd (Consumer Cyclical)
Equity, Since 30 Apr 25 | 5269513% ₹24 Cr 83,372 Lloyds Metals & Energy Ltd (Basic Materials)
Equity, Since 30 Nov 24 | 5124553% ₹23 Cr 130,000
↓ -53,702 9. Canara Robeco Infrastructure
Canara Robeco Infrastructure
Growth Launch Date 2 Dec 05 NAV (22 Jul 26) ₹168.06 ↓ -1.53 (-0.90 %) Net Assets (Cr) ₹998 on 30 Jun 26 Category Equity - Sectoral AMC Canara Robeco Asset Management Co. Ltd. Rating Risk High Expense Ratio 2.32 Sharpe Ratio 0.02 Information Ratio 0 Alpha Ratio 0 Min Investment 5,000 Min SIP Investment 1,000 Exit Load 0-1 Years (1%),1 Years and above(NIL) Growth of 10,000 investment over the years.
Date Value 30 Jun 21 ₹10,000 30 Jun 22 ₹10,964 30 Jun 23 ₹14,661 30 Jun 24 ₹25,325 30 Jun 25 ₹25,500 30 Jun 26 ₹26,666 Returns for Canara Robeco Infrastructure
absolute basis & more than 1 year are on CAGR (Compound Annual Growth Rate) basis. as on 22 Jul 26 Duration Returns 1 Month -3.7% 3 Month -2.4% 6 Month 11% 1 Year 3.7% 3 Year 20.6% 5 Year 20% 10 Year 15 Year Since launch 14.7% Historical performance (Yearly) on absolute basis
Year Returns 2025 0.1% 2024 35.3% 2023 41.2% 2022 9% 2021 56.1% 2020 9% 2019 2.3% 2018 -19.1% 2017 40.2% 2016 2.1% Fund Manager information for Canara Robeco Infrastructure
Name Since Tenure Vishal Mishra 26 Jun 21 5.01 Yr. Shridatta Bhandwaldar 29 Sep 18 7.76 Yr. Data below for Canara Robeco Infrastructure as on 30 Jun 26
Equity Sector Allocation
Sector Value Industrials 46.53% Utility 12.52% Basic Materials 11.01% Energy 7.46% Financial Services 6.8% Communication Services 3.99% Technology 3.66% Consumer Cyclical 2.25% Real Estate 0.9% Asset Allocation
Asset Class Value Cash 4.86% Equity 95.14% Top Securities Holdings / Portfolio
Name Holding Value Quantity Larsen & Toubro Ltd (Industrials)
Equity, Since 28 Feb 11 | LT10% ₹99 Cr 242,151
↑ 9,250 Reliance Industries Ltd (Energy)
Equity, Since 30 Apr 22 | RELIANCE5% ₹49 Cr 373,750
↑ 60,000 CG Power & Industrial Solutions Ltd (Industrials)
Equity, Since 31 Oct 23 | CGPOWER5% ₹48 Cr 525,650 NTPC Ltd (Utilities)
Equity, Since 30 Nov 18 | NTPC4% ₹41 Cr 1,066,480 Bharti Airtel Ltd (Communication Services)
Equity, Since 31 May 24 | BHARTIARTL4% ₹40 Cr 216,600
↑ 55,000 State Bank of India (Financial Services)
Equity, Since 31 Jul 24 | SBIN4% ₹39 Cr 406,500
↑ 20,000 Bharat Electronics Ltd (Industrials)
Equity, Since 31 Jul 19 | BEL4% ₹38 Cr 929,000
↑ 60,000 Tata Power Co Ltd (Utilities)
Equity, Since 30 Sep 24 | TATAPOWER4% ₹37 Cr 870,000 Cummins India Ltd (Industrials)
Equity, Since 31 Jul 24 | CUMMINSIND3% ₹33 Cr 56,000
↓ -2,500 InterGlobe Aviation Ltd (Industrials)
Equity, Since 31 Jan 23 | INDIGO3% ₹31 Cr 70,000
↑ 6,000 10. Franklin Build India Fund
Franklin Build India Fund
Growth Launch Date 4 Sep 09 NAV (22 Jul 26) ₹143.968 ↓ -1.48 (-1.02 %) Net Assets (Cr) ₹3,256 on 30 Jun 26 Category Equity - Sectoral AMC Franklin Templeton Asst Mgmt(IND)Pvt Ltd Rating ☆☆☆☆☆ Risk High Expense Ratio 2.01 Sharpe Ratio -0.04 Information Ratio 0 Alpha Ratio 0 Min Investment 5,000 Min SIP Investment 500 Exit Load 0-1 Years (1%),1 Years and above(NIL) Growth of 10,000 investment over the years.
Date Value 30 Jun 21 ₹10,000 30 Jun 22 ₹10,442 30 Jun 23 ₹14,260 30 Jun 24 ₹25,315 30 Jun 25 ₹25,295 30 Jun 26 ₹26,100 Returns for Franklin Build India Fund
absolute basis & more than 1 year are on CAGR (Compound Annual Growth Rate) basis. as on 22 Jul 26 Duration Returns 1 Month -4.1% 3 Month -3.3% 6 Month 4.3% 1 Year 0.4% 3 Year 19.5% 5 Year 19.6% 10 Year 15 Year Since launch 17.1% Historical performance (Yearly) on absolute basis
Year Returns 2025 3.7% 2024 27.8% 2023 51.1% 2022 11.2% 2021 45.9% 2020 5.4% 2019 6% 2018 -10.7% 2017 43.3% 2016 8.4% Fund Manager information for Franklin Build India Fund
Name Since Tenure Ajay Argal 18 Oct 21 4.7 Yr. Kiran Sebastian 7 Feb 22 4.4 Yr. Sandeep Manam 18 Oct 21 4.7 Yr. Data below for Franklin Build India Fund as on 30 Jun 26
Equity Sector Allocation
Sector Value Industrials 35.44% Utility 17.21% Financial Services 13.43% Energy 12.44% Basic Materials 6.69% Communication Services 5.26% Real Estate 2.46% Consumer Cyclical 1.21% Technology 1.09% Asset Allocation
Asset Class Value Cash 4.79% Equity 95.21% Top Securities Holdings / Portfolio
Name Holding Value Quantity Larsen & Toubro Ltd (Industrials)
Equity, Since 29 Feb 20 | LT9% ₹296 Cr 725,000
↑ 125,000 InterGlobe Aviation Ltd (Industrials)
Equity, Since 29 Feb 20 | INDIGO6% ₹185 Cr 420,000 Oil & Natural Gas Corp Ltd (Energy)
Equity, Since 30 Jun 19 | ONGC6% ₹181 Cr 6,825,000 NTPC Ltd (Utilities)
Equity, Since 30 Nov 16 | NTPC6% ₹178 Cr 4,600,000 Reliance Industries Ltd (Energy)
Equity, Since 31 Oct 21 | RELIANCE5% ₹172 Cr 1,300,000 Tata Power Co Ltd (Utilities)
Equity, Since 31 Jan 25 | TATAPOWER4% ₹130 Cr 3,100,000
↑ 900,000 Bharti Airtel Ltd (Communication Services)
Equity, Since 30 Sep 09 | BHARTIARTL4% ₹130 Cr 710,000 Axis Bank Ltd (Financial Services)
Equity, Since 31 Mar 12 | AXISBANK4% ₹129 Cr 1,000,000 Power Grid Corp Of India Ltd (Utilities)
Equity, Since 28 Feb 21 | POWERGRID4% ₹126 Cr 4,350,000 HDFC Bank Ltd (Financial Services)
Equity, Since 31 Oct 25 | HDFCBANK4% ₹121 Cr 1,625,000
Important Things to Remember Before Investing
Before starting a SIP for a ₹10 crore goal, keep the following points in mind:
- Invest according to your risk profile.
- Stay invested during market volatility.
- Review your portfolio annually.
- Increase SIP contributions whenever income rises.
- Avoid stopping SIPs during temporary market corrections.
- Maintain an emergency fund separately.
- Diversify investments across suitable mutual fund categories.
Mutual fund investments are subject to market risks. Historical returns do not guarantee future performance. Actual returns may be higher or lower than assumptions used in the illustrations above.
How to Invest in Mutual Fund SIP Online?
Open Free Investment Account for Lifetime at Fincash.com.
Complete your Registration and KYC Process
Upload Documents (PAN, Aadhaar, etc.). And, You are Ready to Invest!
Frequently Asked Questions (FAQs)
1. How much SIP is needed for ₹10 crore?
A: The SIP amount depends on investment duration and expected returns. At an assumed annual return of 14%, approximately ₹76,000 per month may be required over 20 years.
2. Can I build ₹10 crore with a ₹10,000 SIP?
A: Yes. However, achieving ₹10 crore with a ₹10,000 SIP would generally require a much longer investment horizon, higher returns, or periodic increases through a Step-Up SIP.
3. Is ₹10 crore enough to retire in India?
A: It depends on lifestyle, inflation, healthcare costs, and retirement age. For some investors, ₹10 crore may be sufficient, while others may require a larger retirement corpus.
4. Which mutual funds are suitable for building ₹10 crore?
A: Long-term investors generally consider diversified equity mutual funds, flexi-cap funds, Index Funds, and large & mid cap funds based on their risk appetite and financial goals.
5. What if mutual fund returns are lower than expected?
A: If actual returns are lower than expected, investors may need to increase their SIP amount, extend the investment period, or use a Step-Up SIP strategy to reach their target corpus.
5. Should I increase my SIP every year?
A: Yes. Increasing SIP contributions in line with salary growth can significantly improve wealth creation and help achieve financial goals faster.
All efforts have been made to ensure the information provided here is accurate. However, no guarantees are made regarding correctness of data. Please verify with scheme information document before making any investment.


")


AMFI Registration No. 112358 | CIN: U74999MH2016PTC282153
Shepard Technologies Pvt. Ltd. (with ARN code 112358) makes no warranties or representations, express or implied, on products offered through the platform. It accepts no liability for any damages or losses, however caused, in connection with the use of, or on the reliance of its product or related services. Terms and conditions of the website are applicable.
©2026 Shepard Technologies Private Limited. All Rights Reserved
Research Highlights for ICICI Prudential Infrastructure Fund