8 Best Balanced Advantage Mutual Funds 2026
Imagine driving on an Indian highway. Some days the road is smooth and you speed up, other times traffic slows you down and you need to brake. A good driver knows when to press the accelerator and when to ease off.
Investing works the same way. Markets go through bull runs, sudden crashes, and uncertain stretches. If you keep full throttle on equities, the ride can get bumpy. If you stick only to debt, you may never reach your destination fast enough.

This is where Balanced Advantage Funds (BAFs) step in. They act like a skilled driver, shifting gears between equity and debt depending on the market’s condition. In 2026, with global markets swinging, inflation still playing its part, and India’s growth story continuing, these funds have become a popular choice for investors seeking both growth and stability.
In this article, we’ll explore the best Balanced Advantage Funds in India for 2026, understand how they work, compare them with other hybrid categories, and see whether they deserve a place in your Portfolio.
What is Balanced Advantage Mutual Funds ?
Definition: Schemes under SEBI’s “Dynamic Asset Allocation” / Balanced Advantage category; they dynamically manage equity vs. debt exposure depending on market conditions.
Key feature: No fixed minimum equity exposure (unlike Balanced / Aggressive Hybrid or Balanced Hybrid funds). Equity may vary typically between ~30%-80%.
Why “advantage”: Seeks to reduce downside in volatile markets while capturing upside when equity markets are favorable.
Why Balanced Advantage Mutual Funds ?
Over the years, investor behaviour has increasingly favoured hybrid and dynamic asset allocation categories like Balanced Advantage Funds. As per AMFI’s July monthly note, Hybrid Fund assets rose to ₹10.03 lakh crore, supported by net inflows of ~₹20,879 crore, of which nearly ₹2,364 crore flowed specifically into balanced/aggressive hybrid funds.
Meanwhile, equity Mutual Funds also saw sustained enthusiasm: in July 2025, they attracted a record ₹42,702 crore—marking one of the highest single-month inflows. Despite global headwinds, investors continue to stay committed via SIPs, which crossed ₹28,000 crore in monthly contributions, showing both confidence in long-term investing and preference for funds that can balance risk and opportunity.
Balanced Advantage Mutual Funds aim to solve this dilemma. Here’s why they stand out:
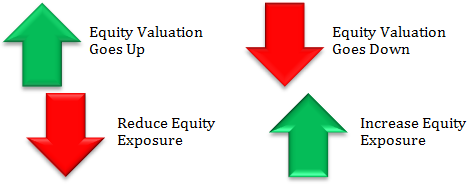
Dynamic risk management – These funds automatically adjust the balance between equity and debt depending on market valuations. When equity valuations look stretched, the fund reduces exposure and shifts towards debt.
Reduced Volatility – By capping equity exposure during overheated markets, they cushion investors against sharp drawdowns.
Tax efficiency – Most BAFs maintain effective equity exposure of 65% or more, allowing them to qualify for equity taxation benefits (10% LTCG after ₹1 lakh per year).
Accessibility for retail investors – You don’t need to time the market yourself; professional fund managers take those calls.
Suitable for medium-term goals – Ideal for investors with a 3–5 year horizon who want growth but can’t afford high volatility.
In short, Balanced Advantage Mutual Funds are designed for Indian investors who want a smoother investment journey without compromising too much on returns.
Talk to our investment specialist
Fund Selection Methodology Used to Find 8 Funds
8 Best Balanced Advantage Mutual Funds for Investments in India 2026 - 2027
Fund NAV Net Assets (Cr) 3 MO (%) 6 MO (%) 1 YR (%) 3 YR (%) 5 YR (%) 2024 (%) Aditya Birla Sun Life Balanced Advantage Fund Growth ₹112.91
↑ 0.32 ₹9,490 2.4 4.9 5.3 11.3 10 10.1 Nippon India Balanced Advantage Fund Growth ₹183.382
↑ 0.02 ₹9,796 1.3 3.7 3.5 10.5 9.4 7.3 Invesco India Dynamic Equity Fund Growth ₹52.45
↓ -0.09 ₹996 0.1 -1.9 -2.8 8.4 8.1 2.7 DSP Dynamic Asset Allocation Fund Growth ₹28.785
↓ -0.01 ₹3,749 1 2.4 4.1 10.2 8.2 8.7 SBI Dynamic Asset Allocation Fund Growth ₹15.9463
↑ 0.03 ₹655 3.9 6.2 25.1 6.9 8.3 Franklin India Multi - Asset Solution Fund Growth ₹22.2675
↑ 0.00 ₹137 1.5 3.1 5.6 12.3 10.8 14.1 BOI AXA Equity Debt Rebalancer Fund Growth ₹26.1639
↓ 0.00 ₹170 -0.7 3.1 5 8.7 10.2 8.5 Bandhan Dynamic Equity Fund Growth ₹25.241
↓ -0.01 ₹2,236 2.2 3.2 3.7 9.1 7.9 5.1 Note: Returns up to 1 year are on absolute basis & more than 1 year are on CAGR basis. as on 21 Jul 26 Research Highlights & Commentary of 8 Funds showcased
Commentary Aditya Birla Sun Life Balanced Advantage Fund Nippon India Balanced Advantage Fund Invesco India Dynamic Equity Fund DSP Dynamic Asset Allocation Fund SBI Dynamic Asset Allocation Fund Franklin India Multi - Asset Solution Fund BOI AXA Equity Debt Rebalancer Fund Bandhan Dynamic Equity Fund Point 1 Top quartile AUM (₹9,490 Cr). Highest AUM (₹9,796 Cr). Lower mid AUM (₹996 Cr). Upper mid AUM (₹3,749 Cr). Lower mid AUM (₹655 Cr). Bottom quartile AUM (₹137 Cr). Bottom quartile AUM (₹170 Cr). Upper mid AUM (₹2,236 Cr). Point 2 Oldest track record among peers (26 yrs). Established history (21+ yrs). Established history (18+ yrs). Established history (12+ yrs). Established history (11+ yrs). Established history (11+ yrs). Established history (12+ yrs). Established history (11+ yrs). Point 3 Top rated. Rating: 3★ (top quartile). Rating: 2★ (upper mid). Rating: 1★ (upper mid). Not Rated. Not Rated. Not Rated. Not Rated. Point 4 Risk profile: Moderately High. Risk profile: Moderately High. Risk profile: Moderately High. Risk profile: Moderate. Risk profile: Moderately High. Risk profile: Moderately High. Risk profile: Moderately High. Risk profile: Moderately High. Point 5 5Y return: 9.98% (upper mid). 5Y return: 9.42% (upper mid). 5Y return: 8.10% (bottom quartile). 5Y return: 8.23% (lower mid). 5Y return: 8.31% (lower mid). 5Y return: 10.76% (top quartile). 5Y return: 10.20% (top quartile). 5Y return: 7.90% (bottom quartile). Point 6 3Y return: 11.31% (top quartile). 3Y return: 10.45% (upper mid). 3Y return: 8.43% (bottom quartile). 3Y return: 10.22% (upper mid). 3Y return: 6.92% (bottom quartile). 3Y return: 12.34% (top quartile). 3Y return: 8.73% (lower mid). 3Y return: 9.14% (lower mid). Point 7 1Y return: 5.27% (upper mid). 1Y return: 3.49% (bottom quartile). 1Y return: -2.83% (bottom quartile). 1Y return: 4.12% (lower mid). 1Y return: 25.12% (top quartile). 1Y return: 5.64% (top quartile). 1Y return: 5.03% (upper mid). 1Y return: 3.68% (lower mid). Point 8 1M return: 2.11% (top quartile). 1M return: 1.28% (upper mid). 1M return: 0.44% (bottom quartile). 1M return: 0.78% (lower mid). 1M return: 1.04% (upper mid). 1M return: 0.68% (lower mid). 1M return: 0.65% (bottom quartile). 1M return: 1.28% (top quartile). Point 9 Alpha: 0.00 (top quartile). Alpha: 0.00 (top quartile). Alpha: 0.00 (upper mid). Alpha: 0.00 (upper mid). Alpha: 0.00 (lower mid). Alpha: 0.00 (lower mid). Alpha: 0.00 (bottom quartile). Alpha: 0.00 (bottom quartile). Point 10 Sharpe: -0.22 (upper mid). Sharpe: -0.27 (bottom quartile). Sharpe: -0.97 (bottom quartile). Sharpe: -0.20 (top quartile). Sharpe: 2.59 (top quartile). Sharpe: -0.21 (upper mid). Sharpe: -0.25 (lower mid). Sharpe: -0.23 (lower mid). Aditya Birla Sun Life Balanced Advantage Fund
Nippon India Balanced Advantage Fund
Invesco India Dynamic Equity Fund
DSP Dynamic Asset Allocation Fund
SBI Dynamic Asset Allocation Fund
Franklin India Multi - Asset Solution Fund
BOI AXA Equity Debt Rebalancer Fund
Bandhan Dynamic Equity Fund
All the funds mentioned above are ideal, we are giving you detailed analysis of 5 funds.
The primary objective of the Scheme is to generate long term growth of capital and income distribution with relatively lower volatility by investing in a dynamically balanced portfolio of Equity & Equity linked investments and fixed-income securities. Research Highlights for Aditya Birla Sun Life Balanced Advantage Fund Below is the key information for Aditya Birla Sun Life Balanced Advantage Fund Returns up to 1 year are on (Erstwhile Reliance NRI Equity Fund) The investment objective of the Scheme is to generate optimal returns by investing in equity or equity related instruments primarily drawn from the Companies in the S&P BSE 200 Index. The Scheme may also invest in listed
companies that are in the top 200 by market capitalization on the BSE. The Scheme may also invest in large IPO’s where the market capitalization of the Company making the IPO based on the Issue price would make such company to be a part of the top 200 companies listed on the BSE based on market capitalization. The fund will have the flexibility to invest in a broad range of companies with an objective to maximize the returns, at the same time trying to minimize the risk by reasonable diversification. The selection of the companies will be done so as to capture the growth in the Indian economy. The fund will be focusing on companies with relatively higher market capitalization and having good liquidity in the stock market. Research Highlights for Nippon India Balanced Advantage Fund Below is the key information for Nippon India Balanced Advantage Fund Returns up to 1 year are on The investment objective of the Scheme is to generate long-term capital growth from a focused portfolio of predominantly equity and equity-related securities. Research Highlights for Invesco India Dynamic Equity Fund Below is the key information for Invesco India Dynamic Equity Fund Returns up to 1 year are on The investment objective of the Scheme is to seek capital appreciation by managing the asset allocation between specified equity mutual fund schemes and debt mutual fund schemes of DSP BlackRock Mutual Fund. The Scheme will dynamically manage the asset allocation between the specified equity mutual funds schemes and debt mutual funds schemes of DSP BlackRock Mutual Fund based on the relative valuation of equity and debt markets. The Scheme may also invest a certain portion of its corpus in money market securities and/ or money market/liquid schemes of DSP BlackRock Mutual Fund, in order to meet liquidity requirements from time to time. Research Highlights for DSP Dynamic Asset Allocation Fund Below is the key information for DSP Dynamic Asset Allocation Fund Returns up to 1 year are on The objective of the fund will be to provide investors with an opportunity to invest in a portfolio of a mix of equity and equity related securities and fixed income instruments. The allocation between fixed income and equity instruments will be managed dynamically so as to provide investors with long term capital appreciation However, there can be no assurance that the investment objective of the Scheme will be achieved. Research Highlights for SBI Dynamic Asset Allocation Fund Below is the key information for SBI Dynamic Asset Allocation Fund Returns up to 1 year are on 1. Aditya Birla Sun Life Balanced Advantage Fund
Aditya Birla Sun Life Balanced Advantage Fund
Growth Launch Date 25 Apr 00 NAV (21 Jul 26) ₹112.91 ↑ 0.32 (0.28 %) Net Assets (Cr) ₹9,490 on 30 Jun 26 Category Hybrid - Dynamic Allocation AMC Birla Sun Life Asset Management Co Ltd Rating ☆☆☆ Risk Moderately High Expense Ratio 1.79 Sharpe Ratio -0.22 Information Ratio 0 Alpha Ratio 0 Min Investment 1,000 Min SIP Investment 100 Exit Load 0-365 Days (1%),365 Days and above(NIL) Growth of 10,000 investment over the years.
Date Value 30 Jun 21 ₹10,000 30 Jun 22 ₹9,981 30 Jun 23 ₹11,583 30 Jun 24 ₹14,083 30 Jun 25 ₹15,446 30 Jun 26 ₹15,887 Returns for Aditya Birla Sun Life Balanced Advantage Fund
absolute basis & more than 1 year are on CAGR (Compound Annual Growth Rate) basis. as on 21 Jul 26 Duration Returns 1 Month 2.1% 3 Month 2.4% 6 Month 4.9% 1 Year 5.3% 3 Year 11.3% 5 Year 10% 10 Year 15 Year Since launch Historical performance (Yearly) on absolute basis
Year Returns 2024 10.1% 2023 13% 2022 16.5% 2021 4.2% 2020 13.4% 2019 15.4% 2018 8.1% 2017 0.7% 2016 15.2% 2015 16.3% Fund Manager information for Aditya Birla Sun Life Balanced Advantage Fund
Name Since Tenure Harish Krishnan 31 Oct 24 1.66 Yr. Lovelish Solanki 9 Oct 19 6.73 Yr. Mohit Sharma 1 Apr 17 9.25 Yr. Rohit Karan 2 Apr 26 0.24 Yr. Data below for Aditya Birla Sun Life Balanced Advantage Fund as on 30 Jun 26
Asset Allocation
Asset Class Value Cash 14.17% Equity 70.6% Debt 15.23% Equity Sector Allocation
Sector Value Financial Services 22.02% Consumer Cyclical 9.85% Industrials 8.66% Technology 6.79% Basic Materials 6.76% Consumer Defensive 6.07% Health Care 5.38% Energy 4.05% Real Estate 3.56% Utility 3.4% Communication Services 2.19% Debt Sector Allocation
Sector Value Cash Equivalent 15.77% Corporate 10.44% Government 3.19% Credit Quality
Rating Value AA 39.71% AAA 60.29% Top Securities Holdings / Portfolio
Name Holding Value Quantity ICICI Bank Ltd (Financial Services)
Equity, Since 31 Oct 09 | ICICIBANK4% ₹371 Cr 2,949,376 HDFC Bank Ltd (Financial Services)
Equity, Since 31 Mar 17 | HDFCBANK3% ₹276 Cr 3,708,152
↓ -550 Kotak Mahindra Bank Ltd (Financial Services)
Equity, Since 30 Apr 18 | KOTAKBANK3% ₹254 Cr 6,602,513
↑ 133,014 Reliance Industries Ltd (Energy)
Equity, Since 30 Sep 18 | RELIANCE2% ₹226 Cr 1,709,158
↓ -340,500 IndiGrid Infrastructure Trust Units Series - IV (Utilities)
Equity, Since 31 Dec 23 | INDIGRID2% ₹218 Cr 12,713,026 State Bank of India (Financial Services)
Equity, Since 31 Oct 20 | SBIN2% ₹192 Cr 1,988,137
↓ -145,146 Axis Bank Limited
Derivatives | -2% -₹177 Cr Axis Bank Ltd (Financial Services)
Equity, Since 31 Jan 18 | AXISBANK2% ₹176 Cr 1,365,000
↓ -16,125 Infosys Ltd (Technology)
Equity, Since 31 Dec 07 | INFY2% ₹171 Cr 1,470,922 7.18% Govt Stock 2037
Sovereign Bonds | -2% ₹156 Cr 15,500,000 2. Nippon India Balanced Advantage Fund
Nippon India Balanced Advantage Fund
Growth Launch Date 15 Nov 04 NAV (21 Jul 26) ₹183.382 ↑ 0.02 (0.01 %) Net Assets (Cr) ₹9,796 on 30 Jun 26 Category Hybrid - Dynamic Allocation AMC Nippon Life Asset Management Ltd. Rating ☆☆☆ Risk Moderately High Expense Ratio 1.75 Sharpe Ratio -0.27 Information Ratio 0 Alpha Ratio 0 Min Investment 5,000 Min SIP Investment 100 Exit Load 0-1 Years (1%),1 Years and above(NIL) Growth of 10,000 investment over the years.
Date Value 30 Jun 21 ₹10,000 30 Jun 22 ₹10,145 30 Jun 23 ₹11,571 30 Jun 24 ₹14,344 30 Jun 25 ₹15,346 30 Jun 26 ₹15,708 Returns for Nippon India Balanced Advantage Fund
absolute basis & more than 1 year are on CAGR (Compound Annual Growth Rate) basis. as on 21 Jul 26 Duration Returns 1 Month 1.3% 3 Month 1.3% 6 Month 3.7% 1 Year 3.5% 3 Year 10.5% 5 Year 9.4% 10 Year 15 Year Since launch 14.4% Historical performance (Yearly) on absolute basis
Year Returns 2024 7.3% 2023 13% 2022 17.5% 2021 5.1% 2020 15.7% 2019 11.2% 2018 8.3% 2017 0.4% 2016 25.2% 2015 6.4% Fund Manager information for Nippon India Balanced Advantage Fund
Name Since Tenure Sushil Budhia 31 Mar 21 5.25 Yr. Bhavik Dave 1 Jan 26 0.49 Yr. Amber Singhania 11 Mar 26 0.3 Yr. Data below for Nippon India Balanced Advantage Fund as on 30 Jun 26
Asset Allocation
Asset Class Value Equity 85.39% Debt 18.34% Equity Sector Allocation
Sector Value Financial Services 24.76% Consumer Cyclical 10.06% Industrials 9.6% Technology 5.93% Consumer Defensive 5.85% Real Estate 4.68% Utility 3.99% Health Care 3.59% Energy 3.25% Communication Services 2.93% Basic Materials 1.35% Debt Sector Allocation
Sector Value Corporate 11.83% Government 6.53% Credit Quality
Rating Value AA 37.47% AAA 62.53% Top Securities Holdings / Portfolio
Name Holding Value Quantity ICICI Bank Ltd (Financial Services)
Equity, Since 31 Aug 18 | ICICIBANK5% ₹516 Cr 4,110,000
↑ 100,000 HDFC Bank Ltd (Financial Services)
Equity, Since 31 Oct 11 | HDFCBANK5% ₹516 Cr 6,930,648
↑ 460,000 Reliance Industries Ltd (Energy)
Equity, Since 31 May 18 | RELIANCE3% ₹264 Cr 2,000,000
↑ 150,000 Axis Bank Ltd (Financial Services)
Equity, Since 31 Oct 18 | AXISBANK3% ₹248 Cr 1,929,348
↑ 70,000 Bharti Airtel Ltd (Communication Services)
Equity, Since 31 Aug 18 | BHARTIARTL3% ₹247 Cr 1,350,000 Infosys Ltd (Technology)
Equity, Since 31 May 09 | INFY2% ₹232 Cr 2,001,912 State Bank of India (Financial Services)
Equity, Since 31 Mar 09 | SBIN2% ₹222 Cr 2,306,879
↓ -110,000 NTPC Ltd (Utilities)
Equity, Since 31 Mar 21 | NTPC2% ₹202 Cr 5,212,720
↓ -250,000 Mahindra & Mahindra Ltd (Consumer Cyclical)
Equity, Since 30 Nov 21 | M&M2% ₹200 Cr 656,709 Larsen & Toubro Ltd (Industrials)
Equity, Since 31 Jan 21 | LT2% ₹188 Cr 460,017
↓ -44,000 3. Invesco India Dynamic Equity Fund
Invesco India Dynamic Equity Fund
Growth Launch Date 4 Oct 07 NAV (21 Jul 26) ₹52.45 ↓ -0.09 (-0.17 %) Net Assets (Cr) ₹996 on 30 Jun 26 Category Hybrid - Dynamic Allocation AMC Invesco Asset Management (India) Private Ltd Rating ☆☆ Risk Moderately High Expense Ratio 2.17 Sharpe Ratio -0.97 Information Ratio 0 Alpha Ratio 0 Min Investment 5,000 Min SIP Investment 500 Exit Load NIL Growth of 10,000 investment over the years.
Date Value 30 Jun 21 ₹10,000 30 Jun 22 ₹9,795 30 Jun 23 ₹11,525 30 Jun 24 ₹14,401 30 Jun 25 ₹15,477 30 Jun 26 ₹14,797 Returns for Invesco India Dynamic Equity Fund
absolute basis & more than 1 year are on CAGR (Compound Annual Growth Rate) basis. as on 21 Jul 26 Duration Returns 1 Month 0.4% 3 Month 0.1% 6 Month -1.9% 1 Year -2.8% 3 Year 8.4% 5 Year 8.1% 10 Year 15 Year Since launch 9.2% Historical performance (Yearly) on absolute basis
Year Returns 2024 2.7% 2023 15.9% 2022 20.1% 2021 4.1% 2020 13.1% 2019 7.8% 2018 9.1% 2017 -4.6% 2016 30.5% 2015 2.7% Fund Manager information for Invesco India Dynamic Equity Fund
Name Since Tenure Deepak Gupta 25 Jun 26 0.01 Yr. Krishna Cheemalapati 1 Mar 25 1.33 Yr. Amey Sathe 4 Nov 25 0.65 Yr. Data below for Invesco India Dynamic Equity Fund as on 30 Jun 26
Asset Allocation
Asset Class Value Cash 22.84% Equity 58.21% Debt 18.88% Other 0.07% Equity Sector Allocation
Sector Value Financial Services 25.97% Consumer Cyclical 9.51% Technology 8.32% Consumer Defensive 7.41% Industrials 7.06% Energy 6.92% Basic Materials 3.23% Health Care 2.98% Communication Services 0.39% Debt Sector Allocation
Sector Value Cash Equivalent 20.3% Corporate 11.06% Government 10.36% Credit Quality
Rating Value AAA 100% Top Securities Holdings / Portfolio
Name Holding Value Quantity Invesco India Shrt DurDir Gr
Investment Fund | -8% ₹85 Cr 207,434 HDFC Bank Ltd (Financial Services)
Equity, Since 30 Sep 24 | HDFCBANK8% ₹80 Cr 1,071,450 Invesco India Low Dur Dir Gr
Investment Fund | -8% ₹78 Cr 188,958 Reliance Industries Ltd (Energy)
Equity, Since 30 Apr 21 | RELIANCE7% ₹70 Cr 532,500 ICICI Bank Ltd (Financial Services)
Equity, Since 31 Oct 18 | ICICIBANK6% ₹58 Cr 465,500
↑ 80,500 Eternal Ltd (Consumer Cyclical)
Equity, Since 31 Mar 24 | ETERNAL4% ₹44 Cr 1,758,975 Future on BANK Index
- | -4% -₹38 Cr 465,950
↓ -21,500 Future on Reliance Industries Ltd
Derivatives | -3% -₹32 Cr 237,500
↑ 237,500 Infosys Ltd (Technology)
Equity, Since 31 Oct 24 | INFY3% ₹31 Cr 270,000 Eternal Limited June 2026 Future
Derivatives | -3% -₹27 Cr 1,083,975
↑ 1,083,975 4. DSP Dynamic Asset Allocation Fund
DSP Dynamic Asset Allocation Fund
Growth Launch Date 6 Feb 14 NAV (21 Jul 26) ₹28.785 ↓ -0.01 (-0.03 %) Net Assets (Cr) ₹3,749 on 30 Jun 26 Category Hybrid - Dynamic Allocation AMC DSP BlackRock Invmt Managers Pvt. Ltd. Rating ☆ Risk Moderate Expense Ratio 1.93 Sharpe Ratio -0.2 Information Ratio 0 Alpha Ratio 0 Min Investment 1,000 Min SIP Investment 500 Exit Load 0-12 Months (1%),12 Months and above(NIL) Growth of 10,000 investment over the years.
Date Value 30 Jun 21 ₹10,000 30 Jun 22 ₹9,692 30 Jun 23 ₹10,986 30 Jun 24 ₹13,236 30 Jun 25 ₹14,293 30 Jun 26 ₹14,841 Returns for DSP Dynamic Asset Allocation Fund
absolute basis & more than 1 year are on CAGR (Compound Annual Growth Rate) basis. as on 21 Jul 26 Duration Returns 1 Month 0.8% 3 Month 1% 6 Month 2.4% 1 Year 4.1% 3 Year 10.2% 5 Year 8.2% 10 Year 15 Year Since launch 8.9% Historical performance (Yearly) on absolute basis
Year Returns 2024 8.7% 2023 12.4% 2022 17.1% 2021 0.1% 2020 9.3% 2019 12.9% 2018 8.8% 2017 3.6% 2016 12.5% 2015 7.7% Fund Manager information for DSP Dynamic Asset Allocation Fund
Name Since Tenure Rohit Singhania 1 Nov 23 2.67 Yr. Preethi S 1 Oct 25 0.75 Yr. Shantanu Godambe 1 Jan 25 1.5 Yr. Kaivalya Nadkarni 1 Oct 24 1.75 Yr. Data below for DSP Dynamic Asset Allocation Fund as on 30 Jun 26
Asset Allocation
Asset Class Value Cash 29.25% Equity 45.17% Debt 25.59% Equity Sector Allocation
Sector Value Financial Services 30.03% Consumer Cyclical 5.73% Health Care 3.37% Consumer Defensive 3.31% Basic Materials 3.25% Utility 3.24% Technology 3.24% Communication Services 2.67% Industrials 2.31% Energy 0.86% Debt Sector Allocation
Sector Value Cash Equivalent 27.95% Corporate 14.72% Government 12.17% Credit Quality
Rating Value AA 15.94% AAA 84.06% Top Securities Holdings / Portfolio
Name Holding Value Quantity ICICI Bank Ltd (Financial Services)
Equity, Since 28 Feb 18 | ICICIBANK6% ₹216 Cr 1,716,389
↑ 146,068 HDFC Bank Ltd (Financial Services)
Equity, Since 28 Feb 18 | HDFCBANK5% ₹185 Cr 2,478,718
↑ 120,252 Axis Bank Ltd (Financial Services)
Equity, Since 30 Sep 18 | AXISBANK4% ₹131 Cr 1,019,881
↑ 144,013 7.32% Govt Stock 2030
Sovereign Bonds | -3% ₹108 Cr 10,500,000 Icici Bank Limited Jun26
Derivatives | -3% -₹93 Cr 731,500
↑ 731,500 Icici Bank Limited
Equity, Since 28 Feb 18 | ICICIBANK3% ₹92 Cr 731,500
↑ 200,900 Hdfc Bank Limited
Equity, Since 28 Feb 18 | HDFCBANK2% ₹87 Cr 1,163,800
↓ -599,500 Hdfc Bank Limited Jun26
Derivatives | -2% -₹86 Cr 1,163,800
↑ 1,163,800 Bandhan Bank Limited Jun26
Derivatives | -2% -₹82 Cr 3,895,200
↑ 3,895,200 Bandhan Bank Ltd (Financial Services)
Equity, Since 31 Dec 23 | BANDHANBNK2% ₹81 Cr 3,895,200 5. SBI Dynamic Asset Allocation Fund
SBI Dynamic Asset Allocation Fund
Growth Launch Date 26 Mar 15 NAV (02 Jul 21) ₹15.9463 ↑ 0.03 (0.18 %) Net Assets (Cr) ₹655 on 31 May 21 Category Hybrid - Dynamic Allocation AMC SBI Funds Management Private Limited Rating Risk Moderately High Expense Ratio 2.07 Sharpe Ratio 2.59 Information Ratio 0 Alpha Ratio 0 Min Investment 5,000 Min SIP Investment 500 Exit Load 0-12 Months (1%),12 Months and above(NIL) Growth of 10,000 investment over the years.
Date Value Returns for SBI Dynamic Asset Allocation Fund
absolute basis & more than 1 year are on CAGR (Compound Annual Growth Rate) basis. as on 21 Jul 26 Duration Returns 1 Month 1% 3 Month 3.9% 6 Month 6.2% 1 Year 25.1% 3 Year 6.9% 5 Year 8.3% 10 Year 15 Year Since launch 7.7% Historical performance (Yearly) on absolute basis
Year Returns 2024 2023 2022 2021 2020 2019 2018 2017 2016 2015 Fund Manager information for SBI Dynamic Asset Allocation Fund
Name Since Tenure Data below for SBI Dynamic Asset Allocation Fund as on 31 May 21
Asset Allocation
Asset Class Value Equity Sector Allocation
Sector Value Debt Sector Allocation
Sector Value Credit Quality
Rating Value Top Securities Holdings / Portfolio
Name Holding Value Quantity
Recent Trends & SEBI Regulations to Note
sebi classification: Balanced Advantage (Dynamic Asset Allocation) schemes officially recognized in SEBI categorizations.
Taxation rules: If the equity orientation at a given time is ≥ 65%, then for tax purposes the gains are treated like Equity Funds (i.e., long-term Capital Gains (LTCG) rules applicable). If below that, treated more like hybrid / debt in certain respects.
Recent performance / inflows: ET Money reports 5-year annualised returns of ~14.4% p.a. for Dynamic Asset Allocation (BAF) category.
AMFI / IndMoney data shows that HDFC Balanced Advantage Fund, ICICI Prudential Balanced Advantage, etc., are among top in 5-year returns (~15-16% for many) with moderate expense ratios
Balanced Advantage vs. Other Hybrid Categories
| Category | Fixed vs Dynamic Allocation | Typical Equity Exposure | Tax Treatment when Equity Exposure ≥65% | When It Works Best |
|---|---|---|---|---|
| Balanced Advantage (Dynamic Asset Allocation) | Dynamic | ~30-80% (varies by fund) | If equity exposure ≥65%, taxed like equity (LTCG etc.) | In volatile markets; when valuations matter; for moderate growth + risk control |
| Aggressive Hybrid / Balanced Hybrid | Some fixed ratios (e.g. 65-80% equity) | Always high | Usually taxed as equity if meets thresholds | For long term growth; when investor is comfortable with higher equity risk |
| Multi-Asset Allocation Funds | Must invest in ≥ 3 asset classes (equity, debt, other e.g. gold) | Equity + others; more diversified | Varies depending on allocations | Good for further risk spreading; inflation protection etc |
Risks and What to Check Before Investing
Equity exposure swings: When markets are overvalued, fund managers may reduce equity exposure → lower returns in bull runs.
Expense ratio & exit loads: Even small differences (0.5% vs 0.9%) can eat returns over long periods.
Fund size & liquidity: Very large funds may become less flexible. Very small ones might have liquidity issues.
Historical downside: Check worst drawdowns (e.g. 2022, 2020) to see how funds handled market crashes.
Tax implications: Know whether fund has crossed the 65% equity threshold in recent past (look at latest factsheet).
Balanced Advantage vs. Aggressive Hybrid Funds
Investors often confuse Balanced Advantage Funds with Aggressive Hybrid Funds. While both sit in the hybrid category, their working is very different:
Allocation Style
- Balanced Advantage: Dynamic; can shift equity anywhere between ~30%–80% depending on market conditions.
- Aggressive Hybrid: Fixed; maintains 65%–80% equity exposure consistently.
Market Performance
- Balanced Advantage: Protects downside better in volatile or bearish markets.
- Aggressive Hybrid: Outperforms in strong bull runs but carries higher risk in corrections.
Taxation
- Both generally qualify for equity taxation (if equity exposure ≥65%).
- BAFs occasionally dip equity lower, but still usually structured to maintain equity status.
Who Should Choose
- Balanced Advantage: Investors who want smoother returns, prefer dynamic risk management, and dislike high volatility.
- Aggressive Hybrid: Investors comfortable with higher equity risk and aiming for long-term growth during bullish phases.
Who Should Invest in Balanced Advantage Funds?
- Investors seeking moderate returns with less volatility than pure equity.
- People with medium‐term horizon ( 3-5 years + ), not short-term only.
- Those who prefer active risk management by fund managers.
- Investors wanting tax efficiency (if fund qualifies as equity for LTCG).
FAQs
1. Is Balanced Advantage the same as Balanced Hybrid?
A: No — Balanced Advantage allows dynamic switching between equity & debt; Balanced Hybrid has more fixed ratio bands.
2. Do these funds underperform in bull markets?
A: Yes, usually when equity markets are soaring, these might lag pure equity funds because of defensive exposure.
3. What is the minimum investment horizon?
A: Minimum of 3 years is recommended to ride out volatility and benefit from rebalancing.
4. How are taxes computed?
A: If at a point the fund’s equity exposure ≥ 65%, gains are taxed like equity (LTCG etc.). If lower, then gains may face different treatment similar to hybrid/debt depending on fund’s orientation.
Conclusion
Balanced Advantage Funds give investors the comfort of equity participation with the safety net of dynamic risk management. With markets uncertain yet India’s growth story intact, these funds offer a smoother way to build wealth without taking on excessive risk.
Looking for the right Balanced Advantage Fund for your portfolio? Use Fincash’s free SIP calculator and explore customised Investment plan today.
All efforts have been made to ensure the information provided here is accurate. However, no guarantees are made regarding correctness of data. Please verify with scheme information document before making any investment.


AMFI Registration No. 112358 | CIN: U74999MH2016PTC282153
Shepard Technologies Pvt. Ltd. (with ARN code 112358) makes no warranties or representations, express or implied, on products offered through the platform. It accepts no liability for any damages or losses, however caused, in connection with the use of, or on the reliance of its product or related services. Terms and conditions of the website are applicable.
©2026 Shepard Technologies Private Limited. All Rights Reserved
Informative . Comparison has been shown nicely in small space.