SIP இல் ஆபத்து: SIP முதலீட்டில் உள்ள இடர் மதிப்பீடு
உள்ள ஆபத்துஎஸ்ஐபி வெவ்வேறு வகைகளுக்கு மாறுபடும்மியூச்சுவல் ஃபண்டுகளின் வகைகள்.மியூச்சுவல் ஃபண்டுகளில் முதலீடு செய்தல் SIP வழியாக (முறையானமுதலீட்டுத் திட்டம்) ஈடுபடுத்துகிறதுசந்தை இணைக்கப்பட்ட அபாயங்கள், அவை நிச்சயமாக அதிகம்ஈக்விட்டி நிதிகள் கடன் மற்றும் சமநிலையை விடபரஸ்பர நிதி. SIP இல் உள்ள அபாயமானது, கருத்தில் கொண்டு தேர்ந்தெடுக்கப்பட்ட முதலீட்டு விருப்பத்தைப் பொறுத்ததுஆபத்து விவரக்குறிப்பு, ஆபத்து பசியின்மை மற்றும்நீர்மை நிறை. இருப்பினும், SIP இல் உள்ள அபாயத்தை ஃபண்ட் மேலாளர்கள் மற்றும் ஃபண்ட் ஹவுஸ் நிர்வகிக்கலாம் மற்றும் குறைக்கலாம்.
SIP இல் உள்ள அபாயத்தைக் கணக்கிட, பல்வேறு கருவிகள் உள்ளனசிப் கால்குலேட்டர் (SIP ரிட்டர்ன் கால்குலேட்டர் என்றும் அழைக்கப்படுகிறது).
SIP இல் ஆபத்து: SIP அபாயங்களின் மதிப்பீடு
ஆபத்து 1: SIP எதிர்மறையான வருமானம் அல்லது விலை அபாயத்தைப் பெறும் ஆபத்து
மியூச்சுவல் ஃபண்ட் முதலீடுகள் சந்தை அபாயங்களுக்கு உட்பட்டவை, பொதுவாகக் கேட்கப்படும் சொல். இதன் பொருள் என்னவென்றால், ஒரு SIP இல் உங்கள் முதலீடு குறையக்கூடும், மேலும் சந்தை எவ்வாறு செயல்படுகிறது என்பதைப் பொறுத்து நீங்கள் முதலீடு செய்ததை விட குறைவான மதிப்பில் நீங்கள் முடிவடையும்.
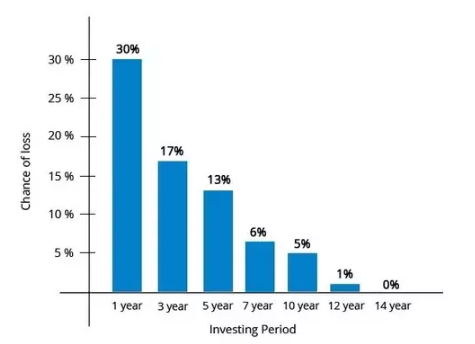
இருப்பினும் SIP இல் உள்ள ஆபத்து ஹோல்டிங் காலத்துடன் தொடர்புடையது மற்றும் வழக்கமாக, நீண்ட வைத்திருக்கும் காலம், குறைந்த ஆபத்து. அதிக ஹோல்டிங் காலத்துடன் லாபம் ஈட்டுவதற்கான நிகழ்தகவு அதிகரிக்கிறது. எ.கா. ஈக்விட்டியை கீழே பார்க்கவும், ஈக்விட்டியை நீண்ட நேரம் வைத்திருக்கும் காலம் இழப்புக்கான வாய்ப்பைக் குறைக்கிறது. (கீழே உள்ளவை பிஎஸ்இ சென்செக்ஸில் 1979 முதல் 2016 வரை செய்யப்பட்ட பகுப்பாய்வு).
ஆபத்து 2: உங்கள் பணத்தை விரைவாக திரும்பப் பெறுவதற்கான ஆபத்து அல்லது பணப்புழக்க ஆபத்து
உங்கள் பணத்தை விரைவாக திரும்பப் பெறுவதற்கான திறனைப் பொறுத்ததுஅடிப்படை முதலீடுகள். பொதுவாக பரஸ்பர நிதிகளில், இது ஒரு பிரச்சினை அல்ல, இருப்பினும், பத்திரங்களை விற்பதில் சிக்கல் இருந்த காலங்கள் (2008 இல்)பத்திரங்கள்) மற்றும் சில பரஸ்பர நிதிகள் சில திட்டங்களிலிருந்து திரும்பப் பெறுவதைக் கட்டுப்படுத்த வேண்டும். பங்குச் சந்தை மிகவும் திரவமானது (அதாவது வாங்குவதும் விற்பதும் ஒரு சிக்கலை ஏற்படுத்தாது). எவ்வாறாயினும், விற்பனை அளவு வாங்குபவர்களின் எண்ணிக்கையை விட அதிகமாக இருந்தால், இது ஒரு சிக்கலை ஏற்படுத்தும், எனவே அடுத்தடுத்த கொடுப்பனவுகளை சிக்கலாக்கும் மற்றும் பணப்புழக்க அபாயம்.
ஆபத்து 3: பாதுகாப்பு அல்லது கடன் அபாயத்தை தரமிறக்குவதற்கான ஆபத்து
கிரெடிட் ரேட்டிங் ஏஜென்சியால் ஒரு குறிப்பிட்ட நிறுவனம்/நிறுவனத்தின் பத்திரம் குறைக்கப்படும்போது, அதன் விலை குறையும். விலை குறைந்தால், இது போர்ட்ஃபோலியோவின் ஒட்டுமொத்த மதிப்பை பாதிக்கும். இது கடன் ஆபத்து என்று அழைக்கப்படுகிறது.
Talk to our investment specialist
ஆபத்து 4: நிறுவனம் பத்திரத்தின் உரிமையாளர்களுக்கு அவர்களின் நிலுவைத் தொகை அல்லது இயல்புநிலை அபாயத்தை செலுத்தாததால் ஏற்படும் ஆபத்து
ஒரு நிறுவனம் பத்திரம் வைத்திருப்பவர்களுக்கு அதன் பணம் செலுத்துவதில் தவறினால், அது அழைக்கப்படுகிறதுஇயல்புநிலை ஆபத்து.
உடன்முதலீட்டாளர் அவர்களின் பணத்தை திரும்பப் பெறவில்லை, இது அவர்களின் போர்ட்ஃபோலியோவை எதிர்மறையாக பாதிக்கும்.
ஆபத்து 5: உங்கள் பரிவர்த்தனையை சரியாகச் செயல்படுத்தும் ஆபத்து அல்லது தொழில்நுட்ப ஆபத்து
இன்று அனைத்து பரிவர்த்தனைகளும் மின்னணு முறையில் நடைபெறுகின்றன. பல்வேறு தொடு புள்ளிகளுடன், பல்வேறு இடங்களில், ஆர் & டி ஏஜென்டில், தொழில்நுட்ப தோல்வி ஏற்பட வாய்ப்பு உள்ளது.வங்கி நிதிகளை டெபிட் செய்ய
ஒரு பரிவர்த்தனையைச் செயல்படுத்தாமல் இருப்பதும் SIP இல் ஆபத்து.
ஆபத்து 6: போர்ட்ஃபோலியோ மேலாளரின் திட்ட செயல்திறனின் ஆபத்து அல்லது நிதி மேலாண்மை ஆபத்து

SIP இல் உள்ள மற்றொரு ஆபத்து என்னவென்றால், தேர்ந்தெடுக்கப்பட்ட திட்டம் எதிர்பார்ப்புகளை வழங்காமல் இருக்கலாம், மேலும் செயல்திறன் எதிர்பார்த்ததை விட மிகக் குறைவாக இருக்கலாம். நிதி மேலாளர் செயல்திறனில் குறைவாக வழங்கலாம், மேலும் இது குறைந்த வருமானத்திற்கு வழிவகுக்கும்SIP முதலீடு.
இவைதான் SIP இல் உள்ள முக்கிய அபாயங்கள், அதே சமயம் நாம் SIP இல் உள்ள மேலும் அபாயங்களை விரிவாகக் கூறலாம்.பொருளாதாரம் ஆபத்து போன்றவை, இந்த அபாயங்களில் பெரும்பாலானவை மேலே உள்ள ஒன்று அல்லது அதற்கு மேற்பட்ட வகைகளின் கீழ் வரும்.
SIP இல் கண்டிப்பாக ஆபத்து இருந்தாலும், SIP அல்லது மொத்த தொகை என்பதை எப்போதும் நினைவில் கொள்ள வேண்டும், இது ஒரு முதலீட்டு வழி மற்றும் அடிப்படை முதலீடு அல்ல. ஒருவர் அடிப்படை முதலீடு, அதன் அபாயங்கள் ஆகியவற்றைப் பார்த்து, இறுதி முடிவை எடுக்க வேண்டும்.
*இன் பட்டியல் கீழே உள்ளதுசிறந்த SIPமுதலீடு செய்ய ஒருவர் மதிப்பீடு செய்யலாம் "The primary investment objective of the Scheme is to seek capital appreciation by investing predominantly in units of MLIIF - WGF. The Scheme may, at the discretion of the Investment Manager, also invest in the units of other similar overseas mutual fund schemes, which may constitute a significant part of its corpus. The Scheme may also invest a certain portion of its corpus in money market securities and/or units of money market/liquid schemes of DSP Merrill Lynch Mutual Fund, in order to meet liquidity requirements from time to time. However, there is no assurance that the investment objective of the Scheme will be realized." Below is the key information for DSP World Gold Fund Returns up to 1 year are on The primary investment objective of the Scheme is to seek capital appreciation by investing predominantly in units of BGF – USFEF. The Scheme may, at the discretion of the Investment Manager also invest in the units of other similar overseas mutual fund schemes, which may constitute a significant part of its corpus. The Scheme may also invest a certain portion of its corpus in money market securities and/or money market/liquid schemes of DSP BlackRock Mutual Fund, in order to meet liquidity requirements from time to time. However, there is no assurance that the investment objective of the Scheme will be realized. It shall be noted ‘similar overseas mutual fund schemes’ shall have investment objective, investment strategy and risk profile/consideration similar to those of BGF – USFEF. Research Highlights for DSP US Flexible Equity Fund Below is the key information for DSP US Flexible Equity Fund Returns up to 1 year are on The primary investment objective of the Scheme is to seek to provide long term capital growth by investing predominantly in the JPMorgan Funds - Emerging Markets Opportunities Fund, an equity fund which invests primarily in an aggressively managed portfolio of emerging market companies Research Highlights for Edelweiss Emerging Markets Opportunities Equity Off-shore Fund Below is the key information for Edelweiss Emerging Markets Opportunities Equity Off-shore Fund Returns up to 1 year are on The investment objective of the scheme is to provide long term growth from a portfolio of equity / equity related instruments of companies engaged either directly or indirectly in the infrastructure sector. Research Highlights for LIC MF Infrastructure Fund Below is the key information for LIC MF Infrastructure Fund Returns up to 1 year are on The investment objective of the scheme is to provide long-term capital appreciation by investing in an overseas mutual fund scheme that invests in a diversified portfolio of securities as prescribed by SEBI from time to time in global emerging markets. Research Highlights for Kotak Global Emerging Market Fund Below is the key information for Kotak Global Emerging Market Fund Returns up to 1 year are on 1. DSP World Gold Fund
DSP World Gold Fund
Growth Launch Date 14 Sep 07 NAV (10 Jul 26) ₹49.976 ↓ -0.05 (-0.09 %) Net Assets (Cr) ₹1,679 on 31 May 26 Category Equity - Global AMC DSP BlackRock Invmt Managers Pvt. Ltd. Rating ☆☆☆ Risk High Expense Ratio 1.41 Sharpe Ratio 1.77 Information Ratio -0.78 Alpha Ratio -0.46 Min Investment 1,000 Min SIP Investment 500 Exit Load 0-12 Months (1%),12 Months and above(NIL) Growth of 10,000 investment over the years.
Date Value 30 Jun 21 ₹10,000 30 Jun 22 ₹8,181 30 Jun 23 ₹9,294 30 Jun 24 ₹10,640 30 Jun 25 ₹16,808 30 Jun 26 ₹27,693 Returns for DSP World Gold Fund
absolute basis & more than 1 year are on CAGR (Compound Annual Growth Rate) basis. as on 10 Jul 26 Duration Returns 1 Month 0.1% 3 Month -20.7% 6 Month -11.3% 1 Year 66.5% 3 Year 44.4% 5 Year 22.6% 10 Year 15 Year Since launch 8.9% Historical performance (Yearly) on absolute basis
Year Returns 2025 167.1% 2024 15.9% 2023 7% 2022 -7.7% 2021 -9% 2020 31.4% 2019 35.1% 2018 -10.7% 2017 -4% 2016 52.7% Fund Manager information for DSP World Gold Fund
Name Since Tenure Kaivalya Nadkarni 1 May 25 1.17 Yr. Data below for DSP World Gold Fund as on 31 May 26
Equity Sector Allocation
Sector Value Basic Materials 94.47% Asset Allocation
Asset Class Value Cash 3.62% Equity 94.47% Debt 0% Other 1.91% Top Securities Holdings / Portfolio
Name Holding Value Quantity BGF World Gold I2
Investment Fund | -68% ₹1,141 Cr 1,005,044 VanEck Gold Miners ETF
- | GDX29% ₹490 Cr 573,719 Treps / Reverse Repo Investments
CBLO/Reverse Repo | -3% ₹54 Cr Net Receivables/Payables
Net Current Assets | -0% -₹6 Cr 2. DSP US Flexible Equity Fund
DSP US Flexible Equity Fund
Growth Launch Date 3 Aug 12 NAV (10 Jul 26) ₹93.7535 ↑ 0.04 (0.04 %) Net Assets (Cr) ₹1,323 on 31 May 26 Category Equity - Global AMC DSP BlackRock Invmt Managers Pvt. Ltd. Rating ☆☆☆☆☆ Risk High Expense Ratio 1.55 Sharpe Ratio 2.57 Information Ratio 0.13 Alpha Ratio -3.23 Min Investment 1,000 Min SIP Investment 500 Exit Load 0-12 Months (1%),12 Months and above(NIL) Growth of 10,000 investment over the years.
Date Value 30 Jun 21 ₹10,000 30 Jun 22 ₹9,273 30 Jun 23 ₹11,265 30 Jun 24 ₹13,557 30 Jun 25 ₹15,785 30 Jun 26 ₹23,371 Returns for DSP US Flexible Equity Fund
absolute basis & more than 1 year are on CAGR (Compound Annual Growth Rate) basis. as on 10 Jul 26 Duration Returns 1 Month 2.4% 3 Month 15.2% 6 Month 19.8% 1 Year 48.5% 3 Year 27.5% 5 Year 18.2% 10 Year 15 Year Since launch 17.4% Historical performance (Yearly) on absolute basis
Year Returns 2025 33.8% 2024 17.8% 2023 22% 2022 -5.9% 2021 24.2% 2020 22.6% 2019 27.5% 2018 -1.1% 2017 15.5% 2016 9.8% Fund Manager information for DSP US Flexible Equity Fund
Name Since Tenure Kaivalya Nadkarni 1 May 25 1.17 Yr. Data below for DSP US Flexible Equity Fund as on 31 May 26
Equity Sector Allocation
Sector Value Technology 33.05% Industrials 13.62% Financial Services 12.17% Communication Services 12.05% Consumer Cyclical 9.62% Health Care 7.65% Basic Materials 2.45% Energy 2.43% Asset Allocation
Asset Class Value Cash 6.96% Equity 93.02% Debt 0.01% Top Securities Holdings / Portfolio
Name Holding Value Quantity BGF US Flexible Equity I2
Investment Fund | -96% ₹1,265 Cr 1,784,131
↓ -32,921 Treps / Reverse Repo Investments
CBLO/Reverse Repo | -4% ₹59 Cr Net Receivables/Payables
Net Current Assets | -0% -₹2 Cr 3. Edelweiss Emerging Markets Opportunities Equity Off-shore Fund
Edelweiss Emerging Markets Opportunities Equity Off-shore Fund
Growth Launch Date 7 Jul 14 NAV (10 Jul 26) ₹28.3601 ↓ -0.20 (-0.69 %) Net Assets (Cr) ₹250 on 31 May 26 Category Equity - Global AMC Edelweiss Asset Management Limited Rating ☆☆☆ Risk High Expense Ratio 1.04 Sharpe Ratio 2.62 Information Ratio -0.4 Alpha Ratio 5.56 Min Investment 5,000 Min SIP Investment 1,000 Exit Load 0-1 Years (1%),1 Years and above(NIL) Growth of 10,000 investment over the years.
Date Value 30 Jun 21 ₹10,000 30 Jun 22 ₹7,234 30 Jun 23 ₹7,605 30 Jun 24 ₹8,447 30 Jun 25 ₹9,445 30 Jun 26 ₹15,783 Returns for Edelweiss Emerging Markets Opportunities Equity Off-shore Fund
absolute basis & more than 1 year are on CAGR (Compound Annual Growth Rate) basis. as on 10 Jul 26 Duration Returns 1 Month 2.4% 3 Month 13.3% 6 Month 29.1% 1 Year 65.1% 3 Year 27.2% 5 Year 10% 10 Year 15 Year Since launch 9.1% Historical performance (Yearly) on absolute basis
Year Returns 2025 41.1% 2024 5.9% 2023 5.5% 2022 -16.8% 2021 -5.9% 2020 21.7% 2019 25.1% 2018 -7.2% 2017 30% 2016 9.8% Fund Manager information for Edelweiss Emerging Markets Opportunities Equity Off-shore Fund
Name Since Tenure Bhavesh Jain 9 Apr 18 8.23 Yr. Bharat Lahoti 1 Oct 21 4.75 Yr. Data below for Edelweiss Emerging Markets Opportunities Equity Off-shore Fund as on 31 May 26
Equity Sector Allocation
Sector Value Technology 35.88% Financial Services 20.6% Consumer Cyclical 10.01% Communication Services 7.79% Industrials 5.82% Energy 5.13% Basic Materials 2.8% Consumer Defensive 1.98% Utility 1.27% Health Care 0.52% Asset Allocation
Asset Class Value Cash 6.04% Equity 93.14% Debt 0.01% Other 0.49% Top Securities Holdings / Portfolio
Name Holding Value Quantity JPM Emerging Mkts Opps I acc USD
Investment Fund | -96% ₹241 Cr 102,137
↑ 3,897 Clearing Corporation Of India Ltd.
CBLO/Reverse Repo | -4% ₹10 Cr Net Receivables/(Payables)
CBLO | -0% -₹1 Cr Accrued Interest
CBLO | -0% ₹0 Cr 4. LIC MF Infrastructure Fund
LIC MF Infrastructure Fund
Growth Launch Date 29 Feb 08 NAV (13 Jul 26) ₹54.7898 ↓ -0.18 (-0.34 %) Net Assets (Cr) ₹1,099 on 31 May 26 Category Equity - Sectoral AMC LIC Mutual Fund Asset Mgmt Co Ltd Rating Risk High Expense Ratio 2.21 Sharpe Ratio 0.26 Information Ratio 0.55 Alpha Ratio 4.51 Min Investment 5,000 Min SIP Investment 1,000 Exit Load 0-1 Years (1%),1 Years and above(NIL) Growth of 10,000 investment over the years.
Date Value 30 Jun 21 ₹10,000 30 Jun 22 ₹11,137 30 Jun 23 ₹14,179 30 Jun 24 ₹26,268 30 Jun 25 ₹26,896 30 Jun 26 ₹29,151 Returns for LIC MF Infrastructure Fund
absolute basis & more than 1 year are on CAGR (Compound Annual Growth Rate) basis. as on 10 Jul 26 Duration Returns 1 Month 5.4% 3 Month 11% 6 Month 13.3% 1 Year 8.7% 3 Year 26.6% 5 Year 23.5% 10 Year 15 Year Since launch 9.7% Historical performance (Yearly) on absolute basis
Year Returns 2025 -3.7% 2024 47.8% 2023 44.4% 2022 7.9% 2021 46.6% 2020 -0.1% 2019 13.3% 2018 -14.6% 2017 42.2% 2016 -2.2% Fund Manager information for LIC MF Infrastructure Fund
Name Since Tenure Sumit Bhatnagar 7 Apr 26 0.23 Yr. Mahesh Bendre 1 Jul 24 2 Yr. Data below for LIC MF Infrastructure Fund as on 31 May 26
Equity Sector Allocation
Sector Value Industrials 37.05% Consumer Cyclical 20.88% Basic Materials 12.42% Utility 11.88% Communication Services 5.02% Financial Services 3.98% Real Estate 1.97% Health Care 1.89% Technology 1.08% Asset Allocation
Asset Class Value Cash 3.82% Equity 96.18% Top Securities Holdings / Portfolio
Name Holding Value Quantity Larsen & Toubro Ltd (Industrials)
Equity, Since 30 Apr 09 | LT4% ₹44 Cr 106,968
↓ -10,884 Garware Hi-Tech Films Ltd (Basic Materials)
Equity, Since 31 Aug 23 | 5006554% ₹40 Cr 65,325
↓ -7,684 Tata Motors Passenger Vehicles Ltd (Consumer Cyclical)
Equity, Since 28 Feb 26 | TMPV4% ₹39 Cr 982,891
↓ -332,760 Tata Motors Ltd (Consumer Cyclical)
Equity, Since 31 Oct 25 | TMCV4% ₹39 Cr 1,015,933
↑ 26,983 Tata Power Co Ltd (Utilities)
Equity, Since 29 Feb 24 | TATAPOWER3% ₹36 Cr 861,040
↑ 524,312 KSH International Ltd (Industrials)
Equity, Since 31 Dec 25 | KSHINTL3% ₹34 Cr 432,816
↑ 6,280 Siemens Energy India Ltd (Utilities)
Equity, Since 31 Aug 25 | ENRIN3% ₹34 Cr 87,106
↑ 24,800 JSW Infrastructure Ltd (Industrials)
Equity, Since 30 Apr 26 | JSWINFRA3% ₹31 Cr 1,133,858
↑ 745,681 Carraro India Ltd (Consumer Cyclical)
Equity, Since 31 Dec 24 | CARRARO3% ₹31 Cr 572,991 Bharat Dynamics Ltd Ordinary Shares (Industrials)
Equity, Since 31 Jan 26 | BDL3% ₹29 Cr 242,954
↑ 157,744 5. Kotak Global Emerging Market Fund
Kotak Global Emerging Market Fund
Growth Launch Date 26 Sep 07 NAV (10 Jul 26) ₹39.562 ↑ 0.17 (0.42 %) Net Assets (Cr) ₹1,793 on 31 May 26 Category Equity - Global AMC Kotak Mahindra Asset Management Co Ltd Rating ☆☆☆ Risk High Expense Ratio 1.64 Sharpe Ratio 2.29 Information Ratio -0.25 Alpha Ratio -1.76 Min Investment 5,000 Min SIP Investment 1,000 Exit Load 0-1 Years (1%),1 Years and above(NIL) Growth of 10,000 investment over the years.
Date Value 30 Jun 21 ₹10,000 30 Jun 22 ₹7,904 30 Jun 23 ₹8,130 30 Jun 24 ₹9,267 30 Jun 25 ₹10,468 30 Jun 26 ₹16,878 Returns for Kotak Global Emerging Market Fund
absolute basis & more than 1 year are on CAGR (Compound Annual Growth Rate) basis. as on 10 Jul 26 Duration Returns 1 Month 1.6% 3 Month 13.4% 6 Month 23.8% 1 Year 54.6% 3 Year 26.1% 5 Year 11.1% 10 Year 15 Year Since launch 7.6% Historical performance (Yearly) on absolute basis
Year Returns 2025 39.1% 2024 5.9% 2023 10.8% 2022 -15% 2021 -0.5% 2020 29.1% 2019 21.4% 2018 -14.4% 2017 30.4% 2016 -1.2% Fund Manager information for Kotak Global Emerging Market Fund
Name Since Tenure Arjun Khanna 9 May 19 7.15 Yr. Data below for Kotak Global Emerging Market Fund as on 31 May 26
Equity Sector Allocation
Sector Value Technology 43.42% Financial Services 19.61% Industrials 8.58% Consumer Cyclical 8.12% Basic Materials 6.67% Communication Services 5.05% Energy 4.51% Health Care 0.71% Asset Allocation
Asset Class Value Cash 3.32% Equity 96.68% Top Securities Holdings / Portfolio
Name Holding Value Quantity CI Emerging Markets Class A
Investment Fund | -98% ₹1,762 Cr 4,589,366
↑ 100,988 Triparty Repo
CBLO/Reverse Repo | -2% ₹33 Cr Net Current Assets/(Liabilities)
Net Current Assets | -0% -₹2 Cr
இங்கு வழங்கப்பட்ட தகவல்கள் துல்லியமானவை என்பதை உறுதிப்படுத்த அனைத்து முயற்சிகளும் மேற்கொள்ளப்பட்டுள்ளன. இருப்பினும், தரவின் சரியான தன்மை குறித்து எந்த உத்தரவாதமும் அளிக்கப்படவில்லை. முதலீடு செய்வதற்கு முன் திட்டத் தகவல் ஆவணத்துடன் சரிபார்க்கவும்.


AMFI Registration No. 112358 | CIN: U74999MH2016PTC282153
Shepard Technologies Pvt. Ltd. (with ARN code 112358) makes no warranties or representations, express or implied, on products offered through the platform. It accepts no liability for any damages or losses, however caused, in connection with the use of, or on the reliance of its product or related services. Terms and conditions of the website are applicable.
©2026 Shepard Technologies Private Limited. All Rights Reserved
Research Highlights for DSP World Gold Fund