ELSS بمقابلہ ٹیکس سیونگ FD
ایکویٹی سے منسلک بچت اسکیم (ELSS)
ای ایل ایس ایس واحد ہےمشترکہ فنڈ 80C کٹوتیوں کے لیے اہل۔ یہ ایک متنوع ایکویٹی میوچل فنڈ ہے جو روپے تک ٹیکس کٹوتیوں کی پیشکش کرتا ہے۔ 1.5 لاکھ سالانہ کے تحتسیکشن 80 سی کیانکم ٹیکس ایکٹ (آئی ٹی ایکٹ 1961)۔

فروری بجٹ 2018 کے متعارف ہونے سے پہلے، اس کے ریٹرن مکمل طور پر ٹیکس سے پاک تھے۔ تاہم، اب یہ 10٪ طویل مدتی سے مشروط ہے۔سرمایہ منافع ٹیکس اگر آپ کےکیپٹل گینز روپے سے زیادہ ایک سال بعد ایک لاکھ۔ 10% ٹیکس کٹوتی کے بعد بھی، ELSS میں ٹیکس بچانے والے دیگر آلات کے مقابلے اعلیٰ منافع فراہم کرنے کی صلاحیت ہے۔ ELSS سرمایہ کاری کے مراعات صرف تک محدود نہیں ہیں۔ٹیکس محفوظ کر لیا دیکمپاؤنڈنگ کی طاقت اس بات کو یقینی بناتا ہے کہ اگر آپ 5 سال (ٹیکس کی بچت کی مدت) کے لیے سرمایہ کاری کرتے ہیں تو آپ کی سرمایہ کاری دوگنی ہو جاتی ہے۔ایف ڈی)۔ اس میں اضافہ کرنے کے لیے، کم از کم لاک ان مدت صرف 3 سال ہے۔
ٹیکس کی بچت فکسڈ ڈپازٹس
سرمایہ کاری بینکوں میں فکسڈ ڈپازٹ میں رقم افراد اور HUFs کو ٹیکس کا دعوی کرنے کی اجازت دیتی ہے۔کٹوتی روپے تک 1,50،000 ایک مالی سال میں. ان ڈپازٹس کا لاک ان پیریڈ 5 سال ہوتا ہے۔ تاہم، آپ اس ڈپازٹ کو وقت سے پہلے واپس نہیں لے سکتے۔ لیکن آپ مسابقتی شرحوں پر اپنی ایف ڈی کے خلاف قرض حاصل کر سکتے ہیں۔ تاہم، ان ڈپازٹس پر حاصل ہونے والا سود فرد کے ٹیکس کے قابل ٹیکس کی معمولی شرح ہے (ٹیکس بریکٹ کے مطابق)۔
ٹیکس سیور ایف ڈی کی جھلکیاں
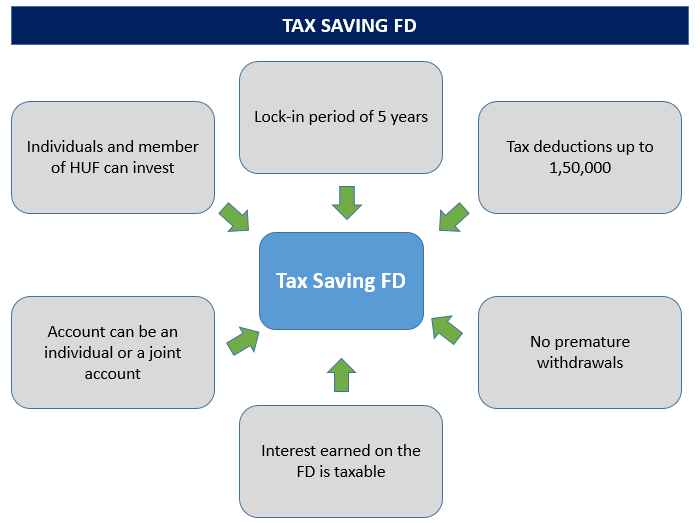
آئیے کی اہم جھلکیاں دیکھتے ہیں۔ٹیکس بچانے والا ایف ڈی -
- صرف افراد اور ممبرانہندو غیر منقسم خاندان (HUF) میں سرمایہ کاری کر سکتے ہیں۔ٹیکس بچانے والی ایف ڈی سکیم
- ٹیکس سیور FD کی کم از کم سرمایہ کاری کی رقم مختلف ہوتی ہے۔بینک بینک کو
- ٹیکس بچانے والی ایف ڈی کی لاک ان مدت پانچ سال ہے۔
- آپ روپے تک ٹیکس کی کٹوتیاں حاصل کر سکتے ہیں۔ 1,50,000
- قبل از وقت واپسی کا کوئی بندوبست نہیں ہے۔
- آپ ان ٹیکس سیور ایف ڈی کے خلاف قرض کے لیے درخواست نہیں دے سکتے
- ان ٹیکس سیور FDs میں سرمایہ کاری کسی بھی نجی یا پبلک سیکٹر کے بینک میں کی جا سکتی ہے (سوائے کوآپریٹو اور دیہی بینکوں کے)
- میں کی گئی سرمایہ کاریڈاک خانہ پانچ سال سے زیادہ کی مدت کے لیے ٹائم ڈپازٹ بھی ٹیکس بچانے والی FD کے طور پر اہل ہے۔
- آپ پوسٹ آفس ایف ڈی کو ایک پوسٹ آفس سے دوسرے پوسٹ آفس میں منتقل کر سکتے ہیں۔
- اس قسم کی FD سے حاصل ہونے والا سود قابل ٹیکس ہے اور اسے ذریعہ سے کاٹا جائے گا۔
- ٹیکس سیونگ ڈپازٹ اکاؤنٹ انفرادی اور مشترکہ طور پر کھولا جا سکتا ہے۔
- مشترکہ اکاؤنٹ کی صورت میں، ٹیکس کا فائدہ مشترکہ اکاؤنٹ کے پہلے ہولڈر کو حاصل ہوگا۔
Talk to our investment specialist
ELSS بمقابلہ FD - موازنہ
مختلف پیرامیٹرز پر ELSS اور ٹیکس سیونگ FDs کے درمیان فرق کا ایک سرسری جائزہ یہ ہے:
| پیرامیٹر | ایف ڈی | ای ایل ایس ایس |
|---|---|---|
| دور | 5 سال کا لاک ان | 3 سال کا لاک ان |
| واپسی | 7.00 - 8.00 % (سالانہ مرکب) | کوئی یقینی ڈیویڈنڈ نہیں / اس کے طور پر واپسیمارکیٹ عام طور پر 16 - 17٪ سالانہ کے ارد گرد منسلک |
| کم از کم سرمایہ کاری | روپے 1000 | روپے 500 |
| زیادہ سے زیادہ سرمایہ کاری | کوئی بالائی حد نہیں۔ | کوئی بالائی حد نہیں۔ |
| 80c کے تحت کٹوتی کے لیے اہل رقم | روپے 1.5 لاکھ | روپے 1.5 لاکھ |
| سود/واپسی کے لیے ٹیکس | قابل ٹیکس سود | روپے تک کا فائدہ 1 لاکھ ٹیکس سے پاک ہیں۔ روپے سے اوپر کے منافع پر 10% ٹیکس لاگو ہوتا ہے۔ 1 لاکھ |
| حفاظت/درجہ بندی | محفوظ | تھوڑا خطرہ |
| لیکویڈیٹی | آپ 5 سال سے پہلے ٹیکس بچانے والی ایف ڈی واپس نہیں لے سکتے | آپ 3 سال کے بعد ELSS سے نکل سکتے ہیں یا نکال سکتے ہیں۔ |
| آن لائن آپشن | تمام بینک آن لائن پیش نہیں کرتے ہیں۔سہولت ایف ڈی کھولنے کے لیے | کوئی ایک ELSS آن لائن شروع کر سکتا ہے – بطور یکمشت یاگھونٹ |
ٹاپ ELSS میوچل فنڈز مالی سال 22 - 23
Fund NAV Net Assets (Cr) 3 MO (%) 6 MO (%) 1 YR (%) 3 YR (%) 5 YR (%) 2025 (%) IDBI Equity Advantage Fund Growth ₹43.39
↑ 0.04 ₹485 9.7 15.1 16.9 20.8 10 Motilal Oswal Long Term Equity Fund Growth ₹54.5313
↑ 0.05 ₹4,862 3.1 16 1.6 20.5 16.4 -9.1 Baroda Pioneer ELSS 96 Growth ₹68.6676
↑ 0.33 ₹210 -6.1 -3.5 17.6 16.7 11.6 JM Tax Gain Fund Growth ₹50.0254
↓ -0.18 ₹232 6.7 7.2 2.6 14.8 14.1 2.5 BNP Paribas Long Term Equity Fund (ELSS) Growth ₹97.9053
↓ -0.28 ₹897 2.5 2.4 1.9 14.6 11.8 4.8 Note: Returns up to 1 year are on absolute basis & more than 1 year are on CAGR basis. as on 28 Jul 23 Research Highlights & Commentary of 5 Funds showcased
Commentary IDBI Equity Advantage Fund Motilal Oswal Long Term Equity Fund Baroda Pioneer ELSS 96 JM Tax Gain Fund BNP Paribas Long Term Equity Fund (ELSS) Point 1 Lower mid AUM (₹485 Cr). Highest AUM (₹4,862 Cr). Bottom quartile AUM (₹210 Cr). Bottom quartile AUM (₹232 Cr). Upper mid AUM (₹897 Cr). Point 2 Established history (12+ yrs). Established history (11+ yrs). Established history (11+ yrs). Established history (18+ yrs). Oldest track record among peers (20 yrs). Point 3 Top rated. Not Rated. Not Rated. Rating: 3★ (upper mid). Rating: 3★ (lower mid). Point 4 Risk profile: Moderately High. Risk profile: Moderately High. Risk profile: Moderately High. Risk profile: Moderately High. Risk profile: Moderately High. Point 5 5Y return: 9.97% (bottom quartile). 5Y return: 16.39% (top quartile). 5Y return: 11.62% (bottom quartile). 5Y return: 14.14% (upper mid). 5Y return: 11.84% (lower mid). Point 6 3Y return: 20.84% (top quartile). 3Y return: 20.49% (upper mid). 3Y return: 16.70% (lower mid). 3Y return: 14.80% (bottom quartile). 3Y return: 14.61% (bottom quartile). Point 7 1Y return: 16.92% (upper mid). 1Y return: 1.60% (bottom quartile). 1Y return: 17.56% (top quartile). 1Y return: 2.61% (lower mid). 1Y return: 1.90% (bottom quartile). Point 8 Alpha: 1.78 (bottom quartile). Alpha: 6.27 (top quartile). Alpha: 5.69 (upper mid). Alpha: 4.31 (lower mid). Alpha: 2.78 (bottom quartile). Point 9 Sharpe: 1.21 (upper mid). Sharpe: 0.02 (lower mid). Sharpe: 2.51 (top quartile). Sharpe: -0.11 (bottom quartile). Sharpe: -0.15 (bottom quartile). Point 10 Information ratio: -1.13 (bottom quartile). Information ratio: 0.76 (top quartile). Information ratio: -0.09 (bottom quartile). Information ratio: 0.50 (lower mid). Information ratio: 0.58 (upper mid). IDBI Equity Advantage Fund
Motilal Oswal Long Term Equity Fund
Baroda Pioneer ELSS 96
JM Tax Gain Fund
BNP Paribas Long Term Equity Fund (ELSS)
*ذیل میں 100 - 15000 کروڑ کے درمیان AUM رکھنے والے فنڈز کی فہرست ہے اور فنڈ کی عمر 3 سال سے اوپر ہے۔ 3 سالہ کارکردگی کی بنیاد پر۔ The Scheme will seek to invest predominantly in a diversified portfolio of equity and equity related instruments with the objective to provide investors with opportunities for capital appreciation and income along with the benefit of income-tax deduction(under section 80C of the Income-tax Act, 1961) on their investments. Investments in this scheme would be subject to a statutory lock-in of 3 years from the date of allotment to be eligible for income-tax benefits under Section 80C. There can be no assurance that the investment objective under the scheme will be realized. Below is the key information for IDBI Equity Advantage Fund Returns up to 1 year are on (Erstwhile Motilal Oswal MOSt Focused Long Term Fund) The investment objective of the Scheme is to generate long-term capital appreciation from a diversified portfolio of predominantly equity and equity related instruments. However, there can be no assurance or guarantee that the investment objective of the Scheme would be achieved. Research Highlights for Motilal Oswal Long Term Equity Fund Below is the key information for Motilal Oswal Long Term Equity Fund Returns up to 1 year are on The main objective of the scheme is to provide the investor long term capital growth as also tax benefit under section 80C of the Income Tax Act, 1961. Research Highlights for Baroda Pioneer ELSS 96 Below is the key information for Baroda Pioneer ELSS 96 Returns up to 1 year are on The investment objective is to generate long-term capital growth from a diversified and actively managed portfolio of equity and equity related securities and to enable investors a deduction from total income, as permitted under the Income Tax Act, 1961 from time to time. However, there can be no assurance that the investment objectives of the Scheme will be realized. The Scheme does not guarantee/indicate any returns. Research Highlights for JM Tax Gain Fund Below is the key information for JM Tax Gain Fund Returns up to 1 year are on The investment objective of the Scheme is to generate long-term capital growth from a diversified and actively managed portfolio of equity and equity related securities along with income tax rebate, as may be prevalent fromtime to time. However, there can be no assurance that the investment objective of the Scheme will be achieved. The Scheme does not guarantee / indicate any returns. Research Highlights for BNP Paribas Long Term Equity Fund (ELSS) Below is the key information for BNP Paribas Long Term Equity Fund (ELSS) Returns up to 1 year are on 1. IDBI Equity Advantage Fund
IDBI Equity Advantage Fund
Growth Launch Date 10 Sep 13 NAV (28 Jul 23) ₹43.39 ↑ 0.04 (0.09 %) Net Assets (Cr) ₹485 on 30 Jun 23 Category Equity - ELSS AMC IDBI Asset Management Limited Rating ☆☆☆ Risk Moderately High Expense Ratio 2.39 Sharpe Ratio 1.21 Information Ratio -1.13 Alpha Ratio 1.78 Min Investment 500 Min SIP Investment 500 Exit Load NIL Growth of 10,000 investment over the years.
Date Value 30 Jun 21 ₹10,000 30 Jun 22 ₹9,909 30 Jun 23 ₹12,418 Returns for IDBI Equity Advantage Fund
absolute basis & more than 1 year are on CAGR (Compound Annual Growth Rate) basis. as on 28 Jul 23 Duration Returns 1 Month 3.1% 3 Month 9.7% 6 Month 15.1% 1 Year 16.9% 3 Year 20.8% 5 Year 10% 10 Year 15 Year Since launch 16% Historical performance (Yearly) on absolute basis
Year Returns 2025 2024 2023 2022 2021 2020 2019 2018 2017 2016 Fund Manager information for IDBI Equity Advantage Fund
Name Since Tenure Data below for IDBI Equity Advantage Fund as on 30 Jun 23
Equity Sector Allocation
Sector Value Asset Allocation
Asset Class Value Top Securities Holdings / Portfolio
Name Holding Value Quantity 2. Motilal Oswal Long Term Equity Fund
Motilal Oswal Long Term Equity Fund
Growth Launch Date 21 Jan 15 NAV (24 Jul 26) ₹54.5313 ↑ 0.05 (0.09 %) Net Assets (Cr) ₹4,862 on 30 Jun 26 Category Equity - ELSS AMC Motilal Oswal Asset Management Co. Ltd Rating Risk Moderately High Expense Ratio 1.65 Sharpe Ratio 0.02 Information Ratio 0.76 Alpha Ratio 6.27 Min Investment 500 Min SIP Investment 500 Exit Load NIL Growth of 10,000 investment over the years.
Date Value 30 Jun 21 ₹10,000 30 Jun 22 ₹9,362 30 Jun 23 ₹12,562 30 Jun 24 ₹19,819 30 Jun 25 ₹21,898 30 Jun 26 ₹22,806 Returns for Motilal Oswal Long Term Equity Fund
absolute basis & more than 1 year are on CAGR (Compound Annual Growth Rate) basis. as on 28 Jul 23 Duration Returns 1 Month -1.6% 3 Month 3.1% 6 Month 16% 1 Year 1.6% 3 Year 20.5% 5 Year 16.4% 10 Year 15 Year Since launch 15.9% Historical performance (Yearly) on absolute basis
Year Returns 2025 -9.1% 2024 47.7% 2023 37% 2022 1.8% 2021 32.1% 2020 8.8% 2019 13.2% 2018 -8.7% 2017 44% 2016 12.5% Fund Manager information for Motilal Oswal Long Term Equity Fund
Name Since Tenure Ajay Khandelwal 11 Dec 23 2.55 Yr. Ankit Agarwal 16 Mar 26 0.29 Yr. Rakesh Shetty 22 Nov 22 3.61 Yr. Atul Mehra 1 Oct 24 1.75 Yr. Data below for Motilal Oswal Long Term Equity Fund as on 30 Jun 26
Equity Sector Allocation
Sector Value Financial Services 25.8% Industrials 23.55% Consumer Cyclical 16.57% Basic Materials 13.61% Technology 13.23% Health Care 4.78% Asset Allocation
Asset Class Value Cash 2.46% Equity 97.54% Top Securities Holdings / Portfolio
Name Holding Value Quantity Multi Commodity Exchange of India Ltd (Financial Services)
Equity, Since 29 Feb 24 | MCX7% ₹337 Cr 1,140,862
↓ -55,178 OneSource Specialty Pharma Ltd (Healthcare)
Equity, Since 31 Jan 25 | ONESOURCE5% ₹223 Cr 1,221,228 Zen Technologies Ltd (Industrials)
Equity, Since 31 Dec 24 | ZENTEC4% ₹203 Cr 1,218,528 Muthoot Finance Ltd (Financial Services)
Equity, Since 30 Jun 25 | MUTHOOTFIN4% ₹197 Cr 588,318
↑ 41,444 Ather Energy Ltd (Consumer Cyclical)
Equity, Since 31 Oct 25 | ATHERENERG4% ₹192 Cr 1,990,789
↓ -310,680 Waaree Energies Ltd (Technology)
Equity, Since 31 Oct 24 | WAAREEENER4% ₹188 Cr 600,000
↓ -27,718 Jain Resource Recycling Ltd (Basic Materials)
Equity, Since 31 Oct 25 | JAINREC4% ₹187 Cr 5,000,000
↓ -11,074 PTC Industries Ltd (Industrials)
Equity, Since 30 Sep 24 | 5390064% ₹186 Cr 115,181 Suzlon Energy Ltd (Industrials)
Equity, Since 31 Jan 24 | SUZLON4% ₹185 Cr 32,483,092 Apar Industries Ltd (Industrials)
Equity, Since 31 Dec 23 | APARINDS4% ₹176 Cr 134,000
↓ -48,754 3. Baroda Pioneer ELSS 96
Baroda Pioneer ELSS 96
Growth Launch Date 2 Mar 15 NAV (11 Mar 22) ₹68.6676 ↑ 0.33 (0.48 %) Net Assets (Cr) ₹210 on 31 Jan 22 Category Equity - ELSS AMC Baroda Pioneer Asset Management Co. Ltd. Rating Risk Moderately High Expense Ratio 2.55 Sharpe Ratio 2.51 Information Ratio -0.09 Alpha Ratio 5.69 Min Investment 500 Min SIP Investment 500 Exit Load NIL Growth of 10,000 investment over the years.
Date Value 30 Jun 21 ₹10,000 Returns for Baroda Pioneer ELSS 96
absolute basis & more than 1 year are on CAGR (Compound Annual Growth Rate) basis. as on 28 Jul 23 Duration Returns 1 Month -3.9% 3 Month -6.1% 6 Month -3.5% 1 Year 17.6% 3 Year 16.7% 5 Year 11.6% 10 Year 15 Year Since launch 8.4% Historical performance (Yearly) on absolute basis
Year Returns 2025 2024 2023 2022 2021 2020 2019 2018 2017 2016 Fund Manager information for Baroda Pioneer ELSS 96
Name Since Tenure Data below for Baroda Pioneer ELSS 96 as on 31 Jan 22
Equity Sector Allocation
Sector Value Asset Allocation
Asset Class Value Top Securities Holdings / Portfolio
Name Holding Value Quantity 4. JM Tax Gain Fund
JM Tax Gain Fund
Growth Launch Date 31 Mar 08 NAV (24 Jul 26) ₹50.0254 ↓ -0.18 (-0.35 %) Net Assets (Cr) ₹232 on 30 Jun 26 Category Equity - ELSS AMC JM Financial Asset Management Limited Rating ☆☆☆ Risk Moderately High Expense Ratio 2.37 Sharpe Ratio -0.11 Information Ratio 0.5 Alpha Ratio 4.31 Min Investment 500 Min SIP Investment 500 Exit Load NIL Growth of 10,000 investment over the years.
Date Value 30 Jun 21 ₹10,000 30 Jun 22 ₹9,919 30 Jun 23 ₹12,968 30 Jun 24 ₹19,302 30 Jun 25 ₹19,540 30 Jun 26 ₹19,895 Returns for JM Tax Gain Fund
absolute basis & more than 1 year are on CAGR (Compound Annual Growth Rate) basis. as on 28 Jul 23 Duration Returns 1 Month 0.4% 3 Month 6.7% 6 Month 7.2% 1 Year 2.6% 3 Year 14.8% 5 Year 14.1% 10 Year 15 Year Since launch 9.2% Historical performance (Yearly) on absolute basis
Year Returns 2025 2.5% 2024 29% 2023 30.9% 2022 0.5% 2021 32.2% 2020 18.3% 2019 14.9% 2018 -4.6% 2017 42.6% 2016 5.2% Fund Manager information for JM Tax Gain Fund
Name Since Tenure Satish Ramanathan 1 Oct 24 1.75 Yr. Asit Bhandarkar 31 Dec 21 4.5 Yr. Ruchi Fozdar 4 Oct 24 1.74 Yr. Deepak Gupta 11 Apr 25 1.22 Yr. Data below for JM Tax Gain Fund as on 30 Jun 26
Equity Sector Allocation
Sector Value Financial Services 27.9% Consumer Cyclical 17.25% Technology 11.32% Industrials 9.8% Basic Materials 8.63% Health Care 6.75% Consumer Defensive 3.63% Real Estate 3.5% Energy 3.16% Utility 2.72% Communication Services 2.7% Asset Allocation
Asset Class Value Cash 2.63% Equity 97.37% Top Securities Holdings / Portfolio
Name Holding Value Quantity HDFC Bank Ltd (Financial Services)
Equity, Since 31 Dec 11 | HDFCBANK3% ₹7 Cr 98,262 Reliance Industries Ltd (Energy)
Equity, Since 30 Jun 25 | RELIANCE3% ₹7 Cr 53,400 Syrma SGS Technology Ltd (Technology)
Equity, Since 31 May 25 | SYRMA3% ₹6 Cr 59,457 ICICI Bank Ltd (Financial Services)
Equity, Since 31 Mar 22 | ICICIBANK3% ₹6 Cr 48,500 Larsen & Toubro Ltd (Industrials)
Equity, Since 30 Nov 10 | LT3% ₹6 Cr 14,947 Adani Power Ltd (Utilities)
Equity, Since 31 Mar 26 | ADANIPOWER3% ₹6 Cr 249,000 Bharti Airtel Ltd (Communication Services)
Equity, Since 31 Mar 24 | BHARTIARTL3% ₹6 Cr 32,950 Karur Vysya Bank Ltd (Financial Services)
Equity, Since 30 Apr 25 | KARURVYSYA3% ₹6 Cr 199,000 Lupin Ltd (Healthcare)
Equity, Since 31 May 25 | LUPIN3% ₹6 Cr 25,000 Polycab India Ltd (Industrials)
Equity, Since 31 Jul 25 | POLYCAB3% ₹6 Cr 5,900 5. BNP Paribas Long Term Equity Fund (ELSS)
BNP Paribas Long Term Equity Fund (ELSS)
Growth Launch Date 5 Jan 06 NAV (24 Jul 26) ₹97.9053 ↓ -0.28 (-0.29 %) Net Assets (Cr) ₹897 on 30 Jun 26 Category Equity - ELSS AMC BNP Paribas Asset Mgmt India Pvt. Ltd Rating ☆☆☆ Risk Moderately High Expense Ratio 2.21 Sharpe Ratio -0.15 Information Ratio 0.58 Alpha Ratio 2.78 Min Investment 500 Min SIP Investment 500 Exit Load NIL Growth of 10,000 investment over the years.
Date Value 30 Jun 21 ₹10,000 30 Jun 22 ₹9,480 30 Jun 23 ₹11,609 30 Jun 24 ₹16,494 30 Jun 25 ₹17,507 30 Jun 26 ₹17,827 Returns for BNP Paribas Long Term Equity Fund (ELSS)
absolute basis & more than 1 year are on CAGR (Compound Annual Growth Rate) basis. as on 28 Jul 23 Duration Returns 1 Month -0.2% 3 Month 2.5% 6 Month 2.4% 1 Year 1.9% 3 Year 14.6% 5 Year 11.8% 10 Year 15 Year Since launch 11.7% Historical performance (Yearly) on absolute basis
Year Returns 2025 4.8% 2024 23.6% 2023 31.3% 2022 -2.1% 2021 23.6% 2020 17.8% 2019 14.3% 2018 -9.3% 2017 42.3% 2016 -6.6% Fund Manager information for BNP Paribas Long Term Equity Fund (ELSS)
Name Since Tenure Sanjay Chawla 14 Mar 22 4.3 Yr. Yash Mehta 1 May 26 0.16 Yr. Data below for BNP Paribas Long Term Equity Fund (ELSS) as on 30 Jun 26
Equity Sector Allocation
Sector Value Financial Services 28.78% Industrials 15.65% Consumer Cyclical 14.19% Basic Materials 8.98% Technology 7.08% Health Care 6.37% Energy 5.79% Consumer Defensive 4.17% Communication Services 3.01% Utility 1.38% Asset Allocation
Asset Class Value Cash 4.57% Equity 95.4% Top Securities Holdings / Portfolio
Name Holding Value Quantity HDFC Bank Ltd (Financial Services)
Equity, Since 31 Oct 08 | HDFCBANK5% ₹41 Cr 550,000
↓ -106,320 Reliance Industries Ltd (Energy)
Equity, Since 31 Oct 18 | RELIANCE4% ₹37 Cr 281,800 Hitachi Energy India Ltd Ordinary Shares (Industrials)
Equity, Since 31 Aug 23 | POWERINDIA4% ₹34 Cr 8,766 State Bank of India (Financial Services)
Equity, Since 31 Mar 22 | SBIN4% ₹32 Cr 330,000
↑ 52,000 ICICI Bank Ltd (Financial Services)
Equity, Since 31 Oct 12 | ICICIBANK4% ₹31 Cr 250,000
↓ -79,900 Bharat Heavy Electricals Ltd (Industrials)
Equity, Since 30 Nov 24 | BHEL3% ₹29 Cr 701,626
↓ -119,754 Bharti Airtel Ltd (Communication Services)
Equity, Since 31 May 19 | BHARTIARTL3% ₹27 Cr 144,966 Larsen & Toubro Ltd (Industrials)
Equity, Since 30 Apr 20 | LT3% ₹26 Cr 65,000
↑ 5,000 Hindalco Industries Ltd (Basic Materials)
Equity, Since 28 Feb 25 | HINDALCO3% ₹25 Cr 220,000 Navin Fluorine International Ltd (Basic Materials)
Equity, Since 31 Jul 24 | NAVINFLUOR3% ₹23 Cr 31,685
کیا آپ کو ELSS یا ٹیکس بچانے والی FDs میں سرمایہ کاری کرنی چاہیے؟
نئے سرمایہ کاری کرنے سے پہلے لوگ بہت سی چیزوں پر غور کرتے ہیں۔ عمر، سرمایہ کاری کا افق اورخطرے کی بھوک چند اہم عوامل ہیں. جو لوگ دولت میں اضافے اور ٹیکس کے فوائد کے دوہرے فوائد چاہتے ہیں وہ ELSS کو ترجیح دیتے ہیں۔ مثال کے طور پر، طویل سرمایہ کاری کے افق کے ساتھ نئے سرمایہ کار اور زیادہ خطرے کی بھوک ELSS کو ایک معقول آپشن سمجھتے ہیں۔ قریب آنے والے لوگریٹائرمنٹ ٹیکس بچانے والی FDs میں سرمایہ کاری کر سکتے ہیں کیونکہ ان میں کم خطرات ہوتے ہیں اور طویل مدتی (کم از کم 5 سال یا اس سے زیادہ) میں واپسی کی ضمانت ہوتی ہے۔
ELSS آن لائن میں کیسے سرمایہ کاری کی جائے؟
Fincash.com پر لائف ٹائم کے لیے مفت انویسٹمنٹ اکاؤنٹ کھولیں۔
اپنی رجسٹریشن اور KYC کا عمل مکمل کریں۔
دستاویزات اپ لوڈ کریں (PAN، آدھار، وغیرہ)۔اور، آپ سرمایہ کاری کے لیے تیار ہیں!
یہاں فراہم کردہ معلومات کے درست ہونے کو یقینی بنانے کے لیے تمام کوششیں کی گئی ہیں۔ تاہم، ڈیٹا کی درستگی کے حوالے سے کوئی ضمانت نہیں دی جاتی ہے۔ براہ کرم کوئی بھی سرمایہ کاری کرنے سے پہلے اسکیم کی معلومات کے دستاویز کے ساتھ تصدیق کریں۔


AMFI Registration No. 112358 | CIN: U74999MH2016PTC282153
Shepard Technologies Pvt. Ltd. (with ARN code 112358) makes no warranties or representations, express or implied, on products offered through the platform. It accepts no liability for any damages or losses, however caused, in connection with the use of, or on the reliance of its product or related services. Terms and conditions of the website are applicable.
©2026 Shepard Technologies Private Limited. All Rights Reserved
Research Highlights for IDBI Equity Advantage Fund