Best Financial Mutual Funds 2026
A financial Mutual Funds are a part of sector Equity Funds. These funds are also known as ‘Banking & Financial Services Fund’. The aim of these funds is to generate income by Investing in stocks/shares of companies that cater to the banking sector and financial industry. So, let’s understand the future potential of financial funds, along with the best financial mutual funds to invest.
Talk to our investment specialist
Financial Mutual Funds in India
If we look at the July 2017 data released by SEBI, banking and sector funds were the most favored ones. The data shows that Bank and finance- the two leading sectors has shown a sharp surge in share AUM.
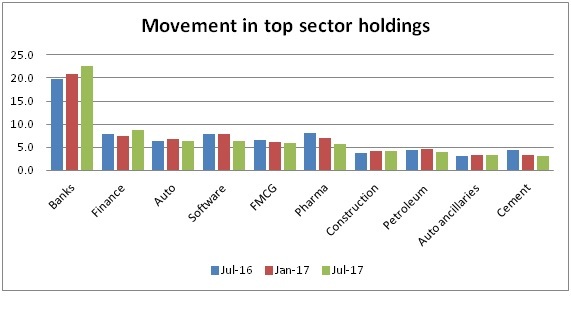
As per the Jul’17 statistics, the AUM of the banking sector, which is the leading sector, has moved from 20.9 percent to 22.6 percent in just six months.
How to Invest in Financial Mutual Funds Online?
Open Free Investment Account for Lifetime at Fincash.com.
Complete your Registration and KYC Process
Upload Documents (PAN, Aadhaar, etc.). And, You are Ready to Invest!
Fund Selection Methodology used to find 5 funds
Top Performing Best Financial Mutual Funds FY 26 - 27
Fund NAV Net Assets (Cr) 3 MO (%) 6 MO (%) 1 YR (%) 3 YR (%) 5 YR (%) 2025 (%) Aditya Birla Sun Life Banking And Financial Services Fund Growth ₹62.25
↓ -0.13 ₹3,676 0 -0.2 1 10 11.2 17.5 ICICI Prudential Banking and Financial Services Fund Growth ₹129.6
↓ -0.27 ₹11,034 0.3 -3.2 -4.2 8.8 9.4 15.9 Invesco India Financial Services Fund Growth ₹145.82
↓ -0.17 ₹1,811 2 2.6 4 16.4 14.2 15.1 Sundaram Financial Services Opportunities Fund Growth ₹106.746
↓ -0.16 ₹1,681 0.3 -1.6 1.5 12 13.6 16.9 UTI Banking and Financial Services Fund Growth ₹193.43
↓ -0.47 ₹1,430 1.7 -0.9 0.5 11.2 11.7 16.3 Note: Returns up to 1 year are on absolute basis & more than 1 year are on CAGR basis. as on 24 Jul 26 Research Highlights & Commentary of 5 Funds showcased
Commentary Aditya Birla Sun Life Banking And Financial Services Fund ICICI Prudential Banking and Financial Services Fund Invesco India Financial Services Fund Sundaram Financial Services Opportunities Fund UTI Banking and Financial Services Fund Point 1 Upper mid AUM (₹3,676 Cr). Highest AUM (₹11,034 Cr). Lower mid AUM (₹1,811 Cr). Bottom quartile AUM (₹1,681 Cr). Bottom quartile AUM (₹1,430 Cr). Point 2 Established history (12+ yrs). Established history (17+ yrs). Established history (18+ yrs). Established history (18+ yrs). Oldest track record among peers (22 yrs). Point 3 Top rated. Rating: 5★ (upper mid). Rating: 4★ (lower mid). Rating: 3★ (bottom quartile). Rating: 3★ (bottom quartile). Point 4 Risk profile: High. Risk profile: High. Risk profile: High. Risk profile: High. Risk profile: High. Point 5 5Y return: 11.19% (bottom quartile). 5Y return: 9.41% (bottom quartile). 5Y return: 14.16% (top quartile). 5Y return: 13.59% (upper mid). 5Y return: 11.67% (lower mid). Point 6 3Y return: 10.01% (bottom quartile). 3Y return: 8.77% (bottom quartile). 3Y return: 16.38% (top quartile). 3Y return: 12.01% (upper mid). 3Y return: 11.17% (lower mid). Point 7 1Y return: 0.96% (lower mid). 1Y return: -4.21% (bottom quartile). 1Y return: 3.96% (top quartile). 1Y return: 1.52% (upper mid). 1Y return: 0.53% (bottom quartile). Point 8 Alpha: 3.47 (lower mid). Alpha: -2.76 (bottom quartile). Alpha: 4.90 (top quartile). Alpha: 3.51 (upper mid). Alpha: 1.61 (bottom quartile). Point 9 Sharpe: -0.06 (upper mid). Sharpe: -0.36 (bottom quartile). Sharpe: 0.03 (top quartile). Sharpe: -0.07 (lower mid). Sharpe: -0.14 (bottom quartile). Point 10 Information ratio: 0.24 (bottom quartile). Information ratio: -0.10 (bottom quartile). Information ratio: 0.95 (top quartile). Information ratio: 0.51 (upper mid). Information ratio: 0.35 (lower mid). Aditya Birla Sun Life Banking And Financial Services Fund
ICICI Prudential Banking and Financial Services Fund
Invesco India Financial Services Fund
Sundaram Financial Services Opportunities Fund
UTI Banking and Financial Services Fund
When we speak about the banking and finance sector of India, we have many major players like ICICI Bank Ltd, HDFC Bank Ltd, State Bank of India, Yes Bank Ltd, Axis Bank Ltd, etc. The Indian banking system consists of 26 private sector banks, 27 public sector banks, 1,574 urban cooperative banks, 56 regional rural banks, 46 foreign banks and 93,913 rural cooperative banks in addition to cooperative credit institutions.
Companies that operate within the banking and financial industry are highly regulated. Many good companies aim to deliver consistent performance and returns over the years, as a result, it brings in confidence for investors who are planning to invest in sector funds. However, one should always keep in mind the risk factors of such funds. These funds, sometime, can be at two extremes, they can deliver good returns and can sometimes perform badly too. Therefore, it is advisable that investors who are planning to invest in such sector funds should have a high-risk appetite and also should stay invested for a longer duration. Ideally, one should invest in such funds for diversification purpose.
The primary investment objective of the Scheme is to generate long-term capital appreciation to unit holders from a portfolio that is invested predominantly in equity and equity related securities of companies engaged in banking and financial services. The Scheme does not guarantee/indicate any returns. There can be no assurance that the schemes’ objectives will be achieved. Below is the key information for Aditya Birla Sun Life Banking And Financial Services Fund Returns up to 1 year are on ICICI Prudential Banking and Financial Services Fund is an Open-ended equity scheme that seeks to generate long-term capital appreciation to unitholders from a portfolio that is invested predominantly in equity and equity related securities of companies engaged in banking and financial services. However, there can be no assurance that the investment objective of the Scheme will be realized. Research Highlights for ICICI Prudential Banking and Financial Services Fund Below is the key information for ICICI Prudential Banking and Financial Services Fund Returns up to 1 year are on (Erstwhile Invesco India Banking Fund) The investment objective of the Scheme is to generate long-term capital growth from a portfolio of equity and equity-related securities of companies engaged in the business of banking and financial services. Research Highlights for Invesco India Financial Services Fund Below is the key information for Invesco India Financial Services Fund Returns up to 1 year are on Seek capital appreciation by investing predominantly in equity and equity related securities of indian companies engaged in banking and financial Services. Research Highlights for Sundaram Financial Services Opportunities Fund Below is the key information for Sundaram Financial Services Opportunities Fund Returns up to 1 year are on (Erstwhile UTI Banking Sector Fund) Investment objective is "capital appreciation" through investments in the stocks of the companies/institutions engaged in the banking and financial services activities. Research Highlights for UTI Banking and Financial Services Fund Below is the key information for UTI Banking and Financial Services Fund Returns up to 1 year are on 1. Aditya Birla Sun Life Banking And Financial Services Fund
Aditya Birla Sun Life Banking And Financial Services Fund
Growth Launch Date 14 Dec 13 NAV (24 Jul 26) ₹62.25 ↓ -0.13 (-0.21 %) Net Assets (Cr) ₹3,676 on 30 Jun 26 Category Equity - Sectoral AMC Birla Sun Life Asset Management Co Ltd Rating ☆☆☆☆☆ Risk High Expense Ratio 1.99 Sharpe Ratio -0.06 Information Ratio 0.24 Alpha Ratio 3.47 Min Investment 1,000 Min SIP Investment 1,000 Exit Load 0-365 Days (1%),365 Days and above(NIL) Growth of 10,000 investment over the years.
Date Value 30 Jun 21 ₹10,000 30 Jun 22 ₹9,160 30 Jun 23 ₹12,518 30 Jun 24 ₹15,626 30 Jun 25 ₹17,373 30 Jun 26 ₹17,691 Returns for Aditya Birla Sun Life Banking And Financial Services Fund
absolute basis & more than 1 year are on CAGR (Compound Annual Growth Rate) basis. as on 24 Jul 26 Duration Returns 1 Month -2.1% 3 Month 0% 6 Month -0.2% 1 Year 1% 3 Year 10% 5 Year 11.2% 10 Year 15 Year Since launch 15.6% Historical performance (Yearly) on absolute basis
Year Returns 2025 17.5% 2024 8.7% 2023 21.7% 2022 11.5% 2021 16.8% 2020 1.1% 2019 14.9% 2018 -2.4% 2017 47.6% 2016 15.7% Fund Manager information for Aditya Birla Sun Life Banking And Financial Services Fund
Name Since Tenure Dhaval Gala 26 Aug 15 10.85 Yr. Data below for Aditya Birla Sun Life Banking And Financial Services Fund as on 30 Jun 26
Equity Sector Allocation
Sector Value Financial Services 95.86% Technology 1.2% Asset Allocation
Asset Class Value Cash 2.2% Equity 97.8% Top Securities Holdings / Portfolio
Name Holding Value Quantity ICICI Bank Ltd (Financial Services)
Equity, Since 31 Dec 13 | ICICIBANK13% ₹467 Cr 3,717,929 HDFC Bank Ltd (Financial Services)
Equity, Since 31 Dec 13 | HDFCBANK11% ₹377 Cr 5,058,496
↓ -350,000 Axis Bank Ltd (Financial Services)
Equity, Since 31 Oct 18 | AXISBANK9% ₹296 Cr 2,302,100 Bajaj Finance Ltd (Financial Services)
Equity, Since 30 Sep 16 | BAJFINANCE6% ₹194 Cr 2,137,250 State Bank of India (Financial Services)
Equity, Since 31 Oct 17 | SBIN5% ₹185 Cr 1,918,689 Shriram Finance Ltd (Financial Services)
Equity, Since 30 Jun 23 | SHRIRAMFIN5% ₹179 Cr 1,886,669 Kotak Mahindra Bank Ltd (Financial Services)
Equity, Since 31 Jan 19 | KOTAKBANK4% ₹129 Cr 3,346,665
↓ -200,000 AU Small Finance Bank Ltd (Financial Services)
Equity, Since 30 Nov 23 | AUBANK3% ₹103 Cr 1,046,861
↓ -300,000 Bank of Maharashtra (Financial Services)
Equity, Since 31 Dec 25 | MAHABANK3% ₹99 Cr 12,546,499 SBI Life Insurance Co Ltd (Financial Services)
Equity, Since 31 Mar 21 | SBILIFE3% ₹98 Cr 533,402 2. ICICI Prudential Banking and Financial Services Fund
ICICI Prudential Banking and Financial Services Fund
Growth Launch Date 22 Aug 08 NAV (24 Jul 26) ₹129.6 ↓ -0.27 (-0.21 %) Net Assets (Cr) ₹11,034 on 30 Jun 26 Category Equity - Sectoral AMC ICICI Prudential Asset Management Company Limited Rating ☆☆☆☆☆ Risk High Expense Ratio 1.83 Sharpe Ratio -0.36 Information Ratio -0.1 Alpha Ratio -2.76 Min Investment 5,000 Min SIP Investment 100 Exit Load 0-1 Years (1%),1 Years and above(NIL) Growth of 10,000 investment over the years.
Date Value 30 Jun 21 ₹10,000 30 Jun 22 ₹9,325 30 Jun 23 ₹12,216 30 Jun 24 ₹14,832 30 Jun 25 ₹17,040 30 Jun 26 ₹16,453 Returns for ICICI Prudential Banking and Financial Services Fund
absolute basis & more than 1 year are on CAGR (Compound Annual Growth Rate) basis. as on 24 Jul 26 Duration Returns 1 Month -2.3% 3 Month 0.3% 6 Month -3.2% 1 Year -4.2% 3 Year 8.8% 5 Year 9.4% 10 Year 15 Year Since launch 15.4% Historical performance (Yearly) on absolute basis
Year Returns 2025 15.9% 2024 11.6% 2023 17.9% 2022 11.9% 2021 23.5% 2020 -5.5% 2019 14.5% 2018 -0.4% 2017 45.1% 2016 21.1% Fund Manager information for ICICI Prudential Banking and Financial Services Fund
Name Since Tenure Sharmila D'Silva 30 Jun 22 4 Yr. Antariksha Banerjee 2 Mar 26 0.33 Yr. Data below for ICICI Prudential Banking and Financial Services Fund as on 30 Jun 26
Equity Sector Allocation
Sector Value Financial Services 93.69% Health Care 1% Industrials 0.29% Asset Allocation
Asset Class Value Cash 5.03% Equity 94.97% Top Securities Holdings / Portfolio
Name Holding Value Quantity HDFC Bank Ltd (Financial Services)
Equity, Since 31 Oct 08 | HDFCBANK13% ₹1,418 Cr 19,039,031 ICICI Bank Ltd (Financial Services)
Equity, Since 31 Oct 08 | ICICIBANK13% ₹1,379 Cr 10,972,843
↓ -121,800 Axis Bank Ltd (Financial Services)
Equity, Since 28 Feb 19 | AXISBANK9% ₹932 Cr 7,244,304
↓ -724,375 Kotak Mahindra Bank Ltd (Financial Services)
Equity, Since 31 Jan 23 | KOTAKBANK7% ₹768 Cr 20,001,898
↑ 3,244,512 State Bank of India (Financial Services)
Equity, Since 31 Oct 08 | SBIN6% ₹626 Cr 6,489,068
↑ 2,023,723 SBI Life Insurance Co Ltd (Financial Services)
Equity, Since 30 Sep 17 | SBILIFE4% ₹402 Cr 2,198,381
↓ -86,625 LIC Housing Finance Ltd (Financial Services)
Equity, Since 30 Nov 24 | LICHSGFIN3% ₹363 Cr 6,799,870 SBI Cards and Payment Services Ltd Ordinary Shares (Financial Services)
Equity, Since 30 Nov 25 | SBICARD3% ₹359 Cr 5,751,671
↑ 526,400 ICICI Lombard General Insurance Co Ltd (Financial Services)
Equity, Since 30 Sep 19 | ICICIGI3% ₹319 Cr 1,782,062 HDB Financial Services Ltd (Financial Services)
Equity, Since 30 Nov 25 | HDBFS2% ₹250 Cr 3,761,615
↓ -75,438 3. Invesco India Financial Services Fund
Invesco India Financial Services Fund
Growth Launch Date 14 Jul 08 NAV (24 Jul 26) ₹145.82 ↓ -0.17 (-0.12 %) Net Assets (Cr) ₹1,811 on 30 Jun 26 Category Equity - Sectoral AMC Invesco Asset Management (India) Private Ltd Rating ☆☆☆☆ Risk High Expense Ratio 2.23 Sharpe Ratio 0.03 Information Ratio 0.95 Alpha Ratio 4.9 Min Investment 5,000 Min SIP Investment 100 Exit Load 0-1 Years (1%),1 Years and above(NIL) Growth of 10,000 investment over the years.
Date Value 30 Jun 21 ₹10,000 30 Jun 22 ₹9,102 30 Jun 23 ₹12,326 30 Jun 24 ₹16,683 30 Jun 25 ₹19,433 30 Jun 26 ₹20,269 Returns for Invesco India Financial Services Fund
absolute basis & more than 1 year are on CAGR (Compound Annual Growth Rate) basis. as on 24 Jul 26 Duration Returns 1 Month -1.5% 3 Month 2% 6 Month 2.6% 1 Year 4% 3 Year 16.4% 5 Year 14.2% 10 Year 15 Year Since launch 16% Historical performance (Yearly) on absolute basis
Year Returns 2025 15.1% 2024 19.8% 2023 26% 2022 12.8% 2021 14% 2020 2.4% 2019 21.2% 2018 -0.3% 2017 45.2% 2016 10.4% Fund Manager information for Invesco India Financial Services Fund
Name Since Tenure Hiten Jain 19 May 20 6.12 Yr. Haresh Kapoor 1 Jan 26 0.49 Yr. Data below for Invesco India Financial Services Fund as on 30 Jun 26
Equity Sector Allocation
Sector Value Financial Services 95.68% Technology 3.18% Asset Allocation
Asset Class Value Cash 1.14% Equity 98.86% Top Securities Holdings / Portfolio
Name Holding Value Quantity ICICI Bank Ltd (Financial Services)
Equity, Since 31 Oct 09 | ICICIBANK13% ₹218 Cr 1,738,628
↑ 60,107 HDFC Bank Ltd (Financial Services)
Equity, Since 31 Jul 08 | HDFCBANK13% ₹216 Cr 2,900,056 Axis Bank Ltd (Financial Services)
Equity, Since 31 May 18 | AXISBANK8% ₹129 Cr 1,005,744 ICICI Prudential Asset Management Co Ltd (Financial Services)
Equity, Since 31 Dec 25 | ICICIAMC5% ₹85 Cr 240,125 BSE Ltd (Financial Services)
Equity, Since 30 Sep 23 | BSE5% ₹82 Cr 197,854 Karur Vysya Bank Ltd (Financial Services)
Equity, Since 30 Sep 22 | KARURVYSYA5% ₹77 Cr 2,663,923 Multi Commodity Exchange of India Ltd (Financial Services)
Equity, Since 28 Feb 22 | MCX4% ₹74 Cr 251,091 Shriram Finance Ltd (Financial Services)
Equity, Since 28 Feb 25 | SHRIRAMFIN4% ₹69 Cr 731,682 Nuvama Wealth Management Ltd (Financial Services)
Equity, Since 30 Sep 25 | 5439883% ₹58 Cr 373,787 Cholamandalam Investment and Finance Co Ltd (Financial Services)
Equity, Since 31 Jul 17 | CHOLAFIN3% ₹53 Cr 347,691 4. Sundaram Financial Services Opportunities Fund
Sundaram Financial Services Opportunities Fund
Growth Launch Date 10 Jun 08 NAV (24 Jul 26) ₹106.746 ↓ -0.16 (-0.15 %) Net Assets (Cr) ₹1,681 on 30 Jun 26 Category Equity - Sectoral AMC Sundaram Asset Management Company Ltd Rating ☆☆☆ Risk High Expense Ratio 2.12 Sharpe Ratio -0.07 Information Ratio 0.51 Alpha Ratio 3.51 Min Investment 100,000 Min SIP Investment 100 Exit Load 0-12 Months (1%),12 Months and above(NIL) Growth of 10,000 investment over the years.
Date Value 30 Jun 21 ₹10,000 30 Jun 22 ₹9,429 30 Jun 23 ₹13,139 30 Jun 24 ₹17,744 30 Jun 25 ₹19,203 30 Jun 26 ₹19,462 Returns for Sundaram Financial Services Opportunities Fund
absolute basis & more than 1 year are on CAGR (Compound Annual Growth Rate) basis. as on 24 Jul 26 Duration Returns 1 Month -1.9% 3 Month 0.3% 6 Month -1.6% 1 Year 1.5% 3 Year 12% 5 Year 13.6% 10 Year 15 Year Since launch 14% Historical performance (Yearly) on absolute basis
Year Returns 2025 16.9% 2024 7.1% 2023 31.1% 2022 16.8% 2021 15.3% 2020 2.7% 2019 26.4% 2018 -3.7% 2017 33.3% 2016 12.8% Fund Manager information for Sundaram Financial Services Opportunities Fund
Name Since Tenure Rohit Seksaria 30 Dec 17 8.5 Yr. Shalav Saket 28 Feb 26 0.33 Yr. Data below for Sundaram Financial Services Opportunities Fund as on 30 Jun 26
Equity Sector Allocation
Sector Value Financial Services 95.47% Technology 1.8% Asset Allocation
Asset Class Value Cash 1.6% Equity 97.27% Debt 1.13% Other 0% Top Securities Holdings / Portfolio
Name Holding Value Quantity HDFC Bank Ltd (Financial Services)
Equity, Since 31 Dec 08 | HDFCBANK15% ₹232 Cr 3,114,256 ICICI Bank Ltd (Financial Services)
Equity, Since 30 Jun 10 | ICICIBANK11% ₹178 Cr 1,416,021 Axis Bank Ltd (Financial Services)
Equity, Since 28 Feb 10 | AXISBANK10% ₹157 Cr 1,217,541 State Bank of India (Financial Services)
Equity, Since 31 Dec 08 | SBIN6% ₹97 Cr 1,003,469 Bajaj Finserv Ltd (Financial Services)
Equity, Since 31 Mar 25 | BAJAJFINSV5% ₹76 Cr 424,621 DCB Bank Ltd (Financial Services)
Equity, Since 30 Sep 24 | DCBBANK4% ₹66 Cr 3,778,314 PNB Housing Finance Ltd (Financial Services)
Equity, Since 31 Jul 24 | PNBHOUSING4% ₹65 Cr 631,329 Shriram Finance Ltd (Financial Services)
Equity, Since 30 Sep 23 | SHRIRAMFIN4% ₹64 Cr 672,583 Bank of Baroda (Financial Services)
Equity, Since 29 Feb 24 | BANKBARODA4% ₹59 Cr 2,208,626 Cholamandalam Financial Holdings Ltd (Financial Services)
Equity, Since 31 Aug 22 | CHOLAHLDNG3% ₹53 Cr 334,660 5. UTI Banking and Financial Services Fund
UTI Banking and Financial Services Fund
Growth Launch Date 7 Apr 04 NAV (24 Jul 26) ₹193.43 ↓ -0.47 (-0.24 %) Net Assets (Cr) ₹1,430 on 30 Jun 26 Category Equity - Sectoral AMC UTI Asset Management Company Ltd Rating ☆☆☆ Risk High Expense Ratio 2.2 Sharpe Ratio -0.14 Information Ratio 0.35 Alpha Ratio 1.61 Min Investment 5,000 Min SIP Investment 500 Exit Load 0-1 Years (1%),1 Years and above(NIL) Growth of 10,000 investment over the years.
Date Value 30 Jun 21 ₹10,000 30 Jun 22 ₹9,250 30 Jun 23 ₹12,451 30 Jun 24 ₹15,480 30 Jun 25 ₹17,779 30 Jun 26 ₹17,849 Returns for UTI Banking and Financial Services Fund
absolute basis & more than 1 year are on CAGR (Compound Annual Growth Rate) basis. as on 24 Jul 26 Duration Returns 1 Month -1.8% 3 Month 1.7% 6 Month -0.9% 1 Year 0.5% 3 Year 11.2% 5 Year 11.7% 10 Year 15 Year Since launch 14.2% Historical performance (Yearly) on absolute basis
Year Returns 2025 16.3% 2024 11.1% 2023 19.5% 2022 15.1% 2021 14.3% 2020 -5.3% 2019 11.6% 2018 -6.8% 2017 43.5% 2016 13% Fund Manager information for UTI Banking and Financial Services Fund
Name Since Tenure Amit Premchandani 16 Jun 25 1.04 Yr. Bhavesh Kanani 12 Jan 26 0.47 Yr. Data below for UTI Banking and Financial Services Fund as on 30 Jun 26
Equity Sector Allocation
Sector Value Financial Services 96.26% Technology 1.58% Asset Allocation
Asset Class Value Cash 2.16% Equity 97.84% Top Securities Holdings / Portfolio
Name Holding Value Quantity HDFC Bank Ltd (Financial Services)
Equity, Since 31 Mar 09 | HDFCBANK17% ₹229 Cr 3,075,000
↑ 200,000 ICICI Bank Ltd (Financial Services)
Equity, Since 30 Apr 04 | ICICIBANK13% ₹175 Cr 1,395,000 State Bank of India (Financial Services)
Equity, Since 28 Feb 18 | SBIN9% ₹120 Cr 1,248,490
↑ 648,490 Axis Bank Ltd (Financial Services)
Equity, Since 30 Jun 18 | AXISBANK8% ₹106 Cr 820,000 Bajaj Finance Ltd (Financial Services)
Equity, Since 30 Nov 19 | BAJFINANCE8% ₹103 Cr 1,135,000 Kotak Mahindra Bank Ltd (Financial Services)
Equity, Since 30 Sep 18 | KOTAKBANK7% ₹98 Cr 2,550,000
↓ -700,000 Shriram Finance Ltd (Financial Services)
Equity, Since 31 Jan 24 | SHRIRAMFIN5% ₹73 Cr 767,975
↑ 55,000 SBI Life Insurance Co Ltd (Financial Services)
Equity, Since 28 Feb 25 | SBILIFE4% ₹51 Cr 277,000 Bajaj Finserv Ltd (Financial Services)
Equity, Since 31 Aug 24 | BAJAJFINSV3% ₹44 Cr 246,000 Ujjivan Small Finance Bank Ltd Ordinary Shares (Financial Services)
Equity, Since 30 Apr 25 | 5429043% ₹37 Cr 6,884,317
↑ 350,000
All efforts have been made to ensure the information provided here is accurate. However, no guarantees are made regarding correctness of data. Please verify with scheme information document before making any investment.
You Might Also Like


AMFI Registration No. 112358 | CIN: U74999MH2016PTC282153
Shepard Technologies Pvt. Ltd. (with ARN code 112358) makes no warranties or representations, express or implied, on products offered through the platform. It accepts no liability for any damages or losses, however caused, in connection with the use of, or on the reliance of its product or related services. Terms and conditions of the website are applicable.
©2026 Shepard Technologies Private Limited. All Rights Reserved
Research Highlights for Aditya Birla Sun Life Banking And Financial Services Fund