Lumpsum Calculator
Lumpsum calculator helps investors to check how their lumpsum investment grows over a given timeframe. In lumpsum mode of investment, people invest a considerable amount as a one-time down payment in the scheme. Whenever, we talk about Mutual Fund Investment, the first thing that rings on our mind is, “How much amount do we need to invest?” Though there are many questions related to expected returns, risk-appetite, the investment tenure, and so on yet; the first thought that always rings our ears is the investment amount.
So, let us see how the lumpsum calculator helps to assess the growth of one-time investment in Mutual Funds.
Lumpsum Calculator Illustration
Calculate the returns on your lumpsum investment with the help of the following data.
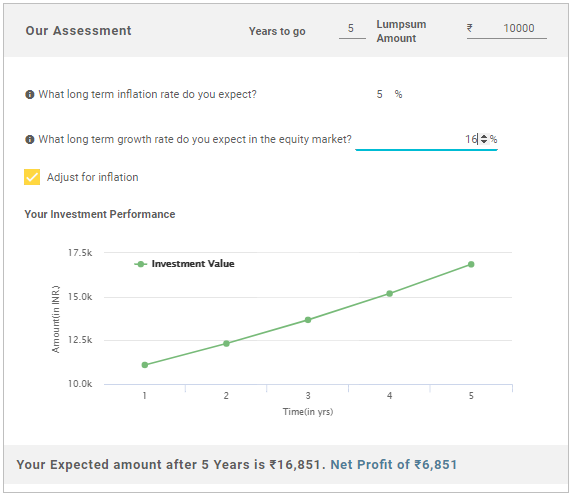
Investment Tenure: 5 Years
Lumpsum Investment Amount: ₹10,000
Long-term Inflation (%): 5 (approx.)
Long-term Returns (%): 16 (approx.)
Expected Returns as per Lumpsum Calculator: ₹6,851
Total Amount After 5 Years: ₹16,851
Talk to our investment specialist
Fund Selection Methodology used to find 10 funds
Top 10 Performing Mutual Funds in 2018 for Lumpsum Investment
Fund NAV Net Assets (Cr) Min Investment 3 MO (%) 6 MO (%) 1 YR (%) 3 YR (%) 5 YR (%) 2024 (%) Sundaram Rural and Consumption Fund Growth ₹91.6366
↓ -0.31 ₹1,422 5,000 3.4 0.8 -6.6 9.3 10.9 -0.1 Franklin Asian Equity Fund Growth ₹43.322
↓ -0.98 ₹979 5,000 7.6 14.9 35.6 19.2 6.9 23.7 Franklin Build India Fund Growth ₹142.088
↓ -0.63 ₹3,256 5,000 -3.2 4.3 -0.6 18.6 19.2 3.7 DSP Natural Resources and New Energy Fund Growth ₹105.996
↓ -0.62 ₹2,401 1,000 -4.2 4.3 16.4 19.6 15.8 17.5 DSP Equity Opportunities Fund Growth ₹612.978
↓ -0.40 ₹17,906 1,000 0.7 -1.3 -1 14.6 12.2 7.1 DSP US Flexible Equity Fund Growth ₹92.839
↓ -1.09 ₹1,291 1,000 7.5 16.8 44.5 26.4 18 33.8 Bandhan Infrastructure Fund Growth ₹49.265
↑ 0.05 ₹1,545 5,000 2 11.4 -3.6 17.6 16.7 -6.9 Tata India Tax Savings Fund Growth ₹45.8208
↓ -0.18 ₹4,597 500 2.5 4.5 3 11.9 12.6 4.9 Aditya Birla Sun Life Banking And Financial Services Fund Growth ₹62.25
↓ -0.13 ₹3,676 1,000 0 -0.2 1 10 11.2 17.5 Aditya Birla Sun Life Small Cap Fund Growth ₹94.7343
↓ -0.19 ₹5,731 1,000 8.4 19.8 7.5 15.1 12.4 -3.7 Note: Returns up to 1 year are on absolute basis & more than 1 year are on CAGR basis. as on 24 Jul 26 Research Highlights & Commentary of 10 Funds showcased
Commentary Sundaram Rural and Consumption Fund Franklin Asian Equity Fund Franklin Build India Fund DSP Natural Resources and New Energy Fund DSP Equity Opportunities Fund DSP US Flexible Equity Fund Bandhan Infrastructure Fund Tata India Tax Savings Fund Aditya Birla Sun Life Banking And Financial Services Fund Aditya Birla Sun Life Small Cap Fund Point 1 Bottom quartile AUM (₹1,422 Cr). Bottom quartile AUM (₹979 Cr). Upper mid AUM (₹3,256 Cr). Lower mid AUM (₹2,401 Cr). Highest AUM (₹17,906 Cr). Bottom quartile AUM (₹1,291 Cr). Lower mid AUM (₹1,545 Cr). Upper mid AUM (₹4,597 Cr). Upper mid AUM (₹3,676 Cr). Top quartile AUM (₹5,731 Cr). Point 2 Established history (20+ yrs). Established history (18+ yrs). Established history (16+ yrs). Established history (18+ yrs). Oldest track record among peers (26 yrs). Established history (13+ yrs). Established history (15+ yrs). Established history (11+ yrs). Established history (12+ yrs). Established history (19+ yrs). Point 3 Top rated. Rating: 5★ (top quartile). Rating: 5★ (upper mid). Rating: 5★ (upper mid). Rating: 5★ (upper mid). Rating: 5★ (lower mid). Rating: 5★ (lower mid). Rating: 5★ (bottom quartile). Rating: 5★ (bottom quartile). Rating: 5★ (bottom quartile). Point 4 Risk profile: Moderately High. Risk profile: High. Risk profile: High. Risk profile: High. Risk profile: Moderately High. Risk profile: High. Risk profile: High. Risk profile: Moderately High. Risk profile: High. Risk profile: Moderately High. Point 5 5Y return: 10.92% (bottom quartile). 5Y return: 6.85% (bottom quartile). 5Y return: 19.15% (top quartile). 5Y return: 15.80% (upper mid). 5Y return: 12.17% (lower mid). 5Y return: 17.97% (top quartile). 5Y return: 16.66% (upper mid). 5Y return: 12.63% (upper mid). 5Y return: 11.19% (bottom quartile). 5Y return: 12.35% (lower mid). Point 6 3Y return: 9.34% (bottom quartile). 3Y return: 19.19% (upper mid). 3Y return: 18.60% (upper mid). 3Y return: 19.57% (top quartile). 3Y return: 14.63% (lower mid). 3Y return: 26.40% (top quartile). 3Y return: 17.65% (upper mid). 3Y return: 11.94% (bottom quartile). 3Y return: 10.01% (bottom quartile). 3Y return: 15.10% (lower mid). Point 7 1Y return: -6.61% (bottom quartile). 1Y return: 35.62% (top quartile). 1Y return: -0.58% (lower mid). 1Y return: 16.35% (upper mid). 1Y return: -0.99% (bottom quartile). 1Y return: 44.48% (top quartile). 1Y return: -3.64% (bottom quartile). 1Y return: 3.02% (upper mid). 1Y return: 0.96% (lower mid). 1Y return: 7.53% (upper mid). Point 8 Alpha: -6.29 (bottom quartile). Alpha: 0.00 (upper mid). Alpha: 0.00 (upper mid). Alpha: 0.00 (upper mid). Alpha: -2.56 (bottom quartile). Alpha: -4.10 (bottom quartile). Alpha: 0.00 (lower mid). Alpha: 4.23 (top quartile). Alpha: 3.47 (top quartile). Alpha: 0.00 (lower mid). Point 9 Sharpe: -0.67 (bottom quartile). Sharpe: 1.54 (top quartile). Sharpe: -0.04 (upper mid). Sharpe: 0.72 (upper mid). Sharpe: -0.35 (bottom quartile). Sharpe: 1.93 (top quartile). Sharpe: -0.25 (bottom quartile). Sharpe: -0.09 (lower mid). Sharpe: -0.06 (lower mid). Sharpe: 0.22 (upper mid). Point 10 Information ratio: -0.56 (bottom quartile). Information ratio: 0.00 (upper mid). Information ratio: 0.00 (lower mid). Information ratio: 0.00 (lower mid). Information ratio: 0.20 (upper mid). Information ratio: 0.15 (upper mid). Information ratio: 0.00 (bottom quartile). Information ratio: 0.22 (top quartile). Information ratio: 0.24 (top quartile). Information ratio: 0.00 (bottom quartile). Sundaram Rural and Consumption Fund
Franklin Asian Equity Fund
Franklin Build India Fund
DSP Natural Resources and New Energy Fund
DSP Equity Opportunities Fund
DSP US Flexible Equity Fund
Bandhan Infrastructure Fund
Tata India Tax Savings Fund
Aditya Birla Sun Life Banking And Financial Services Fund
Aditya Birla Sun Life Small Cap Fund
Understanding Lumpsum Calculator
Individuals who are new to investment, find it difficult to understand the concept of lumpsum calculator and its functioning. Therefore, to ease out the complexities, the detailed information about the calculation is given. Go through this information to understand the process. The input data that needs to be fed in the lumpsum calculator includes:
- The tenure of lumpsum investment
- The amount of money is being invested through lumpsum mode
- Expected rate of returns in the long-term from equity markets
- Expected annual inflation rate
How does it Works?
Any investment objective always requires an effective planning. Though people may select the best schemes based on its past performance and other related factors however; it is with the help of this lumpsum calculator that helps the people to decide on how their investment grows virtually over a time period. As mentioned previously, the input elements of this calculator includes tenure of investment, amount invested, and others. So, let us see how the calculation works with the example given below.
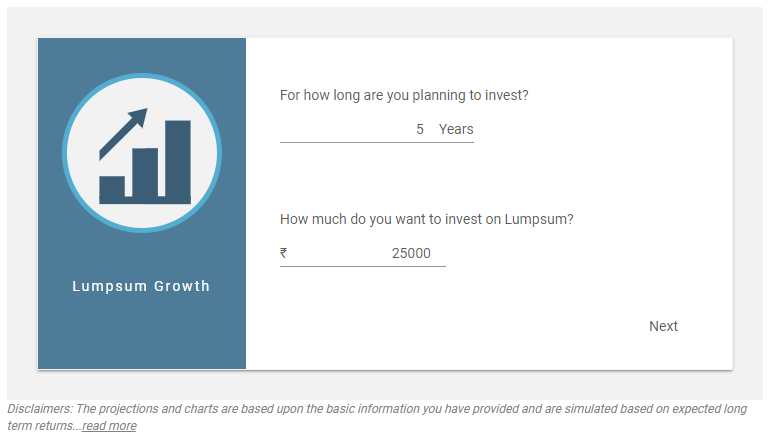
Lumpsum Investment Amount: ₹25,000
Investment Period: 5 Years
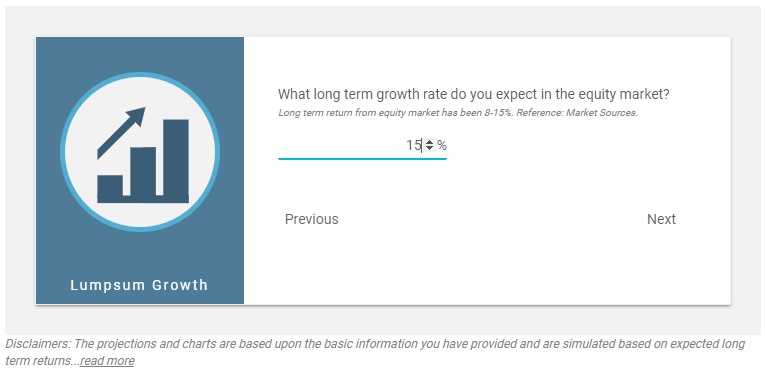
Expected Returns (%) (Approx.): 15
Expected Inflation (%) (Approx.): 5
1. Enter Your Lumpsum Investment Amount and Investment Tenure
This is the first question you need to ask, that how much amount do I need to invest so that I can attain my objective. Along with the same, also specify the tenure of investment. So, with the help of amount mentioned about of ₹25,000 and tenure of 5 years, the image is given below as follows. Here, after entering the investment amount and tenure, you need to click on Next Button which is at the bottom of the screen as shown in the image.
2. Enter Expected Long-term Growth on Your Investment
This is the second question you need to answer. Here, you need to enter the expected rate of returns on the lumpsum investment. For example, let’s assume the rate of returns in this case to be 15%. The image for the same is listed below as follows. After, entering the expected rate of returns, you need to click on Next Button which is as shown in the given below.
3. Adjust for Inflation
Once you enter the percentage of returns expected, and click next, then you get the result. Here, you need to select the box near Adjust for Inflation and enter the long-term inflation rate. In our example, we have taken the inflation rate to be 5%. Once you enter the inflation rate then; you the investment value. The image for this step is as follows.
4. End Result
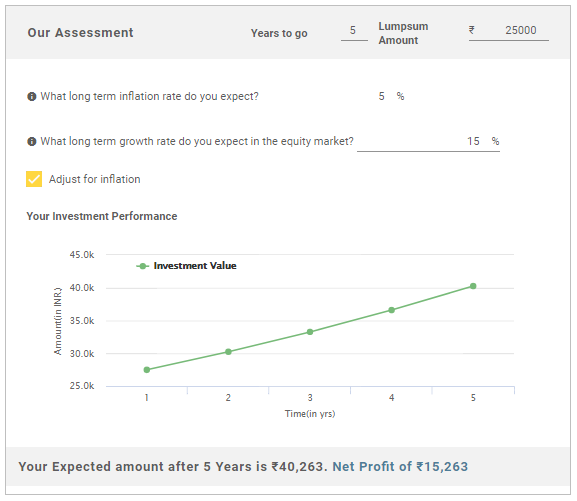
Therefore, we can conclude that, at the end of fifth year, the net profit on the investment is ₹15,263 and the total investment value is ₹40,263.
Thus, from the above mentioned steps, we can see that it is simple to use the Fincash Lumpsum calculator.
In case of further queries, feel free to contact our customer care department.
Top Funds for 2026
*Best funds based on 3 year performance.
"The primary investment objective of the Scheme is to seek capital appreciation by investing predominantly in units of MLIIF - WGF. The Scheme may, at the discretion of the Investment Manager, also invest in the units of other similar overseas mutual fund schemes, which may constitute a significant part of its corpus. The Scheme may also invest a certain portion of its corpus in money market securities and/or units of money market/liquid schemes of DSP Merrill Lynch Mutual Fund, in order to meet liquidity requirements from time to time. However, there is no assurance that the investment objective of the Scheme will be realized." Below is the key information for DSP World Gold Fund Returns up to 1 year are on The primary investment objective of the Scheme is to seek capital appreciation by investing predominantly in units of BGF – USFEF. The Scheme may, at the discretion of the Investment Manager also invest in the units of other similar overseas mutual fund schemes, which may constitute a significant part of its corpus. The Scheme may also invest a certain portion of its corpus in money market securities and/or money market/liquid schemes of DSP BlackRock Mutual Fund, in order to meet liquidity requirements from time to time. However, there is no assurance that the investment objective of the Scheme will be realized. It shall be noted ‘similar overseas mutual fund schemes’ shall have investment objective, investment strategy and risk profile/consideration similar to those of BGF – USFEF. Research Highlights for DSP US Flexible Equity Fund Below is the key information for DSP US Flexible Equity Fund Returns up to 1 year are on The primary investment objective of the Scheme is to seek to provide long term capital growth by investing predominantly in the JPMorgan Funds - Emerging Markets Opportunities Fund, an equity fund which invests primarily in an aggressively managed portfolio of emerging market companies Research Highlights for Edelweiss Emerging Markets Opportunities Equity Off-shore Fund Below is the key information for Edelweiss Emerging Markets Opportunities Equity Off-shore Fund Returns up to 1 year are on 1. DSP World Gold Fund
DSP World Gold Fund
Growth Launch Date 14 Sep 07 NAV (23 Jul 26) ₹50.1271 ↓ -1.40 (-2.72 %) Net Assets (Cr) ₹1,433 on 30 Jun 26 Category Equity - Global AMC DSP BlackRock Invmt Managers Pvt. Ltd. Rating ☆☆☆ Risk High Expense Ratio 1.41 Sharpe Ratio 1.22 Information Ratio -0.5 Alpha Ratio 2.12 Min Investment 1,000 Min SIP Investment 500 Exit Load 0-12 Months (1%),12 Months and above(NIL) Growth of 10,000 investment over the years.
Date Value 30 Jun 21 ₹10,000 30 Jun 22 ₹8,181 30 Jun 23 ₹9,294 30 Jun 24 ₹10,640 30 Jun 25 ₹16,808 30 Jun 26 ₹27,693 Returns for DSP World Gold Fund
absolute basis & more than 1 year are on CAGR (Compound Annual Growth Rate) basis. as on 23 Jul 26 Duration Returns 1 Month -5.9% 3 Month -16.7% 6 Month -23.5% 1 Year 57.5% 3 Year 42.3% 5 Year 23.2% 10 Year 15 Year Since launch 8.9% Historical performance (Yearly) on absolute basis
Year Returns 2024 167.1% 2023 15.9% 2022 7% 2021 -7.7% 2020 -9% 2019 31.4% 2018 35.1% 2017 -10.7% 2016 -4% 2015 52.7% Fund Manager information for DSP World Gold Fund
Name Since Tenure Kaivalya Nadkarni 1 May 25 1.17 Yr. Data below for DSP World Gold Fund as on 30 Jun 26
Equity Sector Allocation
Sector Value Basic Materials 94.47% Asset Allocation
Asset Class Value Cash 3.62% Equity 94.47% Debt 0% Other 1.91% Top Securities Holdings / Portfolio
Name Holding Value Quantity BGF World Gold I2
Investment Fund | -68% ₹1,141 Cr 1,005,044 VanEck Gold Miners ETF
- | GDX29% ₹490 Cr 573,719 Treps / Reverse Repo Investments
CBLO/Reverse Repo | -3% ₹54 Cr Net Receivables/Payables
Net Current Assets | -0% -₹6 Cr 2. DSP US Flexible Equity Fund
DSP US Flexible Equity Fund
Growth Launch Date 3 Aug 12 NAV (23 Jul 26) ₹92.839 ↓ -1.09 (-1.16 %) Net Assets (Cr) ₹1,291 on 30 Jun 26 Category Equity - Global AMC DSP BlackRock Invmt Managers Pvt. Ltd. Rating ☆☆☆☆☆ Risk High Expense Ratio 1.55 Sharpe Ratio 1.93 Information Ratio 0.15 Alpha Ratio -4.1 Min Investment 1,000 Min SIP Investment 500 Exit Load 0-12 Months (1%),12 Months and above(NIL) Growth of 10,000 investment over the years.
Date Value 30 Jun 21 ₹10,000 30 Jun 22 ₹9,273 30 Jun 23 ₹11,265 30 Jun 24 ₹13,557 30 Jun 25 ₹15,785 30 Jun 26 ₹23,371 Returns for DSP US Flexible Equity Fund
absolute basis & more than 1 year are on CAGR (Compound Annual Growth Rate) basis. as on 23 Jul 26 Duration Returns 1 Month -1.3% 3 Month 7.5% 6 Month 16.8% 1 Year 44.5% 3 Year 26.4% 5 Year 18% 10 Year 15 Year Since launch 17.3% Historical performance (Yearly) on absolute basis
Year Returns 2024 33.8% 2023 17.8% 2022 22% 2021 -5.9% 2020 24.2% 2019 22.6% 2018 27.5% 2017 -1.1% 2016 15.5% 2015 9.8% Fund Manager information for DSP US Flexible Equity Fund
Name Since Tenure Kaivalya Nadkarni 1 May 25 1.17 Yr. Data below for DSP US Flexible Equity Fund as on 30 Jun 26
Equity Sector Allocation
Sector Value Technology 33.05% Industrials 13.62% Financial Services 12.17% Communication Services 12.05% Consumer Cyclical 9.62% Health Care 7.65% Basic Materials 2.45% Energy 2.43% Asset Allocation
Asset Class Value Cash 6.96% Equity 93.02% Debt 0.01% Top Securities Holdings / Portfolio
Name Holding Value Quantity BGF US Flexible Equity I2
Investment Fund | -96% ₹1,265 Cr 1,784,131
↓ -32,921 Treps / Reverse Repo Investments
CBLO/Reverse Repo | -4% ₹59 Cr Net Receivables/Payables
Net Current Assets | -0% -₹2 Cr 3. Edelweiss Emerging Markets Opportunities Equity Off-shore Fund
Edelweiss Emerging Markets Opportunities Equity Off-shore Fund
Growth Launch Date 7 Jul 14 NAV (23 Jul 26) ₹28.3172 ↑ 0.23 (0.82 %) Net Assets (Cr) ₹259 on 30 Jun 26 Category Equity - Global AMC Edelweiss Asset Management Limited Rating ☆☆☆ Risk High Expense Ratio 1.04 Sharpe Ratio 2.2 Information Ratio -0.41 Alpha Ratio 6.3 Min Investment 5,000 Min SIP Investment 1,000 Exit Load 0-1 Years (1%),1 Years and above(NIL) Growth of 10,000 investment over the years.
Date Value 30 Jun 21 ₹10,000 30 Jun 22 ₹7,234 30 Jun 23 ₹7,605 30 Jun 24 ₹8,447 30 Jun 25 ₹9,445 30 Jun 26 ₹15,783 Returns for Edelweiss Emerging Markets Opportunities Equity Off-shore Fund
absolute basis & more than 1 year are on CAGR (Compound Annual Growth Rate) basis. as on 23 Jul 26 Duration Returns 1 Month -1.3% 3 Month 8.3% 6 Month 22.5% 1 Year 59.7% 3 Year 26.2% 5 Year 10.3% 10 Year 15 Year Since launch 9% Historical performance (Yearly) on absolute basis
Year Returns 2024 41.1% 2023 5.9% 2022 5.5% 2021 -16.8% 2020 -5.9% 2019 21.7% 2018 25.1% 2017 -7.2% 2016 30% 2015 9.8% Fund Manager information for Edelweiss Emerging Markets Opportunities Equity Off-shore Fund
Name Since Tenure Bhavesh Jain 9 Apr 18 8.23 Yr. Bharat Lahoti 1 Oct 21 4.75 Yr. Data below for Edelweiss Emerging Markets Opportunities Equity Off-shore Fund as on 30 Jun 26
Equity Sector Allocation
Sector Value Technology 35.88% Financial Services 20.6% Consumer Cyclical 10.01% Communication Services 7.79% Industrials 5.82% Energy 5.13% Basic Materials 2.8% Consumer Defensive 1.98% Utility 1.27% Health Care 0.52% Asset Allocation
Asset Class Value Cash 6.04% Equity 93.14% Debt 0.01% Other 0.49% Top Securities Holdings / Portfolio
Name Holding Value Quantity JPM Emerging Mkts Opps I acc USD
Investment Fund | -96% ₹241 Cr 102,137
↑ 3,897 Clearing Corporation Of India Ltd.
CBLO/Reverse Repo | -4% ₹10 Cr Net Receivables/(Payables)
CBLO | -0% -₹1 Cr Accrued Interest
CBLO | -0% ₹0 Cr
All efforts have been made to ensure the information provided here is accurate. However, no guarantees are made regarding correctness of data. Please verify with scheme information document before making any investment.


AMFI Registration No. 112358 | CIN: U74999MH2016PTC282153
Shepard Technologies Pvt. Ltd. (with ARN code 112358) makes no warranties or representations, express or implied, on products offered through the platform. It accepts no liability for any damages or losses, however caused, in connection with the use of, or on the reliance of its product or related services. Terms and conditions of the website are applicable.
©2026 Shepard Technologies Private Limited. All Rights Reserved
Research Highlights for DSP World Gold Fund