CAGR Calculator
What is CAGR?
CAGR refers to the mean annual growth of an investment over a specific time duration. It is assumed that the value of investment is compounded over the duration. Unlike absolute return, CAGR takes time value of money into account. As a result, it is able to reflect the true returns of an investment generated over a year.
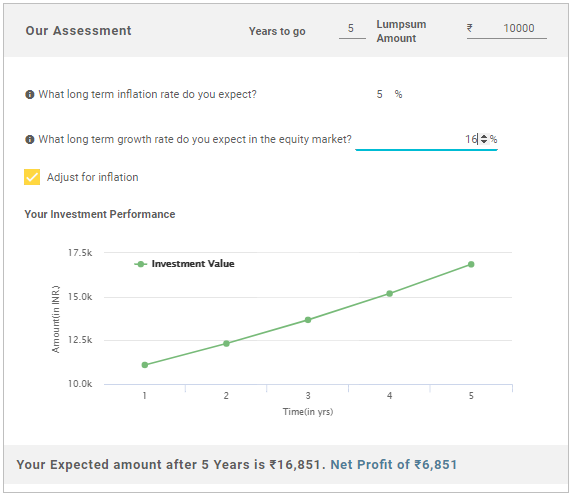
CAGR (Compound Annual Growth Rate) 20.11% CAGR Calculator
How To Use CAGR Calculator
Where can you use CAGR calculators CAGR is an easy to use tool to analyse your investment decisions. It finds application in the following scenarios:
- You bought some specific units in Equity Funds this year and your fund value increased. With the help of CAGR calculator, you would be able to know the rate of return on your investment
- You want to start Investing and have some specific goals. With the CAGR calculator, you will get to know at what rate you have to grow your money within the time frame
- Consider you have invested in an equity fund whose 3,5, and 10-year returns are 25%, 15% and 10% respectively. You want to know the average rate at which your fund grew annually
- To compare the CAGR of an investment with your expected rate and check for the suitability. Invest only if the CAGR is greater than or equal to your expected rate of return
- CAGR of a Mutual Fund can be compared with a benchmark return
CAGR Formula
The CAGR can be calculated using the mathematical formula
CAGR = [ (Ending value/Beginning Value)^(1/N) ] -1
The above formula depends on three variables. Namely, the beginning value, ending value and Number of years (N)
When you input the above three variables, the CAGR calculator would give you the rate of return on investment.
Talk to our investment specialist
Limitations of CAGR
Even though CAGR is a useful concept, it has a lot of limitations. A lack of awareness of these limitations would lead to bad investment decisions. Some of the limitations are:
In calculations related to CAGR, it’s only the beginning and end values. It assumes that the growth is constant over the duration of time and fails to consider the Volatility aspect
It is suitable only for a lump sum investment. As in case of a SIP investment, the systematic investment at various intervals wouldn’t be considered as only the beginning value is considered while calculating the CAGR
CAGR does not account for the risk inherent in an investment. When it comes to equity investment, risk-adjusted returns are more important than CAGR. For these purposes, you need to consider better ratios like Sharpe ratio
Fund Selection Methodology used to find 3 funds
Top Funds with best 3 year CAGR
"The primary investment objective of the Scheme is to seek capital appreciation by investing predominantly in units of MLIIF - WGF. The Scheme may, at the discretion of the Investment Manager, also invest in the units of other similar overseas mutual fund schemes, which may constitute a significant part of its corpus. The Scheme may also invest a certain portion of its corpus in money market securities and/or units of money market/liquid schemes of DSP Merrill Lynch Mutual Fund, in order to meet liquidity requirements from time to time. However, there is no assurance that the investment objective of the Scheme will be realized." Below is the key information for DSP World Gold Fund Returns up to 1 year are on The scheme seeks to provide returns that closely correspond to returns provided by SBI - ETF Gold (Previously known as SBI GETS). Research Highlights for SBI Gold Fund Below is the key information for SBI Gold Fund Returns up to 1 year are on ICICI Prudential Regular Gold Savings Fund (the Scheme) is a fund of funds scheme with the primary objective to generate returns by investing in units of ICICI Prudential Gold Exchange Traded Fund (IPru Gold ETF).
However, there can be no assurance that the investment objectives of the Scheme will be realized. Research Highlights for ICICI Prudential Regular Gold Savings Fund Below is the key information for ICICI Prudential Regular Gold Savings Fund Returns up to 1 year are on 1. DSP World Gold Fund
DSP World Gold Fund
Growth Launch Date 14 Sep 07 NAV (03 Feb 26) ₹59.9338 ↑ 1.72 (2.95 %) Net Assets (Cr) ₹1,756 on 31 Dec 25 Category Equity - Global AMC DSP BlackRock Invmt Managers Pvt. Ltd. Rating ☆☆☆ Risk High Expense Ratio 1.41 Sharpe Ratio 3.42 Information Ratio -0.67 Alpha Ratio 1.32 Min Investment 1,000 Min SIP Investment 500 Exit Load 0-12 Months (1%),12 Months and above(NIL) Growth of 10,000 investment over the years.
Date Value 31 Jan 21 ₹10,000 31 Jan 22 ₹8,807 31 Jan 23 ₹9,422 31 Jan 24 ₹8,517 31 Jan 25 ₹12,548 31 Jan 26 ₹33,170 Returns for DSP World Gold Fund
absolute basis & more than 1 year are on CAGR (Compound Annual Growth Rate) basis. as on 3 Feb 26 Duration Returns 1 Month 13.6% 3 Month 40.2% 6 Month 94.3% 1 Year 155.6% 3 Year 51.3% 5 Year 26.6% 10 Year 15 Year Since launch 10.2% Historical performance (Yearly) on absolute basis
Year Returns 2024 167.1% 2023 15.9% 2022 7% 2021 -7.7% 2020 -9% 2019 31.4% 2018 35.1% 2017 -10.7% 2016 -4% 2015 52.7% Fund Manager information for DSP World Gold Fund
Name Since Tenure Jay Kothari 1 Mar 13 12.85 Yr. Data below for DSP World Gold Fund as on 31 Dec 25
Equity Sector Allocation
Sector Value Basic Materials 94.95% Asset Allocation
Asset Class Value Cash 2.43% Equity 94.95% Debt 0.01% Other 2.6% Top Securities Holdings / Portfolio
Name Holding Value Quantity BGF World Gold I2
Investment Fund | -74% ₹1,294 Cr 1,219,254
↓ -59,731 VanEck Gold Miners ETF
- | GDX25% ₹442 Cr 573,719 Treps / Reverse Repo Investments
CBLO/Reverse Repo | -2% ₹28 Cr Net Receivables/Payables
Net Current Assets | -0% -₹8 Cr 2. SBI Gold Fund
SBI Gold Fund
Growth Launch Date 12 Sep 11 NAV (04 Feb 26) ₹45.8664 ↑ 1.80 (4.08 %) Net Assets (Cr) ₹10,775 on 31 Dec 25 Category Gold - Gold AMC SBI Funds Management Private Limited Rating ☆☆ Risk Moderately High Expense Ratio 0.3 Sharpe Ratio 4.38 Information Ratio 0 Alpha Ratio 0 Min Investment 5,000 Min SIP Investment 500 Exit Load 0-1 Years (1%),1 Years and above(NIL) Growth of 10,000 investment over the years.
Date Value 31 Jan 21 ₹10,000 31 Jan 22 ₹9,629 31 Jan 23 ₹11,359 31 Jan 24 ₹12,462 31 Jan 25 ₹16,115 31 Jan 26 ₹30,818 Returns for SBI Gold Fund
absolute basis & more than 1 year are on CAGR (Compound Annual Growth Rate) basis. as on 3 Feb 26 Duration Returns 1 Month 16.2% 3 Month 30.5% 6 Month 56.1% 1 Year 85.7% 3 Year 37.9% 5 Year 25.6% 10 Year 15 Year Since launch 11.2% Historical performance (Yearly) on absolute basis
Year Returns 2024 71.5% 2023 19.6% 2022 14.1% 2021 12.6% 2020 -5.7% 2019 27.4% 2018 22.8% 2017 6.4% 2016 3.5% 2015 10% Fund Manager information for SBI Gold Fund
Name Since Tenure Raviprakash Sharma 12 Sep 11 14.31 Yr. Data below for SBI Gold Fund as on 31 Dec 25
Asset Allocation
Asset Class Value Cash 1.25% Other 98.75% Top Securities Holdings / Portfolio
Name Holding Value Quantity SBI Gold ETF
- | -100% ₹10,805 Cr 951,342,785
↑ 86,762,195 Net Receivable / Payable
CBLO | -1% -₹125 Cr Treps
CBLO/Reverse Repo | -1% ₹94 Cr 3. ICICI Prudential Regular Gold Savings Fund
ICICI Prudential Regular Gold Savings Fund
Growth Launch Date 11 Oct 11 NAV (04 Feb 26) ₹48.4899 ↑ 1.71 (3.66 %) Net Assets (Cr) ₹4,482 on 31 Dec 25 Category Gold - Gold AMC ICICI Prudential Asset Management Company Limited Rating ☆ Risk Moderately High Expense Ratio 0.38 Sharpe Ratio 4.33 Information Ratio 0 Alpha Ratio 0 Min Investment 5,000 Min SIP Investment 100 Exit Load 0-15 Months (2%),15 Months and above(NIL) Growth of 10,000 investment over the years.
Date Value 31 Jan 21 ₹10,000 31 Jan 22 ₹9,678 31 Jan 23 ₹11,361 31 Jan 24 ₹12,399 31 Jan 25 ₹16,060 31 Jan 26 ₹31,216 Returns for ICICI Prudential Regular Gold Savings Fund
absolute basis & more than 1 year are on CAGR (Compound Annual Growth Rate) basis. as on 3 Feb 26 Duration Returns 1 Month 16.3% 3 Month 30.7% 6 Month 55.9% 1 Year 84.7% 3 Year 37.7% 5 Year 25.4% 10 Year 15 Year Since launch 11.7% Historical performance (Yearly) on absolute basis
Year Returns 2024 72% 2023 19.5% 2022 13.5% 2021 12.7% 2020 -5.4% 2019 26.6% 2018 22.7% 2017 7.4% 2016 0.8% 2015 8.9% Fund Manager information for ICICI Prudential Regular Gold Savings Fund
Name Since Tenure Manish Banthia 27 Sep 12 13.27 Yr. Nishit Patel 29 Dec 20 5.01 Yr. Ashwini Bharucha 1 Nov 25 0.17 Yr. Venus Ahuja 1 Nov 25 0.17 Yr. Data below for ICICI Prudential Regular Gold Savings Fund as on 31 Dec 25
Asset Allocation
Asset Class Value Cash 1.46% Other 98.54% Top Securities Holdings / Portfolio
Name Holding Value Quantity ICICI Pru Gold ETF
- | -100% ₹4,479 Cr 391,858,244
↑ 23,365,770 Treps
CBLO/Reverse Repo | -2% ₹73 Cr Net Current Assets
Net Current Assets | -2% -₹70 Cr
All efforts have been made to ensure the information provided here is accurate. However, no guarantees are made regarding correctness of data. Please verify with scheme information document before making any investment.


Research Highlights for DSP World Gold Fund