ELSS vs Equity Funds - Break the Confusion!
ELSS vs Equity Funds? Typically, Equity Linked Savings Scheme (ELSS) is a type of Equity Mutual Fund that offers tax benefits along with providing good market linked returns. For this reason, ELSS funds are also termed as a Tax Saving Mutual Funds. Investments upto INR 1,50,000 in ELSS Mutual Funds are liable for tax deductions from the income, as per Section 80C of the income tax Act.
Though ELSS is a type of Equity Funds, it offers various unique features that make it different from the usual equity funds. What are they? Read below to know the answer.
What are the Unique Features Offered by ELSS?
Equity Linked Savings Schemes (ELSS) have some unique features:
- 3 years lock-in period while equity funds have no lock-in period.
- Tax deduction in investments upto INR 1,50,000 under section 80C of the Income Tax(IT) Act.
- Gains up to INR 1 lakh are free of tax. Tax at 10% applies to gains above INR 1 lakh.
We have not listed the other features of ELSS since they are the same as those being offered by the other Equity Mutual Funds. The first 3 points are indeed unique to equity funds.
Talk to our investment specialist
Fund Selection Methodology used to find 8 funds
Best ELSS Funds to Invest
Fund NAV Net Assets (Cr) 3 MO (%) 6 MO (%) 1 YR (%) 3 YR (%) 5 YR (%) 2025 (%) DSP World Gold Fund Growth ₹50.3205
↑ 1.24 ₹1,679 -20.3 -15 62.3 41.3 22.3 167.1 DSP US Flexible Equity Fund Growth ₹94.3323
↑ 0.32 ₹1,323 14.8 20.9 48.9 27 18.2 33.8 UTI Healthcare Fund Growth ₹333.939
↑ 1.66 ₹1,217 17.5 19 13.6 25.8 14.6 -3.1 SBI PSU Fund Growth ₹34.4616
↑ 0.11 ₹6,594 -3.5 0.6 6.6 25.6 23.1 11.3 LIC MF Infrastructure Fund Growth ₹54.4288
↑ 0.08 ₹1,099 7.8 13.3 7.7 25.5 22.8 -3.7 Edelweiss Emerging Markets Opportunities Equity Off-shore Fund Growth ₹28.2569
↑ 0.30 ₹250 12.7 26.7 64 25.3 9.7 41.1 Invesco India Mid Cap Fund Growth ₹198.92
↑ 1.30 ₹12,397 13.2 11.9 8.6 24.9 19.7 6.3 Kotak Global Emerging Market Fund Growth ₹38.918
↑ 0.33 ₹1,793 11.3 19.6 52.3 23.9 10.6 39.1 Note: Returns up to 1 year are on absolute basis & more than 1 year are on CAGR basis. as on 14 Jul 26 Research Highlights & Commentary of 8 Funds showcased
Commentary DSP World Gold Fund DSP US Flexible Equity Fund UTI Healthcare Fund SBI PSU Fund LIC MF Infrastructure Fund Edelweiss Emerging Markets Opportunities Equity Off-shore Fund Invesco India Mid Cap Fund Kotak Global Emerging Market Fund Point 1 Upper mid AUM (₹1,679 Cr). Lower mid AUM (₹1,323 Cr). Lower mid AUM (₹1,217 Cr). Top quartile AUM (₹6,594 Cr). Bottom quartile AUM (₹1,099 Cr). Bottom quartile AUM (₹250 Cr). Highest AUM (₹12,397 Cr). Upper mid AUM (₹1,793 Cr). Point 2 Established history (18+ yrs). Established history (13+ yrs). Oldest track record among peers (27 yrs). Established history (16+ yrs). Established history (18+ yrs). Established history (12+ yrs). Established history (19+ yrs). Established history (18+ yrs). Point 3 Rating: 3★ (top quartile). Top rated. Rating: 1★ (bottom quartile). Rating: 2★ (lower mid). Not Rated. Rating: 3★ (upper mid). Rating: 2★ (lower mid). Rating: 3★ (upper mid). Point 4 Risk profile: High. Risk profile: High. Risk profile: High. Risk profile: High. Risk profile: High. Risk profile: High. Risk profile: Moderately High. Risk profile: High. Point 5 5Y return: 22.26% (upper mid). 5Y return: 18.20% (lower mid). 5Y return: 14.56% (lower mid). 5Y return: 23.12% (top quartile). 5Y return: 22.85% (top quartile). 5Y return: 9.65% (bottom quartile). 5Y return: 19.69% (upper mid). 5Y return: 10.59% (bottom quartile). Point 6 3Y return: 41.28% (top quartile). 3Y return: 27.00% (top quartile). 3Y return: 25.80% (upper mid). 3Y return: 25.60% (upper mid). 3Y return: 25.50% (lower mid). 3Y return: 25.30% (lower mid). 3Y return: 24.91% (bottom quartile). 3Y return: 23.91% (bottom quartile). Point 7 1Y return: 62.26% (top quartile). 1Y return: 48.88% (upper mid). 1Y return: 13.59% (lower mid). 1Y return: 6.60% (bottom quartile). 1Y return: 7.66% (bottom quartile). 1Y return: 63.99% (top quartile). 1Y return: 8.63% (lower mid). 1Y return: 52.31% (upper mid). Point 8 Alpha: -0.46 (lower mid). Alpha: -3.23 (bottom quartile). Alpha: 0.91 (upper mid). Alpha: 0.16 (upper mid). Alpha: 4.51 (top quartile). Alpha: 5.56 (top quartile). Alpha: 0.00 (lower mid). Alpha: -1.76 (bottom quartile). Point 9 Sharpe: 1.77 (upper mid). Sharpe: 2.57 (top quartile). Sharpe: 0.42 (lower mid). Sharpe: 0.26 (bottom quartile). Sharpe: 0.26 (lower mid). Sharpe: 2.62 (top quartile). Sharpe: 0.21 (bottom quartile). Sharpe: 2.29 (upper mid). Point 10 Information ratio: -0.78 (bottom quartile). Information ratio: 0.13 (top quartile). Information ratio: 0.08 (upper mid). Information ratio: -0.02 (lower mid). Information ratio: 0.55 (top quartile). Information ratio: -0.40 (bottom quartile). Information ratio: 0.00 (upper mid). Information ratio: -0.25 (lower mid). DSP World Gold Fund
DSP US Flexible Equity Fund
UTI Healthcare Fund
SBI PSU Fund
LIC MF Infrastructure Fund
Edelweiss Emerging Markets Opportunities Equity Off-shore Fund
Invesco India Mid Cap Fund
Kotak Global Emerging Market Fund
*Above is list of funds having AUM/Net Assets above than 100 Crore and having fund age >= 3 years. Sorted on 3 Year CAGR returns.
Data Analysis
Firstly, Let’s look at some historical data (as on 20 April 2017) to figure out if indeed ELSS are better performers.
We did some data crunching over the last 3 years and 5 years. The results clearly show that ELSS as a category has performed much better than Equity Mutual Funds, that too the average returns in the category seem to be higher.
| Type | 3 Year Comparison | 5 Year Comparison |
|---|---|---|
| Large Cap | Min - 22%, Max - 78%, Avg - 44% |
Min - 79%, Max - 185%, Avg - 116% |
| ELSS | Min - 32%, Max - 95%, Avg - 60% |
Min - 106%, Max - 194%, Avg - 145% |
Why ELSS Over Equity Mutual Funds?
Normal equity funds do not have a lock-in, though there is an exit load. So fund managers are constantly making sure they have a liquid enough Portfolio to meet redemption pressures if any.
How is this different in ELSS? Since each cash flow has a lock-in of 3 years, what it does mean is that the fund manager can take long term calls on stocks and on the overall portfolio. It also means that the fund manager does not worry about meeting redemption pressures in the short run.
Typically, you would see churn ratios (also called turnover ratio) being lower in ELSS as against Large cap funds. This is one of the main reasons that returns are a bit higher. The fund manager then can choose value stocks or growth stocks depending on his mandate of the fund. However, one thing remains is that his holding period can be much higher in ELSS than usual equity funds.
Where Investors Benefit?
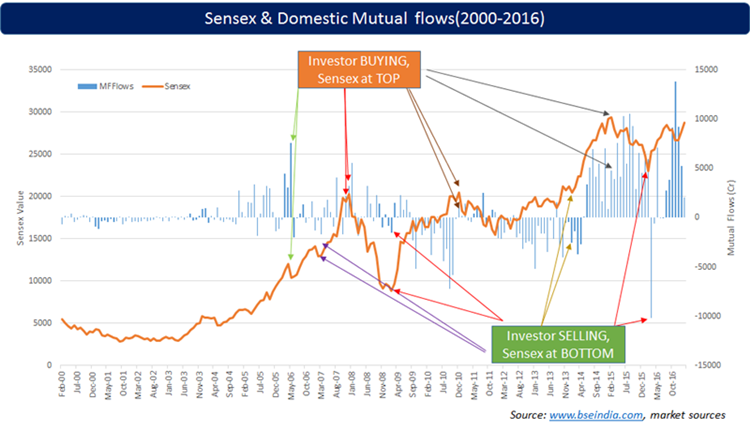
The below chart overlays the BSE Sensex value with domestic mutual fund flows from 2000 to 2016. One thing that comes out is that when the market falls is that investors tend to exit. This puts a huge pressure on normal equity funds. What happens in ELSS? Investors are locked in and the fund manager does not face such pressures on redemptions. This ensures that the portfolio does not suffer and the investment, if they are strong, are not redeemed.
To conclude, Some of the Final Tips for Investors
If you wish to save tax apart from getting good returns, invest in ELSS funds. You can choose from the above mentioned Best elss Funds.
As mentioned above, generally, ELSS Mutual funds tend to offer better returns than most of the equity funds. Therefore, even the investors who do not want to save tax can invest in ELSS Mutual Funds to create wealth over a long run.
However, the investors who are not willing to lock their money can invest in Flexi-cap funds. Starting a SIP (Systematic Investment plan) in these funds might also offer good returns with the benefit of liquidity.
How to Invest in Mutual Funds Online?
Open Free Investment Account for Lifetime at Fincash.com.
Complete your Registration and KYC Process
Upload Documents (PAN, Aadhaar, etc.). And, You are Ready to Invest!
All efforts have been made to ensure the information provided here is accurate. However, no guarantees are made regarding correctness of data. Please verify with scheme information document before making any investment.
")
AMFI Registration No. 112358 | CIN: U74999MH2016PTC282153
Shepard Technologies Pvt. Ltd. (with ARN code 112358) makes no warranties or representations, express or implied, on products offered through the platform. It accepts no liability for any damages or losses, however caused, in connection with the use of, or on the reliance of its product or related services. Terms and conditions of the website are applicable.
©2026 Shepard Technologies Private Limited. All Rights Reserved