सीएजीआर कैलकुलेटर
सीएजीआर क्या है?
सीएजीआर एक विशिष्ट समय अवधि में निवेश की औसत वार्षिक वृद्धि को संदर्भित करता है। यह माना जाता है कि निवेश का मूल्य अवधि के दौरान चक्रवृद्धि होता है। भिन्ननिरपेक्ष रिटर्न, सीएजीआर लेता हैधन का सामयिक मूल्य खाते में। नतीजतन, यह एक वर्ष में उत्पन्न निवेश के सही रिटर्न को प्रतिबिंबित करने में सक्षम है।
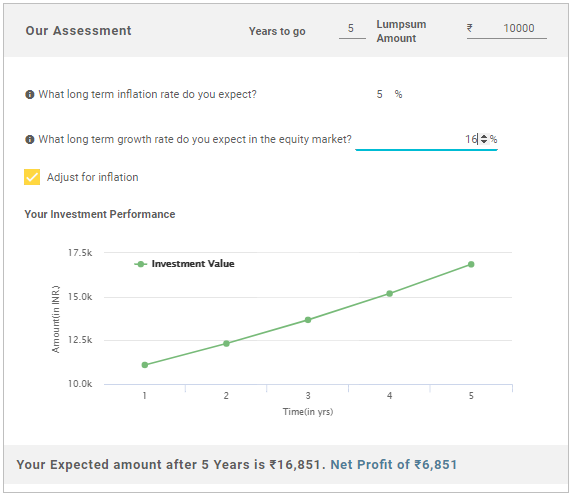
CAGR (Compound Annual Growth Rate) 20.11% CAGR Calculator
सीएजीआर कैलकुलेटर का उपयोग कैसे करें
आप सीएजीआर कैलकुलेटर का उपयोग कहां कर सकते हैं सीएजीआर आपके निवेश निर्णयों का विश्लेषण करने के लिए उपयोग में आसान उपकरण है। यह निम्नलिखित परिदृश्यों में आवेदन पाता है:
- आपने . में कुछ विशिष्ट इकाइयाँ खरीदींइक्विटी फ़ंड इस वर्ष और आपके फंड मूल्य में वृद्धि हुई। CAGR कैलकुलेटर की मदद से आप अपने निवेश पर रिटर्न की दर जान पाएंगे
- आप शुरू करना चाहते हैंनिवेश और कुछ विशिष्ट लक्ष्य रखते हैं। सीएजीआर कैलकुलेटर के साथ, आपको पता चल जाएगा कि समय सीमा के भीतर आपको अपना पैसा किस दर से बढ़ाना है
- मान लें कि आपने एक इक्विटी फंड में निवेश किया है, जिसका 3,5 और 10 साल का रिटर्न क्रमशः 25%, 15% और 10% है। आप उस औसत दर को जानना चाहते हैं जिस पर आपका फंड सालाना बढ़ता है
- किसी निवेश के सीएजीआर की अपनी अपेक्षित दर से तुलना करना और उपयुक्तता की जांच करना। केवल तभी निवेश करें जब सीएजीआर आपकी अपेक्षित प्रतिफल दर से अधिक या उसके बराबर हो
- ए . का सीएजीआरम्यूचुअल फंड बेंचमार्क रिटर्न के साथ तुलना की जा सकती है
सीएजीआर फॉर्मूला
CAGR की गणना गणितीय सूत्र का उपयोग करके की जा सकती है
सीएजीआर = [ (अंतिम मूल्य/शुरुआती मूल्य)^(1/एन)] -1
उपरोक्त सूत्र तीन चरों पर निर्भर करता है। अर्थात्, प्रारंभिक मूल्य, समाप्ति मूल्य और वर्षों की संख्या (एन)
जब आप उपरोक्त तीन चरों को इनपुट करते हैं, तो सीएजीआर कैलकुलेटर आपको की दर देगानिवेश पर प्रतिफल.
Talk to our investment specialist
सीएजीआर की सीमाएं
हालांकि सीएजीआर एक उपयोगी अवधारणा है, लेकिन इसकी बहुत सी सीमाएं हैं। इन सीमाओं के बारे में जागरूकता की कमी से निवेश के गलत फैसले होंगे। कुछ सीमाएँ हैं:
सीएजीआर से संबंधित गणनाओं में, यह केवल शुरुआत और अंत मान है। यह मानता है कि विकास समय की अवधि में स्थिर है और अस्थिरता पहलू पर विचार करने में विफल रहता है
यह केवल एकमुश्त निवेश के लिए उपयुक्त है। ए के मामले मेंएसआईपी निवेश, विभिन्न अंतरालों पर व्यवस्थित निवेश पर विचार नहीं किया जाएगा क्योंकि सीएजीआर की गणना करते समय केवल शुरुआती मूल्य पर विचार किया जाता है
सीएजीआर निवेश में निहित जोखिम के लिए जिम्मेदार नहीं है। जब इक्विटी निवेश की बात आती है, तो सीएजीआर की तुलना में जोखिम-समायोजित रिटर्न अधिक महत्वपूर्ण होते हैं। इन उद्देश्यों के लिए, आपको बेहतर अनुपातों पर विचार करने की आवश्यकता है जैसेशार्प भाग
3 साल के सर्वोत्तम सीएजीआर के साथ शीर्ष फंड
"The primary investment objective of the Scheme is to seek capital appreciation by investing predominantly in units of MLIIF - WGF. The Scheme may, at the discretion of the Investment Manager, also invest in the units of other similar overseas mutual fund schemes, which may constitute a significant part of its corpus. The Scheme may also invest a certain portion of its corpus in money market securities and/or units of money market/liquid schemes of DSP Merrill Lynch Mutual Fund, in order to meet liquidity requirements from time to time. However, there is no assurance that the investment objective of the Scheme will be realized." Below is the key information for DSP World Gold Fund Returns up to 1 year are on The scheme seeks to provide returns that closely correspond to returns provided by SBI - ETF Gold (Previously known as SBI GETS). Research Highlights for SBI Gold Fund Below is the key information for SBI Gold Fund Returns up to 1 year are on ICICI Prudential Regular Gold Savings Fund (the Scheme) is a fund of funds scheme with the primary objective to generate returns by investing in units of ICICI Prudential Gold Exchange Traded Fund (IPru Gold ETF).
However, there can be no assurance that the investment objectives of the Scheme will be realized. Research Highlights for ICICI Prudential Regular Gold Savings Fund Below is the key information for ICICI Prudential Regular Gold Savings Fund Returns up to 1 year are on 1. DSP World Gold Fund
DSP World Gold Fund
Growth Launch Date 14 Sep 07 NAV (23 Jan 26) ₹65.542 ↑ 2.04 (3.22 %) Net Assets (Cr) ₹1,756 on 31 Dec 25 Category Equity - Global AMC DSP BlackRock Invmt Managers Pvt. Ltd. Rating ☆☆☆ Risk High Expense Ratio 1.41 Sharpe Ratio 3.42 Information Ratio -0.67 Alpha Ratio 1.32 Min Investment 1,000 Min SIP Investment 500 Exit Load 0-12 Months (1%),12 Months and above(NIL) Growth of 10,000 investment over the years.
Date Value Returns for DSP World Gold Fund
absolute basis & more than 1 year are on CAGR (Compound Annual Growth Rate) basis. as on 23 Jan 26 Duration Returns 1 Month 19.7% 3 Month 52.1% 6 Month 105.9% 1 Year 199.1% 3 Year 55% 5 Year 28.7% 10 Year 15 Year Since launch 10.8% Historical performance (Yearly) on absolute basis
Year Returns 2024 167.1% 2023 15.9% 2022 7% 2021 -7.7% 2020 -9% 2019 31.4% 2018 35.1% 2017 -10.7% 2016 -4% 2015 52.7% Fund Manager information for DSP World Gold Fund
Name Since Tenure Data below for DSP World Gold Fund as on 31 Dec 25
Equity Sector Allocation
Sector Value Asset Allocation
Asset Class Value Top Securities Holdings / Portfolio
Name Holding Value Quantity 2. SBI Gold Fund
SBI Gold Fund
Growth Launch Date 12 Sep 11 NAV (27 Jan 26) ₹46.2807 ↑ 1.34 (2.98 %) Net Assets (Cr) ₹10,775 on 31 Dec 25 Category Gold - Gold AMC SBI Funds Management Private Limited Rating ☆☆ Risk Moderately High Expense Ratio 0.3 Sharpe Ratio 4.38 Information Ratio 0 Alpha Ratio 0 Min Investment 5,000 Min SIP Investment 500 Exit Load 0-1 Years (1%),1 Years and above(NIL) Growth of 10,000 investment over the years.
Date Value Returns for SBI Gold Fund
absolute basis & more than 1 year are on CAGR (Compound Annual Growth Rate) basis. as on 23 Jan 26 Duration Returns 1 Month 15.1% 3 Month 31.4% 6 Month 59.9% 1 Year 93.7% 3 Year 39% 5 Year 25% 10 Year 15 Year Since launch 11.2% Historical performance (Yearly) on absolute basis
Year Returns 2024 71.5% 2023 19.6% 2022 14.1% 2021 12.6% 2020 -5.7% 2019 27.4% 2018 22.8% 2017 6.4% 2016 3.5% 2015 10% Fund Manager information for SBI Gold Fund
Name Since Tenure Data below for SBI Gold Fund as on 31 Dec 25
Asset Allocation
Asset Class Value Top Securities Holdings / Portfolio
Name Holding Value Quantity 3. ICICI Prudential Regular Gold Savings Fund
ICICI Prudential Regular Gold Savings Fund
Growth Launch Date 11 Oct 11 NAV (27 Jan 26) ₹49.0192 ↑ 1.39 (2.91 %) Net Assets (Cr) ₹4,482 on 31 Dec 25 Category Gold - Gold AMC ICICI Prudential Asset Management Company Limited Rating ☆ Risk Moderately High Expense Ratio 0.38 Sharpe Ratio 4.33 Information Ratio 0 Alpha Ratio 0 Min Investment 5,000 Min SIP Investment 100 Exit Load 0-15 Months (2%),15 Months and above(NIL) Growth of 10,000 investment over the years.
Date Value Returns for ICICI Prudential Regular Gold Savings Fund
absolute basis & more than 1 year are on CAGR (Compound Annual Growth Rate) basis. as on 23 Jan 26 Duration Returns 1 Month 15% 3 Month 31.5% 6 Month 60% 1 Year 93.7% 3 Year 38.8% 5 Year 24.9% 10 Year 15 Year Since launch 11.8% Historical performance (Yearly) on absolute basis
Year Returns 2024 72% 2023 19.5% 2022 13.5% 2021 12.7% 2020 -5.4% 2019 26.6% 2018 22.7% 2017 7.4% 2016 0.8% 2015 8.9% Fund Manager information for ICICI Prudential Regular Gold Savings Fund
Name Since Tenure Data below for ICICI Prudential Regular Gold Savings Fund as on 31 Dec 25
Asset Allocation
Asset Class Value Top Securities Holdings / Portfolio
Name Holding Value Quantity
यहां प्रदान की गई जानकारी सटीक है, यह सुनिश्चित करने के लिए सभी प्रयास किए गए हैं। हालांकि, डेटा की शुद्धता के संबंध में कोई गारंटी नहीं दी जाती है। कृपया कोई भी निवेश करने से पहले योजना सूचना दस्तावेज के साथ सत्यापित करें।


Research Highlights for DSP World Gold Fund