एसडब्ल्यूपी कैलकुलेटर - व्यवस्थित निकासी योजना कैलकुलेटर
एसडब्ल्यूपी कैलकुलेटर एक ऐसा उपकरण है जो व्यक्तियों को यह गणना करने में मदद करता है कि उनका एसडब्ल्यूपी निवेश अवधि के दौरान कैसा रहेगा। SWP या सिस्टमैटिक विदड्रॉअल प्लान, यूनिट्स को रिडीम करने या इनमें निवेश करने की एक तकनीक हैम्यूचुअल फंड्स. एसडब्ल्यूपी में, व्यक्ति अपना पैसा म्यूचुअल फंड योजना में निवेश करते हैं और फिर एक निश्चित अवधि में अपने निवेश को वापस ले लेते हैं। एसडब्ल्यूपी आम तौर पर उन व्यक्तियों के लिए उपयुक्त है जो एक निश्चित की तलाश में हैंआय नियमित कार्यकाल के दौरान। यह लेख आपको सिस्टमैटिक विदड्रॉल प्लान की अवधारणा, एसडब्ल्यूपी कैलकुलेटर कैसे काम करता है, और अन्य संबंधित मापदंडों की समग्र समझ देता है।
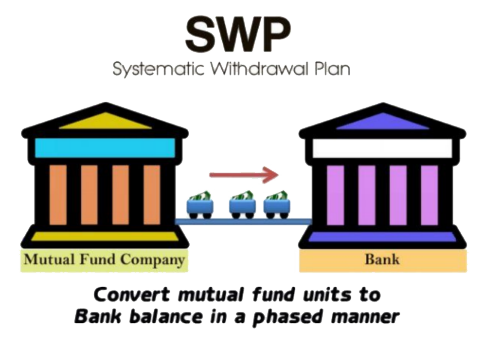
म्यूचुअल फंड में SWP का क्या मतलब है?
म्यूचुअल फंड में व्यवस्थित निकासी योजना या एसडब्ल्यूपी म्यूचुअल फंड निवेश की इकाइयों को भुनाने की एक व्यवस्थित और नियोजित प्रक्रिया को संदर्भित करता है। SWP की अवधारणा इसके विपरीत तरीके से काम करती हैसिप. एसडब्ल्यूपी में, व्यक्ति म्यूचुअल फंड योजनाओं में एकमुश्त राशि का निवेश करते हैं जो आम तौर पर कम जोखिम वाली होती हैं, जैसेलिक्विड फंड या अल्ट्राअल्पकालिक निधि. इसके बाद व्यक्ति नियमित अंतराल पर निवेश की गई राशि को निकालना शुरू कर देते हैं। व्यक्ति अपनी आवश्यकताओं के आधार पर अपनी निकासी की आवृत्ति जैसे मासिक, त्रैमासिक, वार्षिक आदि को अनुकूलित कर सकते हैं। इस मामले में, म्यूचुअल फंड में निवेश किया गया पैसा भी व्यक्तियों के लिए राजस्व प्राप्त करता है। व्यक्ति, विशेष रूप से सेवानिवृत्त व्यक्ति, जो आय के नियमित स्रोत की तलाश में हैं, वे व्यवस्थित निकासी योजना का विकल्प चुन सकते हैं।म्यूचुअल फंड में निवेश.
एसडब्ल्यूपी म्यूचुअल फंड कैलकुलेटर
SWP कैलकुलेटर व्यक्तियों को एक निश्चित अवधि में म्यूचुअल फंड निवेश में उनकी निकासी का अनुमान लगाने में मदद करता है। एसडब्ल्यूपी कैलकुलेटर में दर्ज किए जाने वाले इनपुट डेटा में शामिल हैं:
- एसडब्ल्यूपी/आहरण राशि - यह निश्चित निकासी राशि को संदर्भित करता है जिसे आप नियमित अंतराल पर निकालने की योजना बना रहे हैं।
- प्रारंभिक निवेश - प्रारंभिक निवेश एकमुश्त राशि को संदर्भित करता है जिसे आप म्यूचुअल फंड योजना में निवेश करना चाहते हैं।
- निकासी आवृत्ति - निकासी आवृत्ति, उस समय सीमा को संदर्भित करती है जिस पर आप अपना निवेश वापस लेना चाहते हैं। यह मासिक, साप्ताहिक या त्रैमासिक हो सकता है। आम तौर पर गणना मासिक के लिए की जाती है।
- रिटर्न की अपेक्षित दर - इसका मतलब है कि आप अपने निवेश पर रिटर्न की उम्मीद कर रहे हैं।
तो, आइए हम एक उदाहरण के साथ एसडब्ल्यूपी कैलकुलेटर की अवधारणा को विस्तृत रूप से समझते हैं।
नमूना चित्रण
- प्रारंभिक निवेश राशि - INR 1.20,000
- एसडब्ल्यूपी राशि - INR 10,000
- निकासी अवधि - 12 महीने
- वापसी की अपेक्षित दर - 7%
एसडब्ल्यूपी तालिका की गणना नीचे दी गई है।
| महीना | माह की शुरुआत में शेष राशि (INR) | मोचन राशि (INR) | अर्जित ब्याज (INR) | माह के अंत में शेष राशि (INR) |
|---|---|---|---|---|
| 1 | 1,20,000 | 10,000 | 642 | 1,10,642 |
| 2 | 1,10,642 | 10,000 | 587 | 1,01,229 |
| 3 | 1,01,229 | 10,000 | 532 | 91,761 |
| 4 | 91,761 | 10,000 | 477 | 82,238 |
| 5 | 82,238 | 10,000 | 421 | 72,659 |
| 6 | 72,659 | 10,000 | 366 | 63,025 |
| 7 | 63,025 | 10,000 | 309 | 53,334 |
| 8 | 53,334 | 10,000 | 253 | 43,587 |
| 9 | 43,587 | 10,000 | 196 | 33,783 |
| 10 | 33,783 | 10,000 | 139 | 23,921 |
| 1 1 | 23,921 | 10,000 | 81 | 14,003 |
| 12 | 14,003 | 10,000 | 23 | 4,026 |
इस प्रकार, उपरोक्त तालिका से, यह कहा जा सकता है कि एसडब्ल्यूपी लेनदेन के माध्यम से म्यूचुअल फंड योजना का अर्जित लाभ 4,026 रुपये है।
VALUE AT END OF TENOR:₹4,597SWP Calculator
व्यवस्थित निकासी योजना के लाभ
एसडब्ल्यूपी के कुछ प्रमुख लाभ इस प्रकार हैं।
नियमित आय प्रवाह
SWP के प्राथमिक लाभों में से एक यह है कि व्यक्ति नियमित आय के स्रोत के रूप में व्यवस्थित निकासी योजना का उपयोग कर सकते हैं। ऐसा इसलिए है क्योंकि निकाली गई राशि स्थिर रहती है।
अनुशासित निकासी की आदत
SWP व्यक्तियों के बीच एक अनुशासित निकासी की आदत बनाता है क्योंकि केवल एक निश्चित राशि निकाली जाती है और शेष धन को म्यूचुअल फंड में निवेश किया जाता है। यह रोकता हैराजधानी निवेश पर कटाव साथ ही, म्यूचुअल फंड में निवेश रिटर्न उत्पन्न करता है।
पेंशन के लिए विकल्प
SWP सेवानिवृत्त व्यक्तियों के मामले में पेंशन के विकल्प के रूप में कार्य करता है। सेवानिवृत्त व्यक्ति एसडब्ल्यूपी के माध्यम से नियमित आय के लिए स्वयं को आश्वस्त कर सकते हैं।
Talk to our investment specialist
2022 के लिए सर्वश्रेष्ठ एसडब्ल्यूपी म्यूचुअल फंड
एसडब्ल्यूपी आम तौर पर म्यूचुअल फंड योजनाओं में किया जाता है जिसमें लिक्विड फंड जैसे जोखिम का स्तर कम होता है। इसलिए, लिक्विड/अल्ट्राशॉर्ट श्रेणी के तहत कुछ बेहतरीन म्यूचुअल फंड योजनाएं जिनकी शुद्ध संपत्ति . से अधिक है1000 करोड़ नीचे सूचीबद्ध हैं।
Fund NAV Net Assets (Cr) 3 MO (%) 6 MO (%) 1 YR (%) 3 YR (%) 2025 (%) Debt Yield (YTM) Mod. Duration Eff. Maturity Axis Liquid Fund Growth ₹3,105.17
↑ 0.53 ₹44,866 1.6 3.4 6.4 6.9 6.6 6.64% 1M 5D 1M 5D Edelweiss Liquid Fund Growth ₹3,565.92
↑ 0.59 ₹12,259 1.6 3.4 6.4 6.9 6.5 6.51% 1M 6D 1M 6D BOI AXA Liquid Fund Growth ₹3,211.12
↑ 0.54 ₹1,339 1.6 3.3 6.3 7 6.6 6.43% 1M 10D 1M 10D DSP Liquidity Fund Growth ₹3,980.19
↑ 0.66 ₹19,371 1.6 3.4 6.3 6.9 6.5 6.45% 2M 5D 2M 8D Aditya Birla Sun Life Liquid Fund Growth ₹449.179
↑ 0.07 ₹63,687 1.6 3.4 6.3 6.9 6.5 6.49% 2M 5D 2M 5D UTI Liquid Cash Plan Growth ₹457.304
↑ 0.08 ₹27,632 1.6 3.3 6.3 6.9 6.5 6.62% 1M 5D 1M 6D Invesco India Liquid Fund Growth ₹3,831.16
↑ 0.63 ₹16,797 1.6 3.3 6.3 6.9 6.5 6.56% 30D 1M 1D Note: Returns up to 1 year are on absolute basis & more than 1 year are on CAGR basis. as on 26 Jul 26 Research Highlights & Commentary of 7 Funds showcased
Commentary Axis Liquid Fund Edelweiss Liquid Fund BOI AXA Liquid Fund DSP Liquidity Fund Aditya Birla Sun Life Liquid Fund UTI Liquid Cash Plan Invesco India Liquid Fund Point 1 Upper mid AUM (₹44,866 Cr). Bottom quartile AUM (₹12,259 Cr). Bottom quartile AUM (₹1,339 Cr). Lower mid AUM (₹19,371 Cr). Highest AUM (₹63,687 Cr). Upper mid AUM (₹27,632 Cr). Lower mid AUM (₹16,797 Cr). Point 2 Established history (16+ yrs). Established history (18+ yrs). Established history (18+ yrs). Established history (20+ yrs). Oldest track record among peers (22 yrs). Established history (22+ yrs). Established history (19+ yrs). Point 3 Top rated. Rating: 2★ (bottom quartile). Rating: 3★ (lower mid). Rating: 3★ (lower mid). Rating: 4★ (upper mid). Rating: 3★ (bottom quartile). Rating: 4★ (upper mid). Point 4 Risk profile: Low. Risk profile: Low. Risk profile: Low. Risk profile: Low. Risk profile: Low. Risk profile: Low. Risk profile: Low. Point 5 1Y return: 6.36% (top quartile). 1Y return: 6.35% (upper mid). 1Y return: 6.34% (upper mid). 1Y return: 6.33% (lower mid). 1Y return: 6.32% (lower mid). 1Y return: 6.31% (bottom quartile). 1Y return: 6.30% (bottom quartile). Point 6 1M return: 0.54% (upper mid). 1M return: 0.54% (top quartile). 1M return: 0.53% (upper mid). 1M return: 0.53% (lower mid). 1M return: 0.53% (lower mid). 1M return: 0.53% (bottom quartile). 1M return: 0.53% (bottom quartile). Point 7 Sharpe: 2.39 (upper mid). Sharpe: 2.34 (lower mid). Sharpe: 2.64 (top quartile). Sharpe: 2.35 (lower mid). Sharpe: 2.22 (bottom quartile). Sharpe: 2.38 (upper mid). Sharpe: 2.27 (bottom quartile). Point 8 Information ratio: 0.00 (upper mid). Information ratio: 0.00 (upper mid). Information ratio: 2.08 (top quartile). Information ratio: 0.00 (lower mid). Information ratio: 0.00 (lower mid). Information ratio: 0.00 (bottom quartile). Information ratio: 0.00 (bottom quartile). Point 9 Yield to maturity (debt): 6.64% (top quartile). Yield to maturity (debt): 6.51% (lower mid). Yield to maturity (debt): 6.43% (bottom quartile). Yield to maturity (debt): 6.45% (bottom quartile). Yield to maturity (debt): 6.49% (lower mid). Yield to maturity (debt): 6.62% (upper mid). Yield to maturity (debt): 6.56% (upper mid). Point 10 Modified duration: 0.10 yrs (upper mid). Modified duration: 0.10 yrs (lower mid). Modified duration: 0.11 yrs (lower mid). Modified duration: 0.18 yrs (bottom quartile). Modified duration: 0.18 yrs (bottom quartile). Modified duration: 0.10 yrs (upper mid). Modified duration: 0.08 yrs (top quartile). Axis Liquid Fund
Edelweiss Liquid Fund
BOI AXA Liquid Fund
DSP Liquidity Fund
Aditya Birla Sun Life Liquid Fund
UTI Liquid Cash Plan
Invesco India Liquid Fund
To provide a high level of liquidity with reasonable returns commensurating with low risk through a portfolio of money market and debt securities. However there can be no assurance that the investment objective of the scheme will be achieved. Below is the key information for Axis Liquid Fund Returns up to 1 year are on The investment objective of the Scheme is to provide reasonable returns, commensurate with low risk while providing a high level of liquidity, through a portfolio of money market and debt securities. However, there can be no assurance that the investment objectives of the Scheme will be realized. Research Highlights for Edelweiss Liquid Fund Below is the key information for Edelweiss Liquid Fund Returns up to 1 year are on Objective The Scheme seeks to deliver reasonable market related returns with lower risk and higher liquidity through a portfolio of debt and money market instruments.
However there can be no assurance that the investment objectives of the Scheme will be realized. Research Highlights for BOI AXA Liquid Fund Below is the key information for BOI AXA Liquid Fund Returns up to 1 year are on The Scheme seeks to generate reasonable returns commensurate with low risk from a portfolio constituted of money market and high quality debts Research Highlights for DSP Liquidity Fund Below is the key information for DSP Liquidity Fund Returns up to 1 year are on (Erstwhile Aditya Birla Sun Life Cash Plus Fund) An Open-ended liquid scheme with the objective to provide reasonable returns at a high level of safety and liquidity through judicious investments in high quality debt and money market instruments. Research Highlights for Aditya Birla Sun Life Liquid Fund Below is the key information for Aditya Birla Sun Life Liquid Fund Returns up to 1 year are on The investment objective of the scheme is to generate steady and reasonable income, with low risk and high level of liquidity from a portfolio of money market securities and high quality debt. Research Highlights for UTI Liquid Cash Plan Below is the key information for UTI Liquid Cash Plan Returns up to 1 year are on To provide reasonable returns, commensurate with low risk while providing a high level of liquidity, through a portfolio of money market and debt securities. Research Highlights for Invesco India Liquid Fund Below is the key information for Invesco India Liquid Fund Returns up to 1 year are on 1. Axis Liquid Fund
Axis Liquid Fund
Growth Launch Date 9 Oct 09 NAV (26 Jul 26) ₹3,105.17 ↑ 0.53 (0.02 %) Net Assets (Cr) ₹44,866 on 30 Jun 26 Category Debt - Liquid Fund AMC Axis Asset Management Company Limited Rating ☆☆☆☆ Risk Low Expense Ratio 0.23 Sharpe Ratio 2.39 Information Ratio 0 Alpha Ratio 0 Min Investment 500 Min SIP Investment 1,000 Exit Load NIL Yield to Maturity 6.64% Effective Maturity 1 Month 5 Days Modified Duration 1 Month 5 Days Growth of 10,000 investment over the years.
Date Value 30 Jun 21 ₹10,000 30 Jun 22 ₹10,361 30 Jun 23 ₹11,030 30 Jun 24 ₹11,839 30 Jun 25 ₹12,692 30 Jun 26 ₹13,498 Returns for Axis Liquid Fund
absolute basis & more than 1 year are on CAGR (Compound Annual Growth Rate) basis. as on 26 Jul 26 Duration Returns 1 Month 0.5% 3 Month 1.6% 6 Month 3.4% 1 Year 6.4% 3 Year 6.9% 5 Year 6.2% 10 Year 15 Year Since launch 7% Historical performance (Yearly) on absolute basis
Year Returns 2025 6.6% 2024 7.4% 2023 7.1% 2022 4.9% 2021 3.3% 2020 4.3% 2019 6.6% 2018 7.5% 2017 6.7% 2016 7.6% Fund Manager information for Axis Liquid Fund
Name Since Tenure Devang Shah 5 Nov 12 13.66 Yr. Aditya Pagaria 13 Aug 16 9.89 Yr. Sachin Jain 3 Jul 23 3 Yr. Data below for Axis Liquid Fund as on 30 Jun 26
Asset Allocation
Asset Class Value Cash 99.02% Debt 0.8% Other 0.17% Debt Sector Allocation
Sector Value Cash Equivalent 88.21% Corporate 7.79% Government 3.84% Credit Quality
Rating Value AAA 100% Top Securities Holdings / Portfolio
Name Holding Value Quantity Clearing Corporation Of India Ltd
CBLO/Reverse Repo | -13% ₹7,525 Cr Canara Bank
Domestic Bonds | -3% ₹1,972 Cr 40,000
↑ 40,000 Export-Import Bank of India
Commercial Paper | -3% ₹1,774 Cr 36,000
↑ 36,000 Union Bank of India
Debentures | -2% ₹1,242 Cr 25,000 Indian Bank
Domestic Bonds | -2% ₹1,182 Cr 24,000
↑ 24,000 HDFC Bank Limited
Certificate of Deposit | -2% ₹1,156 Cr 23,500
↑ 23,500 Tbill
Sovereign Bonds | -2% ₹1,108 Cr 111,500,000 HDFC Bank Limited
Certificate of Deposit | -2% ₹1,036 Cr 21,000
↑ 5,000 Tata Steel Ltd.
Commercial Paper | -2% ₹985 Cr 20,000
↑ 20,000 Export-Import Bank of India
Commercial Paper | -2% ₹985 Cr 20,000
↑ 20,000 2. Edelweiss Liquid Fund
Edelweiss Liquid Fund
Growth Launch Date 21 Sep 07 NAV (26 Jul 26) ₹3,565.92 ↑ 0.59 (0.02 %) Net Assets (Cr) ₹12,259 on 30 Jun 26 Category Debt - Liquid Fund AMC Edelweiss Asset Management Limited Rating ☆☆ Risk Low Expense Ratio 0.23 Sharpe Ratio 2.34 Information Ratio 0 Alpha Ratio 0 Min Investment 5,000 Min SIP Investment 500 Exit Load NIL Yield to Maturity 6.51% Effective Maturity 1 Month 6 Days Modified Duration 1 Month 6 Days Growth of 10,000 investment over the years.
Date Value 30 Jun 21 ₹10,000 30 Jun 22 ₹10,340 30 Jun 23 ₹10,990 30 Jun 24 ₹11,783 30 Jun 25 ₹12,627 30 Jun 26 ₹13,428 Returns for Edelweiss Liquid Fund
absolute basis & more than 1 year are on CAGR (Compound Annual Growth Rate) basis. as on 26 Jul 26 Duration Returns 1 Month 0.5% 3 Month 1.6% 6 Month 3.4% 1 Year 6.4% 3 Year 6.9% 5 Year 6.1% 10 Year 15 Year Since launch 7% Historical performance (Yearly) on absolute basis
Year Returns 2025 6.5% 2024 7.3% 2023 6.9% 2022 4.7% 2021 3.2% 2020 4.1% 2019 6.6% 2018 7.4% 2017 6.6% 2016 6.8% Fund Manager information for Edelweiss Liquid Fund
Name Since Tenure Rahul Dedhia 11 Dec 17 8.56 Yr. Hetul Raval 22 Sep 25 0.77 Yr. Data below for Edelweiss Liquid Fund as on 30 Jun 26
Asset Allocation
Asset Class Value Cash 99.79% Other 0.21% Debt Sector Allocation
Sector Value Cash Equivalent 82.61% Government 10.04% Corporate 7.14% Credit Quality
Rating Value AAA 100% Top Securities Holdings / Portfolio
Name Holding Value Quantity Reverse Repo
CBLO/Reverse Repo | -8% ₹1,100 Cr Net Receivables/(Payables)
CBLO | -5% -₹690 Cr Clearing Corporation Of India Ltd.
CBLO/Reverse Repo | -4% ₹551 Cr India (Republic of)
- | -4% ₹521 Cr 52,500,000
↑ 2,500,000 Hindustan Petroleum Corp Ltd.
Commercial Paper | -4% ₹500 Cr 50,000,000
↓ -25,000,000 India (Republic of)
- | -4% ₹496 Cr 50,000,000 Reliance Retail Vent Cp 16-09-26 Vd1706**
Net Current Assets | -3% ₹393 Cr 40,000,000
↑ 40,000,000 Bank of Baroda
Debentures | -2% ₹346 Cr 35,000,000 Axis Bank Ltd.
Debentures | -2% ₹346 Cr 35,000,000 23/07/2026 Maturing 182 DTB
Sovereign Bonds | -2% ₹303 Cr 30,500,000 3. BOI AXA Liquid Fund
BOI AXA Liquid Fund
Growth Launch Date 16 Jul 08 NAV (26 Jul 26) ₹3,211.12 ↑ 0.54 (0.02 %) Net Assets (Cr) ₹1,339 on 30 Jun 26 Category Debt - Liquid Fund AMC BOI AXA Investment Mngrs Private Ltd Rating ☆☆☆ Risk Low Expense Ratio 0.13 Sharpe Ratio 2.64 Information Ratio 2.08 Alpha Ratio 0.1 Min Investment 5,000 Min SIP Investment 1,000 Exit Load NIL Yield to Maturity 6.43% Effective Maturity 1 Month 10 Days Modified Duration 1 Month 10 Days Growth of 10,000 investment over the years.
Date Value 30 Jun 21 ₹10,000 30 Jun 22 ₹10,363 30 Jun 23 ₹11,033 30 Jun 24 ₹11,845 30 Jun 25 ₹12,702 30 Jun 26 ₹13,508 Returns for BOI AXA Liquid Fund
absolute basis & more than 1 year are on CAGR (Compound Annual Growth Rate) basis. as on 26 Jul 26 Duration Returns 1 Month 0.5% 3 Month 1.6% 6 Month 3.3% 1 Year 6.3% 3 Year 7% 5 Year 6.2% 10 Year 15 Year Since launch 6.7% Historical performance (Yearly) on absolute basis
Year Returns 2025 6.6% 2024 7.4% 2023 7% 2022 4.9% 2021 3.3% 2020 4.1% 2019 6.4% 2018 7.4% 2017 6.7% 2016 7.6% Fund Manager information for BOI AXA Liquid Fund
Name Since Tenure Mithraem Bharucha 17 Aug 21 4.87 Yr. Data below for BOI AXA Liquid Fund as on 30 Jun 26
Asset Allocation
Asset Class Value Cash 99.66% Other 0.34% Debt Sector Allocation
Sector Value Cash Equivalent 78.23% Government 12.25% Corporate 9.17% Credit Quality
Rating Value AAA 100% Top Securities Holdings / Portfolio
Name Holding Value Quantity India (Republic of)
- | -6% ₹99 Cr 10,000,000 India (Republic of)
- | -6% ₹99 Cr 10,000,000 Power Finance Corporation Limited
Commercial Paper | -5% ₹75 Cr 7,500,000
↑ 2,500,000 Bank of Baroda
Debentures | -5% ₹74 Cr 7,500,000 Kotak Mahindra Bank Ltd.
Debentures | -5% ₹74 Cr 7,500,000
↑ 7,500,000 Indian Bank
Domestic Bonds | -4% ₹70 Cr 7,000,000
↑ 7,000,000 NTPC Ltd.
Commercial Paper | -4% ₹65 Cr 6,500,000 Net Receivables / (Payables)
Net Current Assets | -3% ₹53 Cr Union Bank Of India
Certificate of Deposit | -3% ₹50 Cr 5,000,000 Tbill
Sovereign Bonds | -3% ₹50 Cr 5,000,000
↓ -2,500,000 4. DSP Liquidity Fund
DSP Liquidity Fund
Growth Launch Date 23 Nov 05 NAV (26 Jul 26) ₹3,980.19 ↑ 0.66 (0.02 %) Net Assets (Cr) ₹19,371 on 30 Jun 26 Category Debt - Liquid Fund AMC DSP BlackRock Invmt Managers Pvt. Ltd. Rating ☆☆☆ Risk Low Expense Ratio 0.21 Sharpe Ratio 2.35 Information Ratio 0 Alpha Ratio 0 Min Investment 1,000 Min SIP Investment 500 Exit Load NIL Yield to Maturity 6.45% Effective Maturity 2 Months 8 Days Modified Duration 2 Months 5 Days Growth of 10,000 investment over the years.
Date Value 30 Jun 21 ₹10,000 30 Jun 22 ₹10,357 30 Jun 23 ₹11,016 30 Jun 24 ₹11,817 30 Jun 25 ₹12,668 30 Jun 26 ₹13,469 Returns for DSP Liquidity Fund
absolute basis & more than 1 year are on CAGR (Compound Annual Growth Rate) basis. as on 26 Jul 26 Duration Returns 1 Month 0.5% 3 Month 1.6% 6 Month 3.4% 1 Year 6.3% 3 Year 6.9% 5 Year 6.2% 10 Year 15 Year Since launch 6.9% Historical performance (Yearly) on absolute basis
Year Returns 2025 6.5% 2024 7.4% 2023 7% 2022 4.8% 2021 3.3% 2020 4.2% 2019 6.5% 2018 7.4% 2017 6.6% 2016 7.6% Fund Manager information for DSP Liquidity Fund
Name Since Tenure Karan Mundhra 31 May 21 5.09 Yr. Shalini Vasanta 1 Aug 24 1.91 Yr. Kunal Khudania 1 Jan 26 0.5 Yr. Data below for DSP Liquidity Fund as on 30 Jun 26
Asset Allocation
Asset Class Value Cash 99.6% Debt 0.21% Other 0.19% Debt Sector Allocation
Sector Value Cash Equivalent 78.75% Government 11.21% Corporate 9.85% Credit Quality
Rating Value AAA 100% Top Securities Holdings / Portfolio
Name Holding Value Quantity Treps / Reverse Repo Investments
CBLO/Reverse Repo | -11% ₹2,888 Cr India (Republic of)
- | -3% ₹890 Cr 90,000,000
↑ 90,000,000 India (Republic of)
- | -3% ₹696 Cr 70,000,000 India (Republic of)
- | -3% ₹644 Cr 65,000,000
↑ 65,000,000 HDFC Bank Limited
Certificate of Deposit | -2% ₹591 Cr 12,000
↑ 12,000 National Bank for Agriculture and Rural Development
Commercial Paper | -2% ₹492 Cr 10,000
↑ 10,000 National Bank for Agriculture and Rural Development
Commercial Paper | -2% ₹492 Cr 10,000
↑ 10,000 Union Bank of India
Debentures | -2% ₹443 Cr 9,000
↑ 9,000 Bajaj Finance Limited
Commercial Paper | -2% ₹398 Cr 8,000 Canara Bank
Domestic Bonds | -2% ₹394 Cr 8,000
↑ 8,000 5. Aditya Birla Sun Life Liquid Fund
Aditya Birla Sun Life Liquid Fund
Growth Launch Date 30 Mar 04 NAV (26 Jul 26) ₹449.179 ↑ 0.07 (0.02 %) Net Assets (Cr) ₹63,687 on 30 Jun 26 Category Debt - Liquid Fund AMC Birla Sun Life Asset Management Co Ltd Rating ☆☆☆☆ Risk Low Expense Ratio 0.34 Sharpe Ratio 2.22 Information Ratio 0 Alpha Ratio 0 Min Investment 5,000 Min SIP Investment 500 Exit Load NIL Yield to Maturity 6.49% Effective Maturity 2 Months 5 Days Modified Duration 2 Months 5 Days Growth of 10,000 investment over the years.
Date Value 30 Jun 21 ₹10,000 30 Jun 22 ₹10,357 30 Jun 23 ₹11,026 30 Jun 24 ₹11,828 30 Jun 25 ₹12,676 30 Jun 26 ₹13,475 Returns for Aditya Birla Sun Life Liquid Fund
absolute basis & more than 1 year are on CAGR (Compound Annual Growth Rate) basis. as on 26 Jul 26 Duration Returns 1 Month 0.5% 3 Month 1.6% 6 Month 3.4% 1 Year 6.3% 3 Year 6.9% 5 Year 6.2% 10 Year 15 Year Since launch 7% Historical performance (Yearly) on absolute basis
Year Returns 2025 6.5% 2024 7.3% 2023 7.1% 2022 4.8% 2021 3.3% 2020 4.3% 2019 6.7% 2018 7.4% 2017 6.7% 2016 7.7% Fund Manager information for Aditya Birla Sun Life Liquid Fund
Name Since Tenure Sunaina Cunha 15 Jul 11 14.97 Yr. Kaustubh Gupta 15 Jul 11 14.97 Yr. Sanjay Pawar 1 Jul 22 4 Yr. Data below for Aditya Birla Sun Life Liquid Fund as on 30 Jun 26
Asset Allocation
Asset Class Value Cash 98.9% Debt 0.89% Other 0.21% Debt Sector Allocation
Sector Value Cash Equivalent 82.75% Corporate 9.15% Government 7.89% Credit Quality
Rating Value AAA 100% Top Securities Holdings / Portfolio
Name Holding Value Quantity Net Receivables / (Payables)
Net Current Assets | -4% -₹2,719 Cr Reverse Repo
CBLO/Reverse Repo | -4% ₹2,407 Cr India (Republic of)
- | -3% ₹2,138 Cr 215,312,800 09/07/2026 Maturing 182 DTB
Sovereign Bonds | -2% ₹1,665 Cr 167,000,000
↑ 150,000,000 India (Republic of)
- | -2% ₹1,561 Cr 157,397,500 Clearing Corporation Of India Limited
CBLO/Reverse Repo | -2% ₹1,515 Cr HDFC Bank Limited
Certificate of Deposit | -2% ₹1,378 Cr 28,000
↑ 28,000 Citibank Na/India (24/06/2026) #
Net Current Assets | -2% ₹1,198 Cr 24,000
↑ 24,000 City Union Bank Limited
Debentures | -2% ₹1,180 Cr 24,000
↑ 24,000 National Bank for Agriculture and Rural Development
Commercial Paper | -2% ₹1,009 Cr 20,500
↑ 20,500 6. UTI Liquid Cash Plan
UTI Liquid Cash Plan
Growth Launch Date 11 Dec 03 NAV (26 Jul 26) ₹457.304 ↑ 0.08 (0.02 %) Net Assets (Cr) ₹27,632 on 30 Jun 26 Category Debt - Liquid Fund AMC UTI Asset Management Company Ltd Rating ☆☆☆ Risk Low Expense Ratio 0.25 Sharpe Ratio 2.38 Information Ratio 0 Alpha Ratio 0 Min Investment 500 Min SIP Investment 1,500 Exit Load NIL Yield to Maturity 6.62% Effective Maturity 1 Month 6 Days Modified Duration 1 Month 5 Days Growth of 10,000 investment over the years.
Date Value 30 Jun 21 ₹10,000 30 Jun 22 ₹10,358 30 Jun 23 ₹11,024 30 Jun 24 ₹11,826 30 Jun 25 ₹12,674 30 Jun 26 ₹13,474 Returns for UTI Liquid Cash Plan
absolute basis & more than 1 year are on CAGR (Compound Annual Growth Rate) basis. as on 26 Jul 26 Duration Returns 1 Month 0.5% 3 Month 1.6% 6 Month 3.3% 1 Year 6.3% 3 Year 6.9% 5 Year 6.2% 10 Year 15 Year Since launch 6.8% Historical performance (Yearly) on absolute basis
Year Returns 2025 6.5% 2024 7.3% 2023 7% 2022 4.8% 2021 3.3% 2020 4.2% 2019 6.6% 2018 7.4% 2017 6.7% 2016 7.7% Fund Manager information for UTI Liquid Cash Plan
Name Since Tenure Amit Sharma 7 Jul 17 8.99 Yr. Data below for UTI Liquid Cash Plan as on 30 Jun 26
Asset Allocation
Asset Class Value Cash 98.63% Debt 1.16% Other 0.21% Debt Sector Allocation
Sector Value Cash Equivalent 83.81% Corporate 9.05% Government 6.93% Credit Quality
Rating Value AAA 100% Top Securities Holdings / Portfolio
Name Holding Value Quantity Net Current Assets
Net Current Assets | -12% ₹4,101 Cr India (Republic of)
- | -4% ₹1,238 Cr 12,500,000,000
↑ 5,000,000,000 Hindustan Petroleum Corp Ltd.
Commercial Paper | -3% ₹850 Cr 8,500,000,000
↑ 8,500,000,000 HDFC Bank Limited
Certificate of Deposit | -2% ₹787 Cr 8,000,000,000
↑ 8,000,000,000 Small Industries Development Bank Of India
Commercial Paper | -2% ₹697 Cr 7,000,000,000
↓ -2,000,000,000 Tbill
Sovereign Bonds | -2% ₹674 Cr 6,800,000,000
↑ 6,800,000,000 HDFC Bank Ltd.
Debentures | -2% ₹642 Cr 6,500,000,000 Central Bank of India
Domestic Bonds | -2% ₹592 Cr 6,000,000,000
↑ 6,000,000,000 Punjab & Sind Bank
Certificate of Deposit | -2% ₹500 Cr 5,000,000,000 Bharat Petroleum Corp Ltd.
Commercial Paper | -2% ₹499 Cr 5,000,000,000
↑ 5,000,000,000 7. Invesco India Liquid Fund
Invesco India Liquid Fund
Growth Launch Date 17 Nov 06 NAV (26 Jul 26) ₹3,831.16 ↑ 0.63 (0.02 %) Net Assets (Cr) ₹16,797 on 30 Jun 26 Category Debt - Liquid Fund AMC Invesco Asset Management (India) Private Ltd Rating ☆☆☆☆ Risk Low Expense Ratio 0.22 Sharpe Ratio 2.27 Information Ratio 0 Alpha Ratio 0 Min Investment 5,000 Min SIP Investment 500 Exit Load NIL Yield to Maturity 6.56% Effective Maturity 1 Month 1 Day Modified Duration 30 Days Growth of 10,000 investment over the years.
Date Value 30 Jun 21 ₹10,000 30 Jun 22 ₹10,358 30 Jun 23 ₹11,018 30 Jun 24 ₹11,821 30 Jun 25 ₹12,672 30 Jun 26 ₹13,470 Returns for Invesco India Liquid Fund
absolute basis & more than 1 year are on CAGR (Compound Annual Growth Rate) basis. as on 26 Jul 26 Duration Returns 1 Month 0.5% 3 Month 1.6% 6 Month 3.3% 1 Year 6.3% 3 Year 6.9% 5 Year 6.2% 10 Year 15 Year Since launch 7.1% Historical performance (Yearly) on absolute basis
Year Returns 2025 6.5% 2024 7.4% 2023 7% 2022 4.8% 2021 3.3% 2020 4.1% 2019 6.5% 2018 7.4% 2017 6.7% 2016 7.6% Fund Manager information for Invesco India Liquid Fund
Name Since Tenure Krishna Cheemalapati 25 Apr 11 15.19 Yr. Kunal Jain 2 Apr 26 0.24 Yr. Data below for Invesco India Liquid Fund as on 30 Jun 26
Asset Allocation
Asset Class Value Cash 99.23% Debt 0.53% Other 0.24% Debt Sector Allocation
Sector Value Cash Equivalent 89.18% Corporate 6.08% Government 4.49% Credit Quality
Rating Value AAA 100% Top Securities Holdings / Portfolio
Name Holding Value Quantity Triparty Repo
CBLO/Reverse Repo | -9% ₹1,753 Cr India (Republic of)
- | -3% ₹560 Cr 56,500,000
↑ 56,500,000 Triparty Repo
CBLO/Reverse Repo | -3% ₹500 Cr Union Bank of India
Debentures | -3% ₹493 Cr 50,000,000
↑ 50,000,000 HDFC Bank Ltd.
Debentures | -3% ₹492 Cr 50,000,000
↑ 50,000,000 HDFC Bank Limited
Certificate of Deposit | -3% ₹492 Cr 50,000,000
↑ 50,000,000 National Bank for Agriculture and Rural Development
Commercial Paper | -3% ₹492 Cr 50,000,000
↑ 50,000,000 Small Industries Development Bank of India
Commercial Paper | -3% ₹492 Cr 50,000,000
↑ 50,000,000 Tbill
Sovereign Bonds | -3% ₹485 Cr 48,500,000 Indian Bank
Domestic Bonds | -3% ₹468 Cr 47,500,000
↑ 47,500,000
यहां प्रदान की गई जानकारी सटीक है, यह सुनिश्चित करने के लिए सभी प्रयास किए गए हैं। हालांकि, डेटा की शुद्धता के संबंध में कोई गारंटी नहीं दी जाती है। कृपया कोई भी निवेश करने से पहले योजना सूचना दस्तावेज के साथ सत्यापित करें।


AMFI Registration No. 112358 | CIN: U74999MH2016PTC282153
Shepard Technologies Pvt. Ltd. (with ARN code 112358) makes no warranties or representations, express or implied, on products offered through the platform. It accepts no liability for any damages or losses, however caused, in connection with the use of, or on the reliance of its product or related services. Terms and conditions of the website are applicable.
©2026 Shepard Technologies Private Limited. All Rights Reserved
Research Highlights for Axis Liquid Fund