നിക്ഷേപിക്കാൻ ഏറ്റവും മികച്ച 5 ഇക്വിറ്റി എസ്ഐപി ഫണ്ടുകൾ
നിങ്ങളുടെ നിക്ഷേപങ്ങൾ എല്ലാത്തിലും അനുകൂലമാകണമെന്ന് നിങ്ങൾ ആഗ്രഹിക്കുന്നുവെങ്കിൽവിപണി വ്യവസ്ഥകൾ, എന്നിട്ട് നിങ്ങളുടെ നിക്ഷേപങ്ങൾ എടുക്കുകഎസ്.ഐ.പി വഴി! സിസ്റ്റമാറ്റിക് ഇൻവെസ്റ്റ്മെന്റ് പ്ലാനുകൾ (എസ്ഐപി) ഏറ്റവും കാര്യക്ഷമമായ മാർഗമായി കണക്കാക്കപ്പെടുന്നുമ്യൂച്വൽ ഫണ്ടുകളിൽ നിക്ഷേപിക്കുന്നു. നിങ്ങൾ ഇക്വിറ്റികളിൽ നിക്ഷേപിക്കാൻ പദ്ധതിയിടുകയാണെങ്കിൽ, ദീർഘകാല വരുമാനം നേടുന്നതിനുള്ള ഏറ്റവും നല്ല മാർഗമാണ് എസ്ഐപികൾ. മികച്ച ഇക്വിറ്റി എസ്ഐപി ഫണ്ടുകൾക്ക് ദീർഘകാലാടിസ്ഥാനത്തിൽ നിങ്ങൾക്ക് ആവശ്യമുള്ള വരുമാനം നൽകാനാകുംസാമ്പത്തിക ലക്ഷ്യങ്ങൾ. അതിനാൽ, എസ്ഐപി എങ്ങനെ പ്രവർത്തിക്കുന്നുവെന്ന് നോക്കാം, അതിന്റെ പ്രയോജനങ്ങൾSIP നിക്ഷേപം, a യുടെ കാര്യമായ ഉപയോഗംസിപ്പ് കാൽക്കുലേറ്റർ ഇക്വിറ്റി നിക്ഷേപങ്ങൾക്കായുള്ള മികച്ച പ്രകടനം നടത്തുന്ന SIP ഫണ്ടുകൾക്കൊപ്പം.
Talk to our investment specialist
ഇക്വിറ്റി മ്യൂച്വൽ ഫണ്ടുകൾക്കായി ചിട്ടയായ നിക്ഷേപം
നിക്ഷേപകർ ഇക്വിറ്റികളിൽ നിക്ഷേപിക്കാൻ പദ്ധതിയിടുമ്പോൾ, ആദായത്തിന്റെ സ്ഥിരതയെക്കുറിച്ച് അവർ പലപ്പോഴും സംശയിക്കുന്നു. കാരണം, അവ വിപണിയുമായി ബന്ധപ്പെട്ടിരിക്കുന്നു, അവ പലപ്പോഴും അസ്ഥിരതയ്ക്ക് വിധേയമാകുന്നു. അതിനാൽ, അത്തരം ചാഞ്ചാട്ടം സന്തുലിതമാക്കുന്നതിനും ദീർഘകാല സ്ഥിരമായ വരുമാനം ഉറപ്പാക്കുന്നതിനും, ഇക്വിറ്റി നിക്ഷേപങ്ങളിൽ എസ്ഐപികൾ വളരെ ശുപാർശ ചെയ്യുന്നു. ചരിത്രപരമായി, മോശം മാർക്കറ്റ് ഘട്ടത്തിൽ, SIP റൂട്ട് സ്വീകരിച്ച നിക്ഷേപകർ ലംപ് സം റൂട്ട് എടുത്തവരേക്കാൾ കൂടുതൽ സ്ഥിരമായ വരുമാനം നേടിയതായി ശ്രദ്ധയിൽപ്പെട്ടിട്ടുണ്ട്. ഒറ്റയടിക്ക് നടക്കുന്ന ഒറ്റത്തവണ നിക്ഷേപത്തിൽ നിന്ന് വ്യത്യസ്തമായി, SIP-യുടെ നിക്ഷേപം കാലക്രമേണ വ്യാപിക്കുന്നു. അതിനാൽ, SIP-യിലെ നിങ്ങളുടെ പണം ഓരോ ദിവസവും വളരാൻ തുടങ്ങുന്നു (സ്റ്റോക്ക് മാർക്കറ്റിൽ നിക്ഷേപിക്കുന്നത്).
ഒരു വ്യവസ്ഥാപിതനിക്ഷേപ പദ്ധതി പോലുള്ള ദീർഘകാല സാമ്പത്തിക ലക്ഷ്യങ്ങൾ കൈവരിക്കുന്നതിനും വ്യാപകമായി കണക്കാക്കപ്പെടുന്നുവിരമിക്കൽ ആസൂത്രണം, കുട്ടിയുടെ വിദ്യാഭ്യാസം, ഒരു വീട്/കാർ അല്ലെങ്കിൽ മറ്റേതെങ്കിലും സ്വത്ത് വാങ്ങൽ. കുറച്ച് കൂടി നോക്കുന്നതിന് മുമ്പ്നിക്ഷേപത്തിന്റെ നേട്ടങ്ങൾ ഒരു എസ്ഐപിയിൽ, നിക്ഷേപിക്കുന്നതിനുള്ള മികച്ച ചില ഇക്വിറ്റി എസ്ഐപി ഫണ്ടുകൾ പരിശോധിക്കാം.
ഇക്വിറ്റി ഫണ്ടുകൾക്കായുള്ള മികച്ച SIP പ്ലാനുകൾ 2022
മികച്ച ലാർജ് ക്യാപ് ഇക്വിറ്റി SIP ഫണ്ടുകൾ
Fund NAV Net Assets (Cr) Min SIP Investment 3 MO (%) 6 MO (%) 1 YR (%) 3 YR (%) 5 YR (%) 2025 (%) JM Core 11 Fund Growth ₹20.1414
↓ -0.04 ₹279 500 5.5 1.7 2.2 13.6 13.7 -1.9 SBI Bluechip Fund Growth ₹93.6585
↓ -0.17 ₹53,527 500 1.5 -2.2 0.3 9.7 10.7 9.7 Indiabulls Blue Chip Fund Growth ₹42.71
↓ -0.07 ₹129 500 0.3 -2.3 -0.7 10.2 9.8 7.5 Nippon India Large Cap Fund Growth ₹89.8706
↑ 0.03 ₹51,660 100 0.9 -2.5 -1.4 12.5 14.8 9.2 ICICI Prudential Bluechip Fund Growth ₹108.42
↓ -0.12 ₹76,297 100 0.1 -4.4 -2.2 12.4 12.9 11.3 Note: Returns up to 1 year are on absolute basis & more than 1 year are on CAGR basis. as on 16 Jul 26 Research Highlights & Commentary of 5 Funds showcased
Commentary JM Core 11 Fund SBI Bluechip Fund Indiabulls Blue Chip Fund Nippon India Large Cap Fund ICICI Prudential Bluechip Fund Point 1 Bottom quartile AUM (₹279 Cr). Upper mid AUM (₹53,527 Cr). Bottom quartile AUM (₹129 Cr). Lower mid AUM (₹51,660 Cr). Highest AUM (₹76,297 Cr). Point 2 Established history (18+ yrs). Oldest track record among peers (20 yrs). Established history (14+ yrs). Established history (18+ yrs). Established history (18+ yrs). Point 3 Top rated. Rating: 4★ (upper mid). Rating: 4★ (lower mid). Rating: 4★ (bottom quartile). Rating: 4★ (bottom quartile). Point 4 Risk profile: High. Risk profile: Moderately High. Risk profile: Moderately High. Risk profile: Moderately High. Risk profile: Moderately High. Point 5 5Y return: 13.65% (upper mid). 5Y return: 10.70% (bottom quartile). 5Y return: 9.79% (bottom quartile). 5Y return: 14.82% (top quartile). 5Y return: 12.94% (lower mid). Point 6 3Y return: 13.60% (top quartile). 3Y return: 9.66% (bottom quartile). 3Y return: 10.20% (bottom quartile). 3Y return: 12.55% (upper mid). 3Y return: 12.43% (lower mid). Point 7 1Y return: 2.22% (top quartile). 1Y return: 0.26% (upper mid). 1Y return: -0.70% (lower mid). 1Y return: -1.35% (bottom quartile). 1Y return: -2.20% (bottom quartile). Point 8 Alpha: -0.12 (bottom quartile). Alpha: 2.05 (top quartile). Alpha: 1.21 (upper mid). Alpha: 0.46 (lower mid). Alpha: -1.97 (bottom quartile). Point 9 Sharpe: -0.23 (top quartile). Sharpe: -0.26 (upper mid). Sharpe: -0.28 (lower mid). Sharpe: -0.35 (bottom quartile). Sharpe: -0.48 (bottom quartile). Point 10 Information ratio: 0.10 (lower mid). Information ratio: -0.15 (bottom quartile). Information ratio: -0.06 (bottom quartile). Information ratio: 1.03 (top quartile). Information ratio: 0.90 (upper mid). JM Core 11 Fund
SBI Bluechip Fund
Indiabulls Blue Chip Fund
Nippon India Large Cap Fund
ICICI Prudential Bluechip Fund
മികച്ച ലാർജ് & മിഡ് ക്യാപ് ഇക്വിറ്റി SIP ഫണ്ടുകൾ
Fund NAV Net Assets (Cr) Min SIP Investment 3 MO (%) 6 MO (%) 1 YR (%) 3 YR (%) 5 YR (%) 2025 (%) Invesco India Growth Opportunities Fund Growth ₹109.98
↑ 0.19 ₹10,153 100 12.6 12.1 7.5 23.5 17.3 4.7 Kotak Equity Opportunities Fund Growth ₹354.479
↑ 0.19 ₹30,127 1,000 3.2 0.7 2.8 15 14.2 5.6 DSP Equity Opportunities Fund Growth ₹623.748
↓ -2.87 ₹17,370 500 1.9 -2.8 -0.5 15.7 12.6 7.1 SBI Large and Midcap Fund Growth ₹654.43
↑ 2.77 ₹39,424 500 4.1 1.1 4 14.3 13.8 10.1 Bandhan Core Equity Fund Growth ₹139.85
↓ -0.87 ₹17,461 100 3.1 1.6 3.7 19.1 16.5 7.5 Note: Returns up to 1 year are on absolute basis & more than 1 year are on CAGR basis. as on 16 Jul 26 Research Highlights & Commentary of 5 Funds showcased
Commentary Invesco India Growth Opportunities Fund Kotak Equity Opportunities Fund DSP Equity Opportunities Fund SBI Large and Midcap Fund Bandhan Core Equity Fund Point 1 Bottom quartile AUM (₹10,153 Cr). Upper mid AUM (₹30,127 Cr). Bottom quartile AUM (₹17,370 Cr). Highest AUM (₹39,424 Cr). Lower mid AUM (₹17,461 Cr). Point 2 Established history (18+ yrs). Established history (21+ yrs). Oldest track record among peers (26 yrs). Established history (21+ yrs). Established history (20+ yrs). Point 3 Top rated. Rating: 5★ (upper mid). Rating: 5★ (lower mid). Rating: 4★ (bottom quartile). Rating: 4★ (bottom quartile). Point 4 Risk profile: Moderately High. Risk profile: Moderately High. Risk profile: Moderately High. Risk profile: Moderately High. Risk profile: Moderately High. Point 5 5Y return: 17.28% (top quartile). 5Y return: 14.21% (lower mid). 5Y return: 12.60% (bottom quartile). 5Y return: 13.83% (bottom quartile). 5Y return: 16.53% (upper mid). Point 6 3Y return: 23.50% (top quartile). 3Y return: 15.05% (bottom quartile). 3Y return: 15.73% (lower mid). 3Y return: 14.29% (bottom quartile). 3Y return: 19.14% (upper mid). Point 7 1Y return: 7.49% (top quartile). 1Y return: 2.83% (bottom quartile). 1Y return: -0.46% (bottom quartile). 1Y return: 4.00% (upper mid). 1Y return: 3.73% (lower mid). Point 8 Alpha: 2.71 (upper mid). Alpha: -1.30 (bottom quartile). Alpha: -4.38 (bottom quartile). Alpha: 1.83 (lower mid). Alpha: 2.88 (top quartile). Point 9 Sharpe: 0.07 (upper mid). Sharpe: -0.14 (bottom quartile). Sharpe: -0.33 (bottom quartile). Sharpe: 0.05 (lower mid). Sharpe: 0.10 (top quartile). Point 10 Information ratio: 0.87 (upper mid). Information ratio: -0.30 (bottom quartile). Information ratio: 0.03 (lower mid). Information ratio: -0.43 (bottom quartile). Information ratio: 1.61 (top quartile). Invesco India Growth Opportunities Fund
Kotak Equity Opportunities Fund
DSP Equity Opportunities Fund
SBI Large and Midcap Fund
Bandhan Core Equity Fund
മികച്ച മിഡ് ക്യാപ് ഇക്വിറ്റി SIP ഫണ്ടുകൾ
Fund NAV Net Assets (Cr) Min SIP Investment 3 MO (%) 6 MO (%) 1 YR (%) 3 YR (%) 5 YR (%) 2025 (%) Sundaram Mid Cap Fund Growth ₹1,491.24
↓ -5.43 ₹13,687 100 6.4 6.2 6.9 21 17.7 4.1 Kotak Emerging Equity Scheme Growth ₹146.351
↓ -0.74 ₹64,749 1,000 7.4 9.1 6.8 19.9 17.2 1.8 Taurus Discovery (Midcap) Fund Growth ₹121.04
↑ 0.14 ₹125 1,000 5 2.5 -3.7 11.2 11.2 0.8 BNP Paribas Mid Cap Fund Growth ₹111.712
↓ -0.73 ₹2,461 300 6.3 8 10.4 18.8 15.2 2.5 Edelweiss Mid Cap Fund Growth ₹107.761
↓ -0.57 ₹16,849 500 6 4.8 5.2 22.2 17.9 3.8 Note: Returns up to 1 year are on absolute basis & more than 1 year are on CAGR basis. as on 16 Jul 26 Research Highlights & Commentary of 5 Funds showcased
Commentary Sundaram Mid Cap Fund Kotak Emerging Equity Scheme Taurus Discovery (Midcap) Fund BNP Paribas Mid Cap Fund Edelweiss Mid Cap Fund Point 1 Lower mid AUM (₹13,687 Cr). Highest AUM (₹64,749 Cr). Bottom quartile AUM (₹125 Cr). Bottom quartile AUM (₹2,461 Cr). Upper mid AUM (₹16,849 Cr). Point 2 Established history (23+ yrs). Established history (19+ yrs). Oldest track record among peers (31 yrs). Established history (20+ yrs). Established history (18+ yrs). Point 3 Top rated. Rating: 4★ (upper mid). Rating: 4★ (lower mid). Rating: 3★ (bottom quartile). Rating: 3★ (bottom quartile). Point 4 Risk profile: Moderately High. Risk profile: Moderately High. Risk profile: Moderately High. Risk profile: High. Risk profile: High. Point 5 5Y return: 17.74% (upper mid). 5Y return: 17.16% (lower mid). 5Y return: 11.18% (bottom quartile). 5Y return: 15.22% (bottom quartile). 5Y return: 17.94% (top quartile). Point 6 3Y return: 21.05% (upper mid). 3Y return: 19.92% (lower mid). 3Y return: 11.16% (bottom quartile). 3Y return: 18.79% (bottom quartile). 3Y return: 22.23% (top quartile). Point 7 1Y return: 6.86% (upper mid). 1Y return: 6.76% (lower mid). 1Y return: -3.71% (bottom quartile). 1Y return: 10.44% (top quartile). 1Y return: 5.25% (bottom quartile). Point 8 Alpha: -0.11 (bottom quartile). Alpha: 0.18 (lower mid). Alpha: -9.74 (bottom quartile). Alpha: 2.64 (top quartile). Alpha: 0.35 (upper mid). Point 9 Sharpe: 0.17 (bottom quartile). Sharpe: 0.18 (lower mid). Sharpe: -0.32 (bottom quartile). Sharpe: 0.34 (top quartile). Sharpe: 0.19 (upper mid). Point 10 Information ratio: 0.23 (upper mid). Information ratio: -0.33 (lower mid). Information ratio: -2.03 (bottom quartile). Information ratio: -0.33 (bottom quartile). Information ratio: 0.30 (top quartile). Sundaram Mid Cap Fund
Kotak Emerging Equity Scheme
Taurus Discovery (Midcap) Fund
BNP Paribas Mid Cap Fund
Edelweiss Mid Cap Fund
മികച്ച സ്മോൾ ക്യാപ് ഇക്വിറ്റി SIP ഫണ്ടുകൾ
Fund NAV Net Assets (Cr) Min SIP Investment 3 MO (%) 6 MO (%) 1 YR (%) 3 YR (%) 5 YR (%) 2025 (%) Aditya Birla Sun Life Small Cap Fund Growth ₹96.1074
↑ 0.04 ₹5,453 1,000 13.2 15.4 8.1 16.1 12.4 -3.7 SBI Small Cap Fund Growth ₹180.96
↓ -0.60 ₹37,395 500 10.6 11.2 1.7 12.9 13.7 -4.9 DSP Small Cap Fund Growth ₹223.022
↓ -0.10 ₹18,358 500 11.8 16.6 9.1 18.7 17.3 -2.8 Nippon India Small Cap Fund Growth ₹181.332
↑ 0.01 ₹74,604 100 9.7 12.4 3.5 17.4 18.9 -4.7 Franklin India Smaller Companies Fund Growth ₹179.413
↓ -0.12 ₹13,847 500 9 10.3 0.3 15.7 16.6 -8.4 Note: Returns up to 1 year are on absolute basis & more than 1 year are on CAGR basis. as on 16 Jul 26 Research Highlights & Commentary of 5 Funds showcased
Commentary Aditya Birla Sun Life Small Cap Fund SBI Small Cap Fund DSP Small Cap Fund Nippon India Small Cap Fund Franklin India Smaller Companies Fund Point 1 Bottom quartile AUM (₹5,453 Cr). Upper mid AUM (₹37,395 Cr). Lower mid AUM (₹18,358 Cr). Highest AUM (₹74,604 Cr). Bottom quartile AUM (₹13,847 Cr). Point 2 Established history (19+ yrs). Established history (16+ yrs). Established history (19+ yrs). Established history (15+ yrs). Oldest track record among peers (20 yrs). Point 3 Top rated. Rating: 5★ (upper mid). Rating: 4★ (lower mid). Rating: 4★ (bottom quartile). Rating: 4★ (bottom quartile). Point 4 Risk profile: Moderately High. Risk profile: Moderately High. Risk profile: Moderately High. Risk profile: Moderately High. Risk profile: Moderately High. Point 5 5Y return: 12.44% (bottom quartile). 5Y return: 13.65% (bottom quartile). 5Y return: 17.26% (upper mid). 5Y return: 18.88% (top quartile). 5Y return: 16.56% (lower mid). Point 6 3Y return: 16.13% (lower mid). 3Y return: 12.94% (bottom quartile). 3Y return: 18.66% (top quartile). 3Y return: 17.38% (upper mid). 3Y return: 15.70% (bottom quartile). Point 7 1Y return: 8.07% (upper mid). 1Y return: 1.66% (bottom quartile). 1Y return: 9.06% (top quartile). 1Y return: 3.52% (lower mid). 1Y return: 0.35% (bottom quartile). Point 8 Alpha: 0.00 (upper mid). Alpha: 0.00 (lower mid). Alpha: 0.00 (bottom quartile). Alpha: 2.35 (top quartile). Alpha: -2.10 (bottom quartile). Point 9 Sharpe: 0.23 (top quartile). Sharpe: -0.22 (bottom quartile). Sharpe: 0.13 (upper mid). Sharpe: 0.05 (lower mid). Sharpe: -0.15 (bottom quartile). Point 10 Information ratio: 0.00 (top quartile). Information ratio: 0.00 (upper mid). Information ratio: 0.00 (lower mid). Information ratio: -0.24 (bottom quartile). Information ratio: -0.62 (bottom quartile). Aditya Birla Sun Life Small Cap Fund
SBI Small Cap Fund
DSP Small Cap Fund
Nippon India Small Cap Fund
Franklin India Smaller Companies Fund
മികച്ച മൾട്ടി ക്യാപ് ഇക്വിറ്റി SIP ഫണ്ടുകൾ
Fund NAV Net Assets (Cr) Min SIP Investment 3 MO (%) 6 MO (%) 1 YR (%) 3 YR (%) 5 YR (%) 2025 (%) Kotak Standard Multicap Fund Growth ₹85.47
↓ -0.14 ₹54,801 500 0.9 -1.6 -0.7 12.8 11.5 9.5 Mirae Asset India Equity Fund Growth ₹111.966
↓ -0.08 ₹37,692 1,000 2.4 -3.5 -1.6 9.2 9.1 10.2 Motilal Oswal Multicap 35 Fund Growth ₹60.4684
↓ -0.29 ₹12,937 500 7.1 1.2 -3.8 18.3 12.1 -5.6 BNP Paribas Multi Cap Fund Growth ₹73.5154
↓ -0.01 ₹588 300 -4.6 -2.6 19.3 17.3 13.6 Aditya Birla Sun Life Equity Fund Growth ₹1,911.97
↓ -2.14 ₹26,032 100 4.8 2.5 6.2 15.2 12.2 11.2 Note: Returns up to 1 year are on absolute basis & more than 1 year are on CAGR basis. as on 16 Jul 26 Research Highlights & Commentary of 5 Funds showcased
Commentary Kotak Standard Multicap Fund Mirae Asset India Equity Fund Motilal Oswal Multicap 35 Fund BNP Paribas Multi Cap Fund Aditya Birla Sun Life Equity Fund Point 1 Highest AUM (₹54,801 Cr). Upper mid AUM (₹37,692 Cr). Bottom quartile AUM (₹12,937 Cr). Bottom quartile AUM (₹588 Cr). Lower mid AUM (₹26,032 Cr). Point 2 Established history (16+ yrs). Established history (18+ yrs). Established history (12+ yrs). Established history (20+ yrs). Oldest track record among peers (27 yrs). Point 3 Top rated. Rating: 5★ (upper mid). Rating: 5★ (lower mid). Rating: 4★ (bottom quartile). Rating: 4★ (bottom quartile). Point 4 Risk profile: Moderately High. Risk profile: Moderately High. Risk profile: Moderately High. Risk profile: Moderately High. Risk profile: Moderately High. Point 5 5Y return: 11.49% (bottom quartile). 5Y return: 9.10% (bottom quartile). 5Y return: 12.09% (lower mid). 5Y return: 13.57% (top quartile). 5Y return: 12.18% (upper mid). Point 6 3Y return: 12.79% (bottom quartile). 3Y return: 9.17% (bottom quartile). 3Y return: 18.34% (top quartile). 3Y return: 17.28% (upper mid). 3Y return: 15.23% (lower mid). Point 7 1Y return: -0.66% (lower mid). 1Y return: -1.56% (bottom quartile). 1Y return: -3.77% (bottom quartile). 1Y return: 19.34% (top quartile). 1Y return: 6.18% (upper mid). Point 8 Alpha: -0.62 (lower mid). Alpha: -0.89 (bottom quartile). Alpha: -5.87 (bottom quartile). Alpha: 0.00 (upper mid). Alpha: 4.07 (top quartile). Point 9 Sharpe: -0.24 (lower mid). Sharpe: -0.40 (bottom quartile). Sharpe: -0.52 (bottom quartile). Sharpe: 2.86 (top quartile). Sharpe: 0.04 (upper mid). Point 10 Information ratio: -0.05 (bottom quartile). Information ratio: -0.60 (bottom quartile). Information ratio: 0.47 (upper mid). Information ratio: 0.00 (lower mid). Information ratio: 1.20 (top quartile). Kotak Standard Multicap Fund
Mirae Asset India Equity Fund
Motilal Oswal Multicap 35 Fund
BNP Paribas Multi Cap Fund
Aditya Birla Sun Life Equity Fund
മികച്ച സെക്ടർ ഇക്വിറ്റി SIP ഫണ്ടുകൾ
Fund NAV Net Assets (Cr) Min SIP Investment 3 MO (%) 6 MO (%) 1 YR (%) 3 YR (%) 5 YR (%) 2025 (%) DSP Natural Resources and New Energy Fund Growth ₹106.16
↑ 0.16 ₹2,457 500 -2.4 3.5 18.1 19.6 15.8 17.5 Aditya Birla Sun Life Banking And Financial Services Fund Growth ₹63.65
↓ -0.55 ₹3,466 1,000 3.1 -1.5 2.6 11.7 11.3 17.5 Franklin Build India Fund Growth ₹145.465
↓ -0.21 ₹3,160 500 -0.7 3.4 0.6 20.6 19.7 3.7 ICICI Prudential Banking and Financial Services Fund Growth ₹133.26
↓ -0.77 ₹10,643 100 2.2 -3.5 -2.3 10.6 9.7 15.9 Bandhan Infrastructure Fund Growth ₹50.125
↓ -0.10 ₹1,495 100 5.2 7.8 -3.2 18.7 17.1 -6.9 Note: Returns up to 1 year are on absolute basis & more than 1 year are on CAGR basis. as on 15 Jul 26 Research Highlights & Commentary of 5 Funds showcased
Commentary DSP Natural Resources and New Energy Fund Aditya Birla Sun Life Banking And Financial Services Fund Franklin Build India Fund ICICI Prudential Banking and Financial Services Fund Bandhan Infrastructure Fund Point 1 Bottom quartile AUM (₹2,457 Cr). Upper mid AUM (₹3,466 Cr). Lower mid AUM (₹3,160 Cr). Highest AUM (₹10,643 Cr). Bottom quartile AUM (₹1,495 Cr). Point 2 Oldest track record among peers (18 yrs). Established history (12+ yrs). Established history (16+ yrs). Established history (17+ yrs). Established history (15+ yrs). Point 3 Top rated. Rating: 5★ (upper mid). Rating: 5★ (lower mid). Rating: 5★ (bottom quartile). Rating: 5★ (bottom quartile). Point 4 Risk profile: High. Risk profile: High. Risk profile: High. Risk profile: High. Risk profile: High. Point 5 5Y return: 15.75% (lower mid). 5Y return: 11.33% (bottom quartile). 5Y return: 19.73% (top quartile). 5Y return: 9.66% (bottom quartile). 5Y return: 17.05% (upper mid). Point 6 3Y return: 19.61% (upper mid). 3Y return: 11.65% (bottom quartile). 3Y return: 20.60% (top quartile). 3Y return: 10.58% (bottom quartile). 3Y return: 18.70% (lower mid). Point 7 1Y return: 18.11% (top quartile). 1Y return: 2.58% (upper mid). 1Y return: 0.62% (lower mid). 1Y return: -2.27% (bottom quartile). 1Y return: -3.18% (bottom quartile). Point 8 Alpha: 0.00 (upper mid). Alpha: 3.78 (top quartile). Alpha: 0.00 (lower mid). Alpha: -2.48 (bottom quartile). Alpha: 0.00 (bottom quartile). Point 9 Sharpe: 1.33 (top quartile). Sharpe: -0.15 (lower mid). Sharpe: 0.01 (upper mid). Sharpe: -0.46 (bottom quartile). Sharpe: -0.26 (bottom quartile). Point 10 Information ratio: 0.00 (lower mid). Information ratio: 0.28 (top quartile). Information ratio: 0.00 (bottom quartile). Information ratio: 0.01 (upper mid). Information ratio: 0.00 (bottom quartile). DSP Natural Resources and New Energy Fund
Aditya Birla Sun Life Banking And Financial Services Fund
Franklin Build India Fund
ICICI Prudential Banking and Financial Services Fund
Bandhan Infrastructure Fund
മികച്ച ELSS SIP ഫണ്ടുകൾ
Fund NAV Net Assets (Cr) Min SIP Investment 3 MO (%) 6 MO (%) 1 YR (%) 3 YR (%) 5 YR (%) 2025 (%) Tata India Tax Savings Fund Growth ₹46.4266
↓ -0.09 ₹4,516 500 3.6 2.3 3.4 13.1 12.8 4.9 Bandhan Tax Advantage (ELSS) Fund Growth ₹153.451
↓ -0.43 ₹6,767 500 2.4 -1.2 0 10.2 11.7 8 Aditya Birla Sun Life Tax Relief '96 Growth ₹61.79
↓ -0.07 ₹14,249 500 3.2 -0.4 1.2 12.1 8.6 9.3 DSP Tax Saver Fund Growth ₹139.251
↓ -0.45 ₹16,156 500 1.8 -3.5 -1.8 15 12.8 7.5 HDFC Long Term Advantage Fund Growth ₹595.168
↑ 0.28 ₹1,318 500 1.2 15.4 35.5 20.6 17.4 Note: Returns up to 1 year are on absolute basis & more than 1 year are on CAGR basis. as on 16 Jul 26 Research Highlights & Commentary of 5 Funds showcased
Commentary Tata India Tax Savings Fund Bandhan Tax Advantage (ELSS) Fund Aditya Birla Sun Life Tax Relief '96 DSP Tax Saver Fund HDFC Long Term Advantage Fund Point 1 Bottom quartile AUM (₹4,516 Cr). Lower mid AUM (₹6,767 Cr). Upper mid AUM (₹14,249 Cr). Highest AUM (₹16,156 Cr). Bottom quartile AUM (₹1,318 Cr). Point 2 Established history (11+ yrs). Established history (17+ yrs). Established history (18+ yrs). Established history (19+ yrs). Oldest track record among peers (25 yrs). Point 3 Top rated. Rating: 5★ (upper mid). Rating: 4★ (lower mid). Rating: 4★ (bottom quartile). Rating: 3★ (bottom quartile). Point 4 Risk profile: Moderately High. Risk profile: Moderately High. Risk profile: Moderately High. Risk profile: Moderately High. Risk profile: Moderately High. Point 5 5Y return: 12.80% (lower mid). 5Y return: 11.68% (bottom quartile). 5Y return: 8.63% (bottom quartile). 5Y return: 12.84% (upper mid). 5Y return: 17.39% (top quartile). Point 6 3Y return: 13.13% (lower mid). 3Y return: 10.20% (bottom quartile). 3Y return: 12.06% (bottom quartile). 3Y return: 15.04% (upper mid). 3Y return: 20.64% (top quartile). Point 7 1Y return: 3.39% (upper mid). 1Y return: 0.04% (bottom quartile). 1Y return: 1.23% (lower mid). 1Y return: -1.76% (bottom quartile). 1Y return: 35.51% (top quartile). Point 8 Alpha: 3.02 (top quartile). Alpha: -0.53 (bottom quartile). Alpha: 0.39 (lower mid). Alpha: -3.11 (bottom quartile). Alpha: 1.75 (upper mid). Point 9 Sharpe: -0.04 (upper mid). Sharpe: -0.26 (bottom quartile). Sharpe: -0.18 (lower mid). Sharpe: -0.38 (bottom quartile). Sharpe: 2.27 (top quartile). Point 10 Information ratio: 0.21 (upper mid). Information ratio: -0.60 (bottom quartile). Information ratio: -0.22 (bottom quartile). Information ratio: 0.60 (top quartile). Information ratio: -0.15 (lower mid). Tata India Tax Savings Fund
Bandhan Tax Advantage (ELSS) Fund
Aditya Birla Sun Life Tax Relief '96
DSP Tax Saver Fund
HDFC Long Term Advantage Fund
മികച്ച മൂല്യം ഇക്വിറ്റി SIP ഫണ്ടുകൾ
Fund NAV Net Assets (Cr) Min SIP Investment 3 MO (%) 6 MO (%) 1 YR (%) 3 YR (%) 5 YR (%) 2025 (%) Tata Equity PE Fund Growth ₹347.604
↓ -0.97 ₹8,346 150 0.4 -3.4 -2.2 13.2 14.2 3.7 JM Value Fund Growth ₹93.9127
↓ -0.10 ₹805 500 3.7 0.4 -7 13.8 14.7 -4.4 Aditya Birla Sun Life Pure Value Fund Growth ₹136.21
↑ 0.11 ₹6,530 1,000 6.9 5.8 7.3 17.1 14.4 2.6 HDFC Capital Builder Value Fund Growth ₹779.998
↓ -1.27 ₹7,314 300 4.5 2 3.6 16.4 14.6 8.6 Bandhan Sterling Value Fund Growth ₹146.125
↓ -0.42 ₹9,823 100 1.8 -1.9 -2 11 13 5 Note: Returns up to 1 year are on absolute basis & more than 1 year are on CAGR basis. as on 16 Jul 26 Research Highlights & Commentary of 5 Funds showcased
Commentary Tata Equity PE Fund JM Value Fund Aditya Birla Sun Life Pure Value Fund HDFC Capital Builder Value Fund Bandhan Sterling Value Fund Point 1 Upper mid AUM (₹8,346 Cr). Bottom quartile AUM (₹805 Cr). Bottom quartile AUM (₹6,530 Cr). Lower mid AUM (₹7,314 Cr). Highest AUM (₹9,823 Cr). Point 2 Established history (22+ yrs). Established history (29+ yrs). Established history (18+ yrs). Oldest track record among peers (32 yrs). Established history (18+ yrs). Point 3 Top rated. Rating: 4★ (upper mid). Rating: 3★ (lower mid). Rating: 3★ (bottom quartile). Rating: 3★ (bottom quartile). Point 4 Risk profile: Moderately High. Risk profile: High. Risk profile: Moderately High. Risk profile: Moderately High. Risk profile: Moderately High. Point 5 5Y return: 14.19% (bottom quartile). 5Y return: 14.67% (top quartile). 5Y return: 14.39% (lower mid). 5Y return: 14.59% (upper mid). 5Y return: 12.97% (bottom quartile). Point 6 3Y return: 13.22% (bottom quartile). 3Y return: 13.78% (lower mid). 3Y return: 17.11% (top quartile). 3Y return: 16.42% (upper mid). 3Y return: 11.02% (bottom quartile). Point 7 1Y return: -2.18% (bottom quartile). 1Y return: -7.02% (bottom quartile). 1Y return: 7.25% (top quartile). 1Y return: 3.62% (upper mid). 1Y return: -2.00% (lower mid). Point 8 Alpha: -1.12 (lower mid). Alpha: -5.51 (bottom quartile). Alpha: 6.66 (top quartile). Alpha: 2.21 (upper mid). Alpha: -2.02 (bottom quartile). Point 9 Sharpe: -0.27 (lower mid). Sharpe: -0.48 (bottom quartile). Sharpe: 0.14 (top quartile). Sharpe: -0.08 (upper mid). Sharpe: -0.35 (bottom quartile). Point 10 Information ratio: 0.34 (lower mid). Information ratio: 0.30 (bottom quartile). Information ratio: 0.75 (upper mid). Information ratio: 1.34 (top quartile). Information ratio: -0.20 (bottom quartile). Tata Equity PE Fund
JM Value Fund
Aditya Birla Sun Life Pure Value Fund
HDFC Capital Builder Value Fund
Bandhan Sterling Value Fund
മികച്ച ഫോക്കസ്ഡ് ഇക്വിറ്റി SIP ഫണ്ടുകൾ
Fund NAV Net Assets (Cr) Min SIP Investment 3 MO (%) 6 MO (%) 1 YR (%) 3 YR (%) 5 YR (%) 2025 (%) Axis Focused 25 Fund Growth ₹54.11
↓ -0.14 ₹10,666 500 6 0.9 -2.5 8.2 5.2 2.5 Aditya Birla Sun Life Focused Equity Fund Growth ₹146.094
↓ -0.28 ₹7,732 1,000 2.4 -2.1 2.6 13.4 11.7 10.1 Sundaram Select Focus Fund Growth ₹264.968
↓ -1.18 ₹1,354 100 -5 8.5 24.5 17 17.3 Motilal Oswal Focused 25 Fund Growth ₹49.61
↓ -0.10 ₹1,557 500 13.5 13.9 11.8 11.5 9.4 -1.7 HDFC Focused 30 Fund Growth ₹232.656
↓ -0.18 ₹26,082 300 2.5 -2.2 0.7 16.4 18.4 10.9 Note: Returns up to 1 year are on absolute basis & more than 1 year are on CAGR basis. as on 16 Jul 26 Research Highlights & Commentary of 5 Funds showcased
Commentary Axis Focused 25 Fund Aditya Birla Sun Life Focused Equity Fund Sundaram Select Focus Fund Motilal Oswal Focused 25 Fund HDFC Focused 30 Fund Point 1 Upper mid AUM (₹10,666 Cr). Lower mid AUM (₹7,732 Cr). Bottom quartile AUM (₹1,354 Cr). Bottom quartile AUM (₹1,557 Cr). Highest AUM (₹26,082 Cr). Point 2 Established history (14+ yrs). Established history (20+ yrs). Oldest track record among peers (23 yrs). Established history (13+ yrs). Established history (21+ yrs). Point 3 Top rated. Rating: 4★ (upper mid). Rating: 3★ (lower mid). Rating: 3★ (bottom quartile). Rating: 3★ (bottom quartile). Point 4 Risk profile: Moderately High. Risk profile: Moderately High. Risk profile: Moderately High. Risk profile: Moderately High. Risk profile: Moderately High. Point 5 5Y return: 5.23% (bottom quartile). 5Y return: 11.68% (lower mid). 5Y return: 17.29% (upper mid). 5Y return: 9.36% (bottom quartile). 5Y return: 18.37% (top quartile). Point 6 3Y return: 8.18% (bottom quartile). 3Y return: 13.39% (lower mid). 3Y return: 17.03% (top quartile). 3Y return: 11.46% (bottom quartile). 3Y return: 16.41% (upper mid). Point 7 1Y return: -2.47% (bottom quartile). 1Y return: 2.59% (lower mid). 1Y return: 24.49% (top quartile). 1Y return: 11.81% (upper mid). 1Y return: 0.69% (bottom quartile). Point 8 Alpha: -6.68 (bottom quartile). Alpha: 0.09 (upper mid). Alpha: -5.62 (bottom quartile). Alpha: 6.10 (top quartile). Alpha: -3.45 (lower mid). Point 9 Sharpe: -0.60 (bottom quartile). Sharpe: -0.19 (lower mid). Sharpe: 1.85 (top quartile). Sharpe: 0.14 (upper mid). Sharpe: -0.41 (bottom quartile). Point 10 Information ratio: -1.12 (bottom quartile). Information ratio: 0.06 (upper mid). Information ratio: -0.52 (bottom quartile). Information ratio: -0.34 (lower mid). Information ratio: 0.53 (top quartile). Axis Focused 25 Fund
Aditya Birla Sun Life Focused Equity Fund
Sundaram Select Focus Fund
Motilal Oswal Focused 25 Fund
HDFC Focused 30 Fund
ഇക്വിറ്റി ഫണ്ടുകളുടെ നികുതി
2018 ലെ ബജറ്റ് പ്രസംഗം അനുസരിച്ച്, ഒരു പുതിയ ദീർഘകാലാടിസ്ഥാനത്തിൽമൂലധനം ഇക്വിറ്റി അധിഷ്ഠിത നേട്ടങ്ങൾക്ക് (LTCG) നികുതിമ്യൂച്വൽ ഫണ്ടുകൾ & സ്റ്റോക്കുകൾ ഏപ്രിൽ 1 മുതൽ ബാധകമാകും. ധനകാര്യ ബിൽ 2018 2018 മാർച്ച് 14-ന് ലോക്സഭയിൽ ശബ്ദവോട്ടോടെ പാസാക്കി. എങ്ങനെ പുതിയത്ആദായ നികുതി മാറ്റങ്ങൾ 2018 ഏപ്രിൽ 1 മുതൽ ഇക്വിറ്റി നിക്ഷേപങ്ങളെ ബാധിക്കും. *
1. ദീർഘകാല മൂലധന നേട്ടം
1 ലക്ഷം രൂപയിൽ കൂടുതലുള്ള LTCG-കൾമോചനം 2018 ഏപ്രിൽ 1-നോ അതിനു ശേഷമോ മ്യൂച്വൽ ഫണ്ട് യൂണിറ്റുകൾ അല്ലെങ്കിൽ ഇക്വിറ്റികൾ, 10 ശതമാനം (കൂടാതെ സെസ്) അല്ലെങ്കിൽ 10.4 ശതമാനം നികുതി ചുമത്തപ്പെടും. ദീർഘകാലമൂലധന നേട്ടം ഒരു ലക്ഷം രൂപ വരെ ഒഴിവാക്കപ്പെടും. ഉദാഹരണത്തിന്, നിങ്ങൾ ഒരു സാമ്പത്തിക വർഷത്തിൽ ഓഹരികളിൽ നിന്നോ മ്യൂച്വൽ ഫണ്ട് നിക്ഷേപങ്ങളിൽ നിന്നോ സംയോജിത ദീർഘകാല മൂലധന നേട്ടമായി INR 3 ലക്ഷം നേടുകയാണെങ്കിൽ. നികുതി നൽകേണ്ട എൽടിസിജികൾ 2 ലക്ഷം രൂപയും (INR 3 ലക്ഷം - 1 ലക്ഷം) ആയിരിക്കുംനികുതി ബാധ്യത 20 രൂപ ആയിരിക്കും000 (INR 2 ലക്ഷത്തിന്റെ 10 ശതമാനം).
ദീർഘകാല മൂലധന നേട്ടം എന്നത് വിൽക്കുന്നതിലൂടെയോ വീണ്ടെടുക്കുന്നതിലൂടെയോ ഉണ്ടാകുന്ന ലാഭമാണ്ഇക്വിറ്റി ഫണ്ടുകൾ ഒരു വർഷത്തിലേറെയായി നടത്തി.
2. ഹ്രസ്വകാല മൂലധന നേട്ടം
മ്യൂച്വൽ ഫണ്ട് യൂണിറ്റുകൾ കൈവശം വയ്ക്കുന്നതിന് ഒരു വർഷത്തിന് മുമ്പ് വിൽക്കുകയാണെങ്കിൽ, ഹ്രസ്വകാല മൂലധന നേട്ടം (എസ്ടിസിജി) നികുതി ബാധകമാകും. എസ്ടിസിജിയുടെ നികുതി 15 ശതമാനമായി നിലനിർത്തിയിട്ടുണ്ട്.
| ഇക്വിറ്റി സ്കീമുകൾ | ഹോൾഡിംഗ് പിരീഡ് | നികുതി നിരക്ക് |
|---|---|---|
| ദീർഘകാല മൂലധന നേട്ടം (LTCG) | 1 വർഷത്തിൽ കൂടുതൽ | 10% (ഇൻഡക്സേഷൻ ഇല്ലാതെ)***** |
| ഹ്രസ്വകാല മൂലധന നേട്ടം (STCG) | ഒരു വർഷത്തിൽ കുറവോ തുല്യമോ | 15% |
| ഡിസ്ട്രിബ്യൂട്ടഡ് ഡിവിഡന്റിന് മേലുള്ള നികുതി | - | 10%# |
*ഒരു ലക്ഷം രൂപ വരെയുള്ള നേട്ടങ്ങൾക്ക് നികുതിയില്ല. ഒരു ലക്ഷത്തിന് മുകളിലുള്ള നേട്ടങ്ങൾക്ക് 10% നികുതി ബാധകമാണ്. 2018 ജനുവരി 31-ന് ക്ലോസിംഗ് വിലയായി കണക്കാക്കിയ 0% വിലയാണ് നേരത്തെയുള്ള നിരക്ക്. #ഡിവിഡന്റ് നികുതി 10% + സർചാർജ് 12% + സെസ് 4% =11.648% ആരോഗ്യ, വിദ്യാഭ്യാസ സെസ് 4% അവതരിപ്പിച്ചു. നേരത്തെ വിദ്യാഭ്യാസ സെസ് 3 ആയിരുന്നു%.
SIP നിക്ഷേപത്തിന്റെ നേട്ടങ്ങൾ
പ്രധാനപ്പെട്ട ചിലത്വ്യവസ്ഥാപിത നിക്ഷേപ പദ്ധതികളുടെ പ്രയോജനങ്ങൾ ആകുന്നു:
രൂപയുടെ ചെലവ് ശരാശരി
ഒരു എസ്ഐപി ഓഫറിന്റെ ഏറ്റവും വലിയ നേട്ടങ്ങളിലൊന്ന് റുപ്പി കോസ്റ്റ് ആവറേജിംഗ് ആണ്, ഇത് ഒരു അസറ്റ് വാങ്ങലിന്റെ ശരാശരി ചെലവ് ഒരു വ്യക്തിയെ സഹായിക്കുന്നു. ഒരു മ്യൂച്വൽ ഫണ്ടിൽ ഒറ്റത്തവണ നിക്ഷേപം നടത്തുമ്പോൾ ഒരു നിശ്ചിത എണ്ണം യൂണിറ്റുകൾ വാങ്ങുന്നുനിക്ഷേപകൻ ഒറ്റയടിക്ക്, ഒരു എസ്ഐപിയുടെ കാര്യത്തിൽ, യൂണിറ്റുകളുടെ വാങ്ങൽ ദീർഘകാലാടിസ്ഥാനത്തിൽ നടക്കുന്നു, അവ പ്രതിമാസ ഇടവേളകളിൽ (സാധാരണയായി) തുല്യമായി വ്യാപിക്കുന്നു. നിക്ഷേപം കാലക്രമേണ വ്യാപിക്കുന്നതിനാൽ, നിക്ഷേപം വ്യത്യസ്ത വില പോയിന്റുകളിൽ നിക്ഷേപകന് നിക്ഷേപകർക്ക് ശരാശരി ചെലവിന്റെ ആനുകൂല്യം നൽകുന്നു, അതിനാൽ രൂപയുടെ ചെലവ് ശരാശരി എന്ന പദം.
സംയുക്തത്തിന്റെ ശക്തി
എസ്ഐപികൾ ആനുകൂല്യം വാഗ്ദാനം ചെയ്യുന്നുസംയുക്തത്തിന്റെ ശക്തി. നിങ്ങൾ പ്രിൻസിപ്പലിൽ മാത്രം പലിശ നേടുമ്പോഴാണ് ലളിതമായ താൽപ്പര്യം. കൂട്ടുപലിശയുടെ കാര്യത്തിൽ, പലിശ തുക പ്രിൻസിപ്പലിലേക്ക് ചേർക്കുന്നു, കൂടാതെ പുതിയ പ്രിൻസിപ്പലിന്റെ (പഴയ പ്രിൻസിപ്പലിന്റെയും നേട്ടങ്ങളുടെയും) പലിശ കണക്കാക്കുന്നു. ഈ പ്രക്രിയ ഓരോ തവണയും തുടരുന്നു. എസ്ഐപിയിലെ മ്യൂച്വൽ ഫണ്ടുകൾ ഗഡുക്കളായതിനാൽ, അവ സംയോജിപ്പിച്ചിരിക്കുന്നു, ഇത് തുടക്കത്തിൽ നിക്ഷേപിച്ച തുകയിലേക്ക് കൂടുതൽ ചേർക്കുന്നു.
താങ്ങാനാവുന്ന
SIP-കൾ വളരെ താങ്ങാനാവുന്നവയാണ്. എസ്ഐപിയിലെ പ്രതിമാസ കുറഞ്ഞ നിക്ഷേപ തുക 500 രൂപ വരെ കുറവായിരിക്കും. ചില ഫണ്ട് ഹൗസുകൾ, ടിക്കറ്റ് വലുപ്പം 100 രൂപയിൽ താഴെയുള്ള “മൈക്രോസിപ്പ്” എന്ന് വിളിക്കുന്ന ഒന്ന് പോലും വാഗ്ദാനം ചെയ്യുന്നു. ചെറുപ്പക്കാർക്ക് അവരുടെ ദീർഘകാലം ആരംഭിക്കാൻ ഇത് നല്ലൊരു ഓപ്ഷൻ നൽകുന്നു. - ജീവിതത്തിന്റെ പ്രാരംഭ ഘട്ടത്തിൽ നിക്ഷേപം.
SIP കാൽക്കുലേറ്റർ
നിങ്ങളുടെ നിക്ഷേപത്തിലെ ഏറ്റവും ഉപയോഗപ്രദമായ ഉപകരണമാണ് SIP കാൽക്കുലേറ്റർ. നിങ്ങൾ നിക്ഷേപം തുടരാൻ ആഗ്രഹിക്കുന്ന സമയം വരെ നിങ്ങളുടെ SIP നിക്ഷേപത്തിന്റെ വളർച്ച ഇത് കണക്കാക്കുന്നു. അതിനാൽ, അതിനുമുമ്പ്നിക്ഷേപിക്കുന്നു ഒരു ഫണ്ടിൽ, ഒരാൾക്ക് അവരുടെ മൊത്തം SIP മുൻകൂട്ടി നിശ്ചയിക്കാംവരുമാനം SIP കാൽക്കുലേറ്റർ വഴി. ഒരാൾ നിക്ഷേപിക്കാൻ ആഗ്രഹിക്കുന്ന SIP നിക്ഷേപ തുക, നിക്ഷേപത്തിന്റെ കാലാവധി, പ്രതീക്ഷിക്കുന്ന കാലയളവ് തുടങ്ങിയ ഇൻപുട്ടുകളാണ് കാൽക്കുലേറ്ററുകൾ സാധാരണയായി എടുക്കുന്നത്.പണപ്പെരുപ്പം നിരക്കുകൾ (ഒരാൾ ഇത് കണക്കിലെടുക്കേണ്ടതുണ്ട്). ഇതിന്റെ ദൃഷ്ടാന്തം താഴെ കൊടുക്കുന്നു:
നിങ്ങൾ 10 വർഷത്തേക്ക് 5,000 രൂപ നിക്ഷേപിക്കുകയാണെങ്കിൽ, നിങ്ങളുടെ SIP നിക്ഷേപം എങ്ങനെ വളരുന്നുവെന്ന് നോക്കാം-
പ്രതിമാസ നിക്ഷേപം: 5,000 രൂപ
നിക്ഷേപ കാലയളവ്: 10 വർഷം
നിക്ഷേപിച്ച ആകെ തുക: 6,00,000 രൂപ
ദീർഘകാല വളർച്ചാ നിരക്ക് (ഏകദേശം): 14%
SIP കാൽക്കുലേറ്റർ അനുസരിച്ച് പ്രതീക്ഷിക്കുന്ന വരുമാനം: 12,46,462 രൂപ
മൊത്ത ലാഭം: 6,46,462 രൂപ
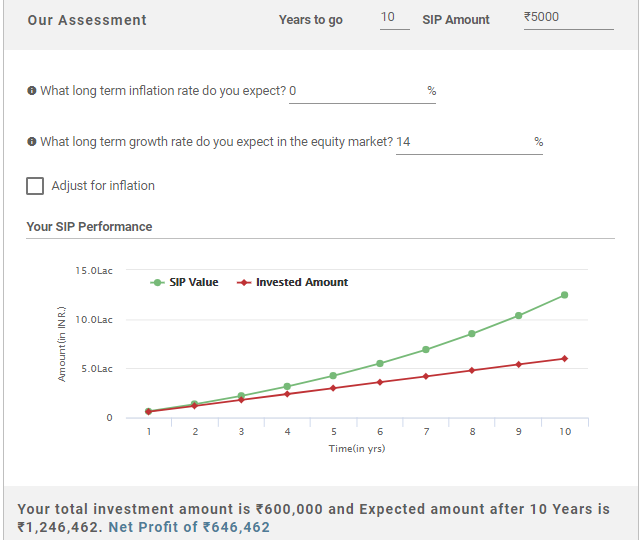
നിങ്ങൾ 10 വർഷത്തേക്ക് പ്രതിമാസം 5,000 രൂപ നിക്ഷേപിച്ചാൽ (ആകെ 6,00,000 രൂപ) നിങ്ങൾ സമ്പാദിക്കുമെന്ന് മുകളിലുള്ള കണക്കുകൂട്ടലുകൾ കാണിക്കുന്നു12,46,462 രൂപ അതായത് നിങ്ങൾ ഉണ്ടാക്കുന്ന അറ്റാദായം6,46,462 രൂപ. അത് ഗംഭീരമല്ലേ!
ഇവിടെ നൽകിയിരിക്കുന്ന വിവരങ്ങൾ കൃത്യമാണെന്ന് ഉറപ്പാക്കാൻ എല്ലാ ശ്രമങ്ങളും നടത്തിയിട്ടുണ്ട്. എന്നിരുന്നാലും, ഡാറ്റയുടെ കൃത്യത സംബന്ധിച്ച് യാതൊരു ഉറപ്പും നൽകുന്നില്ല. എന്തെങ്കിലും നിക്ഷേപം നടത്തുന്നതിന് മുമ്പ് സ്കീം വിവര രേഖ ഉപയോഗിച്ച് പരിശോധിക്കുക.


AMFI Registration No. 112358 | CIN: U74999MH2016PTC282153
Shepard Technologies Pvt. Ltd. (with ARN code 112358) makes no warranties or representations, express or implied, on products offered through the platform. It accepts no liability for any damages or losses, however caused, in connection with the use of, or on the reliance of its product or related services. Terms and conditions of the website are applicable.
©2026 Shepard Technologies Private Limited. All Rights Reserved