മികച്ചതും മികച്ചതുമായ മ്യൂച്വൽ ഫണ്ട് എങ്ങനെ തിരഞ്ഞെടുക്കാം?
മികച്ച മ്യൂച്വൽ ഫണ്ട് എങ്ങനെ തിരഞ്ഞെടുക്കാം? ഇതാണ് ഓരോരുത്തരുടെയും ചോദ്യംനിക്ഷേപകൻ മനസ്സിൽ ഉണ്ട്നിക്ഷേപിക്കുന്നു അവരുടെ പണം. മികച്ച പ്രകടനം കാഴ്ചവയ്ക്കുന്ന മ്യൂച്വൽ ഫണ്ട് അല്ലെങ്കിൽ നിക്ഷേപിക്കാൻ ഏറ്റവും മികച്ച മ്യൂച്വൽ ഫണ്ട് ലഭിക്കുന്നതിന് എല്ലാവരും ധാരാളം ഗവേഷണങ്ങൾ നടത്തുന്നതിന് സമയം ചെലവഴിക്കുന്നു! മ്യൂച്വൽ ഫണ്ടിൽ ഉത്തരം നൽകാൻ ഏറ്റവും സാധാരണവും എന്നാൽ ബുദ്ധിമുട്ടുള്ളതുമായ ചോദ്യമാണിത്വിപണി. ലളിതമായി പറഞ്ഞാൽ, ഒരു മികച്ച മ്യൂച്വൽ ഫണ്ട് തിരഞ്ഞെടുക്കുന്നത് അല്ലെങ്കിൽ റീഫ്രെയ്സ് ചെയ്യാൻ, മികച്ച പ്രകടനം കാഴ്ചവയ്ക്കുന്ന മ്യൂച്വൽ ഫണ്ട് എന്നത് ഏതൊരു സംരംഭത്തിനും ശരിയായ പങ്കാളിയെ തിരഞ്ഞെടുക്കുന്നതിന് തുല്യമാണ്. ഏത് തെറ്റായ തീരുമാനവും - ഇരുവശത്തും - വിനാശകരമായ അനന്തരഫലങ്ങളിലേക്ക് നയിച്ചേക്കാം.
ഏറ്റവും കൂടുതൽ ഒന്ന്സാധാരണ തെറ്റുകൾ മികച്ച മ്യൂച്വൽ ഫണ്ട് തിരഞ്ഞെടുക്കുന്നതിൽ, പരിചയസമ്പന്നരായ നിക്ഷേപകർ പോലും ചിലപ്പോൾ ആശ്രയിക്കുന്നത്,മ്യൂച്വൽ ഫണ്ട് റാങ്കിംഗുകൾ അല്ലെങ്കിൽ റേറ്റിംഗുകൾ. മ്യൂച്വൽ ഫണ്ട് റേറ്റിംഗുകൾ തെറ്റിദ്ധരിപ്പിക്കുന്നതല്ല, എന്നാൽ കൂടുതൽ ഗവേഷണം ആവശ്യമാണ്. റാങ്കിംഗിനെ ആശ്രയിക്കുന്നത് ഏക മാനദണ്ഡമായിരിക്കരുത്. നിക്ഷേപം നന്നായി നിരീക്ഷിക്കപ്പെടുന്നുവെന്ന് ഉറപ്പാക്കാൻ, ഓരോ മൂന്ന് മാസത്തിലും ഇടയ്ക്കിടെ നിക്ഷേപം അവലോകനം ചെയ്യേണ്ടതുണ്ട്. കൂടാതെ, പുനഃസന്തുലിതാവസ്ഥ ആവശ്യമാണെങ്കിൽ, അടിയന്തിരമായി ആവശ്യമില്ലെങ്കിൽ ഒരാൾക്ക് വർഷത്തിലൊരിക്കൽ ഇത് ചെയ്യാൻ കഴിയും.
മികച്ച മ്യൂച്വൽ ഫണ്ട് തിരഞ്ഞെടുക്കുന്നതിനുള്ള പ്രക്രിയ പരിശോധിക്കുന്നതിന് മുമ്പ്, നമുക്ക് നമ്മുടെ അടിസ്ഥാനകാര്യങ്ങൾ നിർമ്മിക്കാം. പല നിക്ഷേപകരും നഷ്ടപ്പെടുത്തുന്ന ഒരു സുപ്രധാന ഘട്ടമാണിത്.
എന്തുകൊണ്ടാണ് നിങ്ങൾ ഒരു മ്യൂച്വൽ ഫണ്ട് നിക്ഷേപം നടത്തുന്നത്?
നിങ്ങൾ എന്തിനാണ് നിക്ഷേപിക്കുന്നതെന്നും എന്തിലാണ് നിക്ഷേപിക്കുന്നതെന്നും അറിയുകയും മനസ്സിലാക്കുകയും ചെയ്യുക എന്നതാണ് ഏതൊരു നല്ല നിക്ഷേപത്തിലേക്കുള്ള ആദ്യപടി. നിങ്ങളുടെ മ്യൂച്വൽ ഫണ്ട് നിക്ഷേപത്തിന് പിന്നിൽ നിങ്ങൾക്ക് വ്യക്തമായ ലക്ഷ്യം ഉണ്ടായിരിക്കണം. ഇത് നിങ്ങളുടെ ഭാവി തീരുമാനങ്ങൾ എളുപ്പമാക്കുന്നു.
നിക്ഷേപിക്കുന്നതിന് മുമ്പ്, നിങ്ങളുടെ റിസ്ക് വിശപ്പിനെക്കുറിച്ച് നിങ്ങൾക്ക് വ്യക്തമായ ധാരണ ഉണ്ടായിരിക്കണം. നിങ്ങളുടെ റിസ്ക് എടുക്കൽ ശേഷി എന്താണെന്ന് അറിയാൻ, നിങ്ങൾ ഒരു ചെയ്യണംഅപകട നിർണ്ണയം അല്ലെങ്കിൽ റിസ്ക് പ്രൊഫൈലിംഗ്. നിങ്ങൾക്ക് എത്രത്തോളം റിസ്ക് എടുക്കാം എന്നതിന്റെ വ്യക്തമായ ചിത്രം നൽകുന്നതിനാൽ നിക്ഷേപിക്കുന്നതിന് മുമ്പ് റിസ്ക് വിലയിരുത്തൽ പ്രധാനമാണ്. ഒരാൾക്ക് ഇൻറർനെറ്റിൽ ലഭ്യമായ വിവിധ റിസ്ക് റേറ്റിംഗ് രീതികൾ ഉപയോഗിക്കാം അല്ലെങ്കിൽ ഒരാൾക്ക് a സന്ദർശിക്കാംസാമ്പത്തിക ഉപദേഷ്ടാവ് അതുപോലെ ചെയ്യാൻ.
റിസ്ക് പ്രൊഫൈലിംഗിന് വിധേയമായ ശേഷം, പ്രസക്തമായത് തീരുമാനിക്കുന്നതിലേക്ക് ശ്രദ്ധ തിരിക്കണംഅസറ്റ് അലോക്കേഷൻ. നിങ്ങളുടെ റിസ്ക് എടുക്കാനുള്ള കഴിവിനെ ആശ്രയിച്ച് ഇക്വിറ്റി, ഡെറ്റ്, മറ്റ് അസറ്റ് ക്ലാസുകൾ തുടങ്ങിയ അസറ്റുകളുടെ മിശ്രിതം നിങ്ങൾക്ക് തീരുമാനിക്കാം. ഒരാൾക്ക് എടുക്കാൻ കഴിയുന്ന റിസ്കിന്റെ നിലവാരവുമായി പൊരുത്തപ്പെടുന്നതിനോ അല്ലെങ്കിൽ അവർക്ക് എടുക്കാവുന്ന അപകടസാധ്യതയേക്കാൾ കുറവോ ആയി അവരുടെ അസറ്റ് അലോക്കേഷൻ തിരഞ്ഞെടുക്കണം. ഇത് പിന്നീട് നെഞ്ചെരിച്ചിലോ ഉറക്കമില്ലാത്ത രാത്രികളോ ഉണ്ടാകില്ലെന്ന് ഉറപ്പാക്കും. നിങ്ങളുടെ റിസ്ക് പ്രൊഫൈലിനെ ആശ്രയിച്ച് നിങ്ങളുടെ അസറ്റ് അലോക്കേഷൻ ഒന്നുകിൽ ആക്രമണാത്മക (ഇക്വിറ്റിയിൽ നിക്ഷേപിക്കുന്നതിലേക്ക് കൂടുതൽ ചായ്വുള്ളവ), മിതമായ (ഇക്വിറ്റിയും കടവും തമ്മിലുള്ള സന്തുലിതാവസ്ഥ) അല്ലെങ്കിൽ യാഥാസ്ഥിതിക (ഇക്വിറ്റിയിൽ കുറവ് നിക്ഷേപം) ആകാം.
നമുക്ക് ഒരു സാമ്പിൾ അസറ്റ് അലോക്കേഷൻ നോക്കാം-
| അഗ്രസീവ് | മിതത്വം | യാഥാസ്ഥിതികൻ | |
|---|---|---|---|
| ** വാർഷിക റിട്ടേൺ (p.a.)** | 15.7% | 13.4% | 10.8% |
| ഇക്വിറ്റി | 50% | 35% | 20% |
| കടം | 30% | 40% | 40% |
| സ്വർണ്ണം | 10% | 10% | 10% |
| പണം | 10% | 15% | 30% |
| ആകെ | 100% | 100% | 100% |
നിങ്ങളുടെ റിസ്ക് പ്രൊഫൈലിംഗ് പൂർത്തിയാക്കി അസറ്റ് അലോക്കേഷൻ തീരുമാനിച്ചതിന് ശേഷം, ശരിയായ ഉൽപ്പന്നം തിരഞ്ഞെടുക്കുന്നതാണ് അവശേഷിക്കുന്ന ഏറ്റവും പ്രധാനപ്പെട്ട ചുമതല. ഒരാൾ കണക്കിലെടുക്കേണ്ട ഘടകങ്ങൾ ചുവടെയുണ്ട്മികച്ച മ്യൂച്വൽ ഫണ്ട് എങ്ങനെ തിരഞ്ഞെടുക്കാം.
Talk to our investment specialist
മികച്ച മ്യൂച്വൽ ഫണ്ടുകൾ എങ്ങനെ തിരഞ്ഞെടുക്കാം?
നേരത്തെ പറഞ്ഞതുപോലെ, ഏറ്റവും മികച്ച മ്യൂച്വൽ ഫണ്ട് തിരഞ്ഞെടുക്കുന്നത്അടിസ്ഥാനം അവരുടെ റേറ്റിംഗുകൾ മതിയാകണമെന്നില്ല. മികച്ച മ്യൂച്വൽ ഫണ്ട് തിരഞ്ഞെടുക്കുന്ന പ്രക്രിയയെ സ്വാധീനിക്കുന്ന മറ്റ് ഘടകങ്ങളുണ്ട് - അളവിലും ഗുണപരമായും. ആ ഘടകങ്ങളെ ഒന്ന് നോക്കാം.
മ്യൂച്വൽ ഫണ്ട് റേറ്റിംഗുകൾ
മികച്ച ചിലത് തിരഞ്ഞെടുക്കുന്നതിന് മ്യൂച്വൽ ഫണ്ട് റാങ്കിംഗ് നിങ്ങളെ സഹായിക്കുന്നുമ്യൂച്വൽ ഫണ്ടുകൾ ഒരു നിശ്ചിത സമയത്ത് ബിസിനസ്സിൽ. CRISIL, ICRA, MorningStar മുതലായവ അവയിൽ ചിലതാണ്റേറ്റിംഗ് ഏജൻസികൾ. അവർ വിവിധ പാരാമീറ്ററുകളിൽ ഒരു മ്യൂച്വൽ ഫണ്ട് സ്കീമിനെ വിലയിരുത്തുകയും അവയുടെ ഫലങ്ങൾ നൽകുകയും ചെയ്യുന്നു. നിങ്ങളുടെ മുൻഗണനകൾ ചുരുക്കാനും മികച്ച മ്യൂച്വൽ ഫണ്ട് തിരഞ്ഞെടുക്കാനും ഈ ഫലങ്ങൾ നിങ്ങളെ സഹായിക്കുന്നു.
ഇവിടെ ശ്രദ്ധിക്കേണ്ട ഒരു കാര്യം, റാങ്കിംഗിനൊപ്പം, മ്യൂച്വൽ ഫണ്ട് സ്കീമുകളുടെ മുൻകാല പ്രകടനങ്ങളെക്കുറിച്ചും ഗവേഷണം നടത്തുന്നത് ബുദ്ധിപരമാണ്. ഇത് നിങ്ങളുടെ റിസ്ക് കുറയ്ക്കുകയും നിങ്ങളുടെ വരുമാനം വർദ്ധിപ്പിക്കുകയും ചെയ്യും.മികച്ച പ്രകടനം നടത്തുന്ന മ്യൂച്വൽ ഫണ്ടുകൾ പോലെറിലയൻസ് മ്യൂച്വൽ ഫണ്ട്,എസ്ബിഐ മ്യൂച്വൽ ഫണ്ട്,യുടിഐ മ്യൂച്വൽ ഫണ്ട്, കൂടാതെ മറ്റു പലരും മുൻകാലങ്ങളിൽ നല്ല ഫലങ്ങൾ നൽകുന്നുണ്ട്.
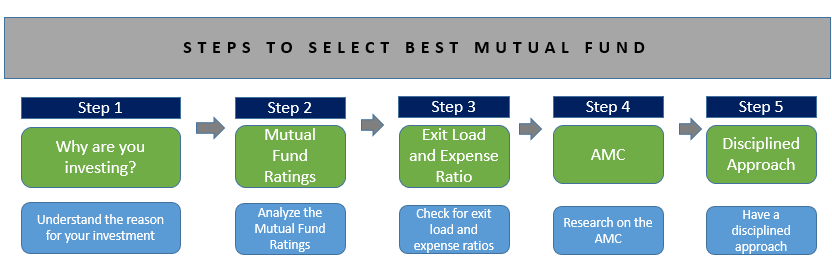
ചെലവ് അനുപാതം
നിക്ഷേപിക്കാൻ ഏറ്റവും മികച്ച മ്യൂച്വൽ ഫണ്ടിനായി തിരയുമ്പോൾ എൻട്രി/എക്സിറ്റ് ലോഡുകളും ചെലവ് അനുപാതങ്ങളും പരിശോധിക്കുന്നത് വളരെ പ്രധാനമാണ്. പല നിക്ഷേപകരും ഈ ആവർത്തന ചെലവുകൾ പരിഗണിക്കാതെ ദീർഘകാലാടിസ്ഥാനത്തിൽ കഷ്ടപ്പെടുന്നു. നിക്ഷേപിക്കുന്നതിന് മുമ്പ് നിങ്ങൾ ചെലവ് അനുപാതം പരിശോധിക്കണം. ഉയർന്ന ചെലവ് അനുപാതം സ്കീമുകളുടെ വരുമാനത്തെ ബാധിക്കുന്നു. ചെലവ് അനുപാതങ്ങൾ പരിമിതപ്പെടുത്തിയിട്ടുണ്ടെങ്കിലുംസെബി, ഉയർന്ന റിട്ടേണുകളുള്ള കുറഞ്ഞ ചെലവ് അനുപാത സ്കീം ഉള്ളതാണ് പൊതുവെ നല്ലത്. എന്നിരുന്നാലും, എപ്പോഴും ഓർക്കുക, ചെലവ് അനുപാതം താരതമ്യേന ചെറിയ ഭാഗമാണ്, ലഭിക്കുന്ന വരുമാനം അല്ലെങ്കിൽ ഒരു നല്ല ഫണ്ട് സൃഷ്ടിക്കുന്ന അധിക വരുമാനം ഇതിനെ പൂർണ്ണമായും അസാധുവാക്കിയേക്കാം. ചെലവ് അനുപാതത്തിന്റെ അടിസ്ഥാനത്തിൽ ഒരു ഫണ്ട് തിരഞ്ഞെടുക്കുകയും പിന്നീട് ഒരു നല്ല ഫണ്ടിന്റെ വരുമാനം നഷ്ടപ്പെടുത്തുകയും ചെയ്യുന്നത് ചില്ലിക്കാശും പൗണ്ട് വിഡ്ഢിത്തവുമാണ്. മറ്റ് ഘടകങ്ങളെപ്പോലെ, ഇത് റേറ്റിംഗുകൾ, റിട്ടേണുകൾ മുതലായവ പോലുള്ള മറ്റ് ഘടകങ്ങളുമായി സംയോജിച്ച് കാണേണ്ടതുണ്ട്, തുടർന്ന് മികച്ച മ്യൂച്വൽ ഫണ്ട് തിരഞ്ഞെടുക്കുന്നതിൽ ഒരാൾ വിജയിക്കും.
എക്സിറ്റ് ലോഡ്
പരിഗണിക്കേണ്ട മറ്റൊരു കാര്യം എക്സിറ്റ് ലോഡാണ്. നിക്ഷേപത്തിന്റെ സ്വഭാവമനുസരിച്ച് വ്യത്യസ്ത തരത്തിലുള്ള ഫണ്ടുകൾക്ക് വേരിയബിൾ എക്സിറ്റ് ലോഡുകളുണ്ട്. മെച്യൂരിറ്റി കാലയളവിന് മുമ്പ് നിങ്ങൾ സ്കീം ലിക്വിഡേറ്റ് ചെയ്യുകയാണെങ്കിൽ എക്സിറ്റ് ലോഡിന്റെ ഉയർന്ന ശതമാനം നിങ്ങളിൽ നിന്ന് ഈടാക്കിയേക്കാം. ഇത് തീർച്ചയായും നിങ്ങളെ ബാധിക്കുംനിക്ഷേപ പദ്ധതി. ഈഘടകം ഒരാളുടെ നിക്ഷേപ കാലാവധിയുമായി പൊരുത്തപ്പെടുന്നതിന് കണക്കിലെടുക്കേണ്ടതാണ്. നിക്ഷേപത്തിൽ എക്സിറ്റ് ലോഡുകളൊന്നും ഉണ്ടാകുന്നില്ലെന്ന് ഇത് ഉറപ്പാക്കും.
ഫണ്ട് പ്രായം
കുറഞ്ഞത് മൂന്ന് വർഷത്തെ ട്രാക്ക് റെക്കോർഡോ അതിൽ കൂടുതലോ ഉള്ള ഒരു ഫണ്ടിൽ നിക്ഷേപിക്കുന്നത് നല്ല ആശയമാണ്. ഫണ്ടിന്റെ പ്രകടനം യഥാർത്ഥത്തിൽ വിലയിരുത്തുന്നതിന് ഈ കുറഞ്ഞ സമയപരിധി നിങ്ങൾക്ക് ചില ഡാറ്റ പോയിന്റുകൾ നൽകുന്നു. എപുതിയ ഫണ്ട് ഓഫർ(NFO), ഒരുപക്ഷേ ശുപാർശ ചെയ്തതും മികച്ചതും ആയിരിക്കാം, എന്നിരുന്നാലും, മ്യൂച്വൽ ഫണ്ട് സ്കീമിന്റെ പ്രകടനത്തിന് ഒരു ട്രാക്ക് റെക്കോർഡും ഇല്ല. പുതിയ ഉൽപ്പന്നങ്ങളിലേക്ക് പ്രവേശിക്കുന്നത് ചിലപ്പോൾ നല്ല ആശയമായിരിക്കുമെങ്കിലും, ഇത് പോർട്ട്ഫോളിയോയുടെ ഒരു ചെറിയ ഭാഗത്തേക്ക് പരിമിതപ്പെടുത്തണം. പോർട്ട്ഫോളിയോയുടെ വലിയൊരു ഭാഗം നിക്ഷേപിക്കുമ്പോൾ, ആ ഉൽപ്പന്നങ്ങൾക്കോ സ്കീമുകൾക്കോ ഒരു ട്രാക്ക് റെക്കോർഡ് നിർബന്ധമാണ്. വേണ്ടിഇക്വിറ്റി ഫണ്ടുകൾ, ലിക്വിഡ്, അൾട്രാ- എന്നിവയ്ക്ക് മൂന്ന് വർഷത്തെ ട്രാക്ക് റെക്കോർഡ് ഏറ്റവും കുറഞ്ഞതാണ്.ഹ്രസ്വകാല ഫണ്ടുകൾ ഒരു വർഷത്തെ ട്രാക്ക് പോലും മതിയാകും (എന്നിരുന്നാലും, ഇത് മറ്റ് പല ഘടകങ്ങളുമായി അനുബന്ധമായി നൽകേണ്ടതുണ്ട്).
കഴിഞ്ഞ റിട്ടേണുകളും അസ്ഥിരതയും
നിലവിലെ വിപണി സാഹചര്യത്തിൽ മികച്ച പ്രകടനം കാഴ്ചവയ്ക്കുന്ന മ്യൂച്വൽ ഫണ്ട് സ്കീമുകളിൽ നിക്ഷേപിക്കാൻ മിക്ക നിക്ഷേപകരും ആഗ്രഹിക്കുന്നു. ആ സമയത്ത് ഇത് ഒരു നല്ല നിക്ഷേപമായി തോന്നുമെങ്കിലും, ഭാവിയിൽ ഇത് മികച്ച മ്യൂച്വൽ ഫണ്ടോ മികച്ച പ്രകടനം കാഴ്ചവയ്ക്കുന്ന മ്യൂച്വൽ ഫണ്ടോ ആയിരിക്കാം. ഓരോ വർഷവും മികച്ച പ്രകടനം നടത്തുന്ന 5 ഇക്വിറ്റി ഫണ്ടുകൾ നൽകുന്ന 2011 മുതൽ 2015 വരെയുള്ള ചുവടെയുള്ള ഡാറ്റ നോക്കൂ:
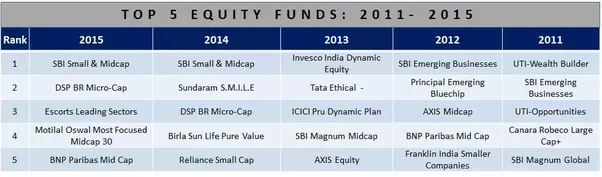
മുകളിലെ പട്ടികയിൽ നിന്ന് നിങ്ങൾക്ക് കാണാനാകുന്നതുപോലെ, എസ്ബിഐ സ്മോൾ & മിഡ്ക്യാപ്, ബിഎൻപി എന്നിവയ്ക്ക് പുറമെമിഡ് ക്യാപ്, എല്ലാ സ്കീമുകളും ഓരോ വർഷവും വ്യത്യസ്തമാണ്. ഇതിനർത്ഥം ഈ വർഷത്തെ മികച്ച പ്രകടനം നടത്തുന്നവർ അടുത്ത വർഷത്തെ മികച്ച പ്രകടനം നടത്തുന്നവരല്ല എന്നാണ്! ഇപ്പോൾ ഏറ്റവും മികച്ചത് ഭാവിയിൽ എല്ലായ്പ്പോഴും മികച്ചതായിരിക്കാം അല്ലെങ്കിൽ അല്ലായിരിക്കാം എന്ന ആശയം ഇത് നിങ്ങൾക്ക് നൽകുന്നു. അതിനാൽ മികച്ച മ്യൂച്വൽ ഫണ്ടുകൾക്കായി തിരയുമ്പോൾ റിട്ടേണിൽ മാത്രം ബാങ്കിംഗ് നടത്തുന്നത് എല്ലായ്പ്പോഴും ബുദ്ധിപരമായ നീക്കമല്ല. അതിനാൽ നിക്ഷേപം നടത്തുമ്പോൾ, ഒരു കാലയളവിൽ സ്ഥിരതയുള്ളതും അസ്ഥിരത കുറഞ്ഞതുമായ ഒരു ഫണ്ട് പരിഗണിക്കുക. കൂടാതെ, നിക്ഷേപിക്കാൻ ഏറ്റവും മികച്ച മ്യൂച്വൽ ഫണ്ട് തിരഞ്ഞെടുക്കുന്നതിന് മറ്റ് പല ഘടകങ്ങളും നോക്കണം.
മികച്ച മ്യൂച്വൽ ഫണ്ട് എങ്ങനെ തിരഞ്ഞെടുക്കാം എന്നതിനെക്കുറിച്ചുള്ള ചില ഗുണപരമായ ഘടകങ്ങൾ ഇപ്പോൾ നോക്കാം.
മ്യൂച്വൽ ഫണ്ടുകളിൽ ഓൺലൈനിൽ നിക്ഷേപിക്കുന്നത് എങ്ങനെ?
Fincash.com-ൽ ആജീവനാന്ത സൗജന്യ നിക്ഷേപ അക്കൗണ്ട് തുറക്കുക.
നിങ്ങളുടെ രജിസ്ട്രേഷനും KYC പ്രക്രിയയും പൂർത്തിയാക്കുക
രേഖകൾ അപ്ലോഡ് ചെയ്യുക (പാൻ, ആധാർ മുതലായവ).കൂടാതെ, നിങ്ങൾ നിക്ഷേപിക്കാൻ തയ്യാറാണ്!
അസറ്റ് മാനേജ്മെന്റ് കമ്പനിയുടെ പ്രശസ്തി
ഒരാൾക്ക് പല ഗുണപരമായ ഘടകങ്ങളും നോക്കാൻ കഴിയുമെങ്കിലും, ഒരാൾ ഫണ്ട് ഹൗസിലും ശ്രദ്ധ കേന്ദ്രീകരിക്കേണ്ടതുണ്ട്വഴിപാട് മ്യൂച്വൽ ഫണ്ട് സ്കീം. നല്ല ട്രാക്ക് റെക്കോർഡുള്ള ഒരു വിശ്വസനീയ അസറ്റ് മാനേജ്മെന്റ് കമ്പനിക്ക് നിങ്ങളെ സഹായിക്കാനാകുംസമർത്ഥമായി നിക്ഷേപിക്കുക വിവേകത്തോടെയും. ഒരു നല്ലഎഎംസി നിങ്ങൾക്ക് നിക്ഷേപത്തിനുള്ള നല്ല ഓപ്ഷനുകൾ നൽകുന്നതിന് വിവിധ നിക്ഷേപ പദ്ധതികൾ ഉണ്ട്. ഫണ്ട് ഹൗസിന്റെ പ്രായം, മൊത്തത്തിലുള്ള AUM, മാനേജ്മെന്റിന്റെ ട്രാക്ക് റെക്കോർഡ്, ഫണ്ട് ഹൗസിന്റെ നിക്ഷേപ പ്രക്രിയ, വിഭാഗങ്ങളിലുടനീളമുള്ള ഓഫർ ചെയ്യുന്ന സ്കീമുകളുടെ എണ്ണം, കൂടാതെ വിഭാഗങ്ങളിലുടനീളമുള്ള മികച്ച പ്രകടനം നടത്തുന്ന സ്കീമുകളുടെ എണ്ണം എന്നിവ പരിശോധിക്കണം. അതിനാൽ ഒരു നല്ല എഎംസി തിരഞ്ഞെടുക്കുന്നത് മികച്ച മ്യൂച്വൽ ഫണ്ട് തിരഞ്ഞെടുക്കുന്നതിനുള്ള ഒരു പ്രധാന ഘട്ടമാണ്.
| ക്വാണ്ടിറ്റേറ്റീവ് ഘടകങ്ങൾ | ഗുണപരമായ ഘടകങ്ങൾ |
|---|---|
| പ്രകടന റേറ്റിംഗ് (ക്രിസിൽ, മൂല്യ ഗവേഷണം മുതലായവ) | ഫണ്ട് മാനേജർ ട്രാക്ക് റെക്കോർഡ് |
| ഫണ്ട് പ്രായം (3+ വർഷം) | ഫണ്ട് ഹൗസ് പ്രശസ്തി |
| കഴിഞ്ഞ റിട്ടേണുകളും ഫണ്ടിന്റെ അസ്ഥിരതയും | നിക്ഷേപ പ്രക്രിയ |
| ചെലവ് അനുപാതം | |
| എക്സിറ്റ് ലോഡ് |
ഫണ്ട് മാനേജർ ട്രാക്ക് റെക്കോർഡ്
നിങ്ങൾ ഒരു സ്കീമിൽ നിക്ഷേപിച്ചതിന് ശേഷം നിങ്ങളുടെ പണം കൈകാര്യം ചെയ്യുന്ന പ്രൊഫഷണലാണ് ഫണ്ട് മാനേജർ. അതിനാൽ, നിങ്ങളുടെ പണം ആരാണ് കൈകാര്യം ചെയ്യുന്നതെന്ന് അറിയേണ്ടത് പ്രധാനമാണ്. അവരുടെ മുൻകാല റെക്കോർഡ് നിങ്ങൾ അറിയുകയും അവരുടെ നിക്ഷേപ ശൈലി നിങ്ങൾക്ക് അനുയോജ്യമാണോ എന്ന് പരിശോധിക്കുകയും വേണം. അവർ എത്ര വർഷമായി പണം കൈകാര്യം ചെയ്യുന്നു, കഴിഞ്ഞ 5 വർഷമായി (അല്ലെങ്കിൽ അതിൽ കൂടുതൽ) അവരുടെ ട്രാക്ക് റെക്കോർഡ്, അവർ കൈകാര്യം ചെയ്യുന്ന സ്കീമുകളുടെ എണ്ണം എന്നിവ പരിശോധിക്കേണ്ടതുണ്ട്. ഇവിടെയുള്ള ചില അടിസ്ഥാന ഫിൽട്ടറുകൾ നല്ല പെർഫോമിംഗ് സ്കീമുകൾ ലഭിക്കുന്നതിന് ഇടയാക്കും.
നിക്ഷേപ പ്രക്രിയ
ഫണ്ട് മാനേജരുടെ പ്രകടനത്തെ മാത്രം ആശ്രയിക്കുന്നതിനുപകരം, ഒരു നിക്ഷേപ പ്രക്രിയ ഉണ്ടെന്ന് ഉറപ്പാക്കണം. കീ-മാൻ റിസ്ക് ഉള്ള ഒരു ഉൽപ്പന്നത്തിലേക്ക് പ്രവേശിക്കാൻ നിങ്ങൾ ആഗ്രഹിക്കുന്നില്ല. ഒരു സ്ഥാപനവൽക്കരിച്ച നിക്ഷേപ പ്രക്രിയ നിലവിലുണ്ടെങ്കിൽ, ഇത് സ്കീം നന്നായി കൈകാര്യം ചെയ്യപ്പെടുന്നുവെന്ന് ഉറപ്പാക്കും. ഒരു ഫണ്ട് മാനേജർ മാറ്റമുണ്ട്. അപ്പോൾ നിങ്ങളുടെ നിക്ഷേപം സംരക്ഷിക്കപ്പെടും.
നിരീക്ഷിക്കുകയും അവലോകനം ചെയ്യുകയും ചെയ്യുക: അച്ചടക്കത്തോടെയുള്ള സമീപനം ഉണ്ടായിരിക്കുക
മുകളിലുള്ള എല്ലാ ഘടകങ്ങളും നിങ്ങൾ പരിഗണിക്കുകയാണെങ്കിൽ, നിങ്ങൾക്ക് ഒരു മികച്ച മ്യൂച്വൽ ഫണ്ടോ മികച്ച മ്യൂച്വൽ ഫണ്ടോ ലഭിച്ചേക്കാം. എന്നാൽ ആ മികച്ച മ്യൂച്വൽ ഫണ്ടിൽ നിന്ന് ഏറ്റവും മികച്ചത് നേടുന്നതിന്, നിങ്ങൾക്ക് അച്ചടക്കമുള്ള സമീപനം ഉണ്ടായിരിക്കുകയും നിക്ഷേപമോ പദ്ധതിയോ നിരീക്ഷിക്കുകയും വേണം. വിപണികൾ അസ്ഥിരമാണ്, നിങ്ങളുടെ നിക്ഷേപം അതിന്റെ മൂല്യം ഉയരുകയും കുറയുകയും ചെയ്തേക്കാം. മ്യൂച്വൽ ഫണ്ട് തിരഞ്ഞെടുക്കുന്നതിലെ ഗവേഷണത്തെയും ശ്രമങ്ങളെയും നിങ്ങൾ വിശ്വസിക്കുകയും ഹ്രസ്വകാല നഷ്ടങ്ങൾക്ക് (പ്രത്യേകിച്ച് ഇക്വിറ്റിയിൽ) ഇരയാകുന്നത് ഒഴിവാക്കുകയും വേണം. ലളിതമായി പറഞ്ഞാൽ, മികച്ച മ്യൂച്വൽ ഫണ്ട് തിരഞ്ഞെടുക്കുന്നതിൽ നിങ്ങൾക്ക് പിഴവ് സംഭവിച്ചതായി തോന്നുന്നുവെങ്കിൽ, നിങ്ങൾ നടപടിയെടുക്കുകയും ഫണ്ട് മാറ്റുകയും വേണം. എന്നിരുന്നാലും, മുമ്പത്തെ "മികച്ച മ്യൂച്വൽ ഫണ്ടിലേക്ക്" പ്രവർത്തിക്കുന്നതിന് മതിയായ സമയം നൽകുന്നതിന് മുമ്പ് ഒരു മാറ്റം വരുത്തരുത്. ഒരാൾ വീണ്ടും ബാലൻസ് ചെയ്യണം, ഒരു വർഷത്തിന് മുമ്പല്ല. എല്ലായ്പ്പോഴും ഓർക്കുക, മികച്ച നിക്ഷേപകർ പോലും (വാറൻ ബഫറ്റ് പോലും) നിക്ഷേപ തെറ്റുകൾ വരുത്തുന്നു, എന്നിരുന്നാലും, ദീർഘകാലാടിസ്ഥാനത്തിൽ തെറ്റായ തീരുമാനങ്ങളേക്കാൾ കൂടുതൽ ശരിയായ തീരുമാനങ്ങൾ നമുക്ക് ലഭിക്കണം. ഞങ്ങളുടെ പോർട്ട്ഫോളിയോ അല്ലെങ്കിൽ മികച്ച മ്യൂച്വൽ ഫണ്ടുകൾ പോലും കാലക്രമേണ പ്രകടനം നടത്തുന്നുവെന്ന് ഇത് ഉറപ്പാക്കും.
നിക്ഷേപിക്കാനുള്ള മികച്ച മ്യൂച്വൽ ഫണ്ടുകൾ 2022 - 2023
Fund NAV Net Assets (Cr) 3 MO (%) 6 MO (%) 1 YR (%) 3 YR (%) 5 YR (%) 2024 (%) DSP World Gold Fund Growth ₹48.0518
↓ -1.62 ₹1,679 -23.5 -18.5 59.4 39.1 21.2 167.1 SBI Gold Fund Growth ₹40.7868
↓ -0.27 ₹16,533 -7.3 -1.8 42.5 31.6 22.4 71.5 ICICI Prudential Regular Gold Savings Fund Growth ₹43.1042
↓ -0.28 ₹6,856 -7.4 -1.8 42.3 31.5 22.3 72 Aditya Birla Sun Life Gold Fund Growth ₹40.5275
↓ -0.23 ₹1,822 -7.3 -1.7 42.6 31.5 22.1 72 HDFC Gold Fund Growth ₹41.6114
↓ -0.25 ₹12,121 -7.2 -1.9 42.3 31.4 22.2 71.3 Nippon India Gold Savings Fund Growth ₹53.2605
↓ -0.31 ₹7,553 -7.3 -1.9 42.1 31.4 22.1 71.2 Kotak Gold Fund Growth ₹53.5283
↓ -0.27 ₹7,065 -7.3 -1.5 42.2 31.4 22 70.4 IDBI Gold Fund Growth ₹36.1168
↓ -0.33 ₹824 -7.4 -2.2 41.2 31.3 22.4 79 Axis Gold Fund Growth ₹40.4465
↓ -0.28 ₹3,092 -7.3 -2 41.9 31.1 22.2 69.8 Invesco India Gold Fund Growth ₹39.0681
↓ -0.27 ₹503 -7.1 -1.6 41.4 31.1 22.1 69.6 Note: Returns up to 1 year are on absolute basis & more than 1 year are on CAGR basis. as on 16 Jul 26 Research Highlights & Commentary of 10 Funds showcased
Commentary DSP World Gold Fund SBI Gold Fund ICICI Prudential Regular Gold Savings Fund Aditya Birla Sun Life Gold Fund HDFC Gold Fund Nippon India Gold Savings Fund Kotak Gold Fund IDBI Gold Fund Axis Gold Fund Invesco India Gold Fund Point 1 Bottom quartile AUM (₹1,679 Cr). Highest AUM (₹16,533 Cr). Upper mid AUM (₹6,856 Cr). Lower mid AUM (₹1,822 Cr). Top quartile AUM (₹12,121 Cr). Upper mid AUM (₹7,553 Cr). Upper mid AUM (₹7,065 Cr). Bottom quartile AUM (₹824 Cr). Lower mid AUM (₹3,092 Cr). Bottom quartile AUM (₹503 Cr). Point 2 Oldest track record among peers (18 yrs). Established history (14+ yrs). Established history (14+ yrs). Established history (14+ yrs). Established history (14+ yrs). Established history (15+ yrs). Established history (15+ yrs). Established history (13+ yrs). Established history (14+ yrs). Established history (14+ yrs). Point 3 Top rated. Rating: 2★ (upper mid). Rating: 1★ (lower mid). Rating: 3★ (top quartile). Rating: 1★ (lower mid). Rating: 2★ (upper mid). Rating: 1★ (bottom quartile). Not Rated. Rating: 1★ (bottom quartile). Rating: 3★ (upper mid). Point 4 Risk profile: High. Risk profile: Moderately High. Risk profile: Moderately High. Risk profile: Moderately High. Risk profile: Moderately High. Risk profile: Moderately High. Risk profile: Moderately High. Risk profile: Moderately High. Risk profile: Moderately High. Risk profile: Moderately High. Point 5 5Y return: 21.17% (bottom quartile). 5Y return: 22.37% (top quartile). 5Y return: 22.29% (upper mid). 5Y return: 22.12% (lower mid). 5Y return: 22.20% (upper mid). 5Y return: 22.12% (lower mid). 5Y return: 21.99% (bottom quartile). 5Y return: 22.42% (top quartile). 5Y return: 22.24% (upper mid). 5Y return: 22.05% (bottom quartile). Point 6 3Y return: 39.12% (top quartile). 3Y return: 31.63% (top quartile). 3Y return: 31.54% (upper mid). 3Y return: 31.46% (upper mid). 3Y return: 31.42% (upper mid). 3Y return: 31.40% (lower mid). 3Y return: 31.39% (lower mid). 3Y return: 31.33% (bottom quartile). 3Y return: 31.10% (bottom quartile). 3Y return: 31.07% (bottom quartile). Point 7 1Y return: 59.41% (top quartile). 1Y return: 42.51% (upper mid). 1Y return: 42.29% (upper mid). 1Y return: 42.60% (top quartile). 1Y return: 42.28% (upper mid). 1Y return: 42.12% (lower mid). 1Y return: 42.17% (lower mid). 1Y return: 41.23% (bottom quartile). 1Y return: 41.87% (bottom quartile). 1Y return: 41.36% (bottom quartile). Point 8 Alpha: -0.46 (bottom quartile). 1M return: -6.45% (lower mid). 1M return: -6.51% (lower mid). 1M return: -6.41% (upper mid). 1M return: -6.39% (top quartile). 1M return: -6.45% (upper mid). 1M return: -6.29% (top quartile). 1M return: -6.69% (bottom quartile). 1M return: -6.52% (bottom quartile). 1M return: -6.45% (upper mid). Point 9 Sharpe: 1.77 (bottom quartile). Alpha: 0.00 (top quartile). Alpha: 0.00 (top quartile). Alpha: 0.00 (upper mid). Alpha: 0.00 (upper mid). Alpha: 0.00 (upper mid). Alpha: 0.00 (lower mid). Alpha: 0.00 (lower mid). Alpha: 0.00 (bottom quartile). Alpha: 0.00 (bottom quartile). Point 10 Information ratio: -0.78 (bottom quartile). Sharpe: 1.93 (upper mid). Sharpe: 1.79 (lower mid). Sharpe: 1.76 (bottom quartile). Sharpe: 1.92 (upper mid). Sharpe: 1.74 (bottom quartile). Sharpe: 2.12 (top quartile). Sharpe: 1.82 (lower mid). Sharpe: 2.08 (top quartile). Sharpe: 1.87 (upper mid). DSP World Gold Fund
SBI Gold Fund
ICICI Prudential Regular Gold Savings Fund
Aditya Birla Sun Life Gold Fund
HDFC Gold Fund
Nippon India Gold Savings Fund
Kotak Gold Fund
IDBI Gold Fund
Axis Gold Fund
Invesco India Gold Fund
*ഇതിന്റെ വിശദമായ ലിസ്റ്റ് ചുവടെയുണ്ട്മുൻനിര മ്യൂച്വൽ ഫണ്ടുകൾ കഴിഞ്ഞ 3 വർഷത്തെ അടിസ്ഥാനമാക്കിസിഎജിആർ മടങ്ങുന്നു.
"The primary investment objective of the Scheme is to seek capital appreciation by investing predominantly in units of MLIIF - WGF. The Scheme may, at the discretion of the Investment Manager, also invest in the units of other similar overseas mutual fund schemes, which may constitute a significant part of its corpus. The Scheme may also invest a certain portion of its corpus in money market securities and/or units of money market/liquid schemes of DSP Merrill Lynch Mutual Fund, in order to meet liquidity requirements from time to time. However, there is no assurance that the investment objective of the Scheme will be realized." Research Highlights for DSP World Gold Fund Below is the key information for DSP World Gold Fund Returns up to 1 year are on The scheme seeks to provide returns that closely correspond to returns provided by SBI - ETF Gold (Previously known as SBI GETS). Research Highlights for SBI Gold Fund Below is the key information for SBI Gold Fund Returns up to 1 year are on ICICI Prudential Regular Gold Savings Fund (the Scheme) is a fund of funds scheme with the primary objective to generate returns by investing in units of ICICI Prudential Gold Exchange Traded Fund (IPru Gold ETF).
However, there can be no assurance that the investment objectives of the Scheme will be realized. Research Highlights for ICICI Prudential Regular Gold Savings Fund Below is the key information for ICICI Prudential Regular Gold Savings Fund Returns up to 1 year are on An Open ended Fund of Funds Scheme with the investment objective to provide returns that tracks returns provided by Birla Sun Life Gold ETF (BSL Gold ETF). Research Highlights for Aditya Birla Sun Life Gold Fund Below is the key information for Aditya Birla Sun Life Gold Fund Returns up to 1 year are on To seek capital appreciation by investing in units of HDFC Gold Exchange Traded Fund (HGETF). Research Highlights for HDFC Gold Fund Below is the key information for HDFC Gold Fund Returns up to 1 year are on The investment objective of the Scheme is to seek to provide returns that closely correspond to returns provided by Reliance ETF Gold BeES. Research Highlights for Nippon India Gold Savings Fund Below is the key information for Nippon India Gold Savings Fund Returns up to 1 year are on The investment objective of the scheme is to generate returns by investing in units of Kotak Gold Exchange Traded Fund. Research Highlights for Kotak Gold Fund Below is the key information for Kotak Gold Fund Returns up to 1 year are on The investment objective of the Scheme will be to generate returns that correspond closely to the returns generated by IDBI Gold Exchange Traded Fund (IDBI GOLD ETF). Research Highlights for IDBI Gold Fund Below is the key information for IDBI Gold Fund Returns up to 1 year are on To generate returns that closely correspond to returns generated by Axis Gold ETF. Research Highlights for Axis Gold Fund Below is the key information for Axis Gold Fund Returns up to 1 year are on To provide returns that closely corresponds to returns provided by Invesco India Gold Exchange Traded Fund. Research Highlights for Invesco India Gold Fund Below is the key information for Invesco India Gold Fund Returns up to 1 year are on 1. DSP World Gold Fund
DSP World Gold Fund
Growth Launch Date 14 Sep 07 NAV (16 Jul 26) ₹48.0518 ↓ -1.62 (-3.26 %) Net Assets (Cr) ₹1,679 on 31 May 26 Category Equity - Global AMC DSP BlackRock Invmt Managers Pvt. Ltd. Rating ☆☆☆ Risk High Expense Ratio 1.41 Sharpe Ratio 1.77 Information Ratio -0.78 Alpha Ratio -0.46 Min Investment 1,000 Min SIP Investment 500 Exit Load 0-12 Months (1%),12 Months and above(NIL) Growth of 10,000 investment over the years.
Date Value 30 Jun 21 ₹10,000 30 Jun 22 ₹8,181 30 Jun 23 ₹9,294 30 Jun 24 ₹10,640 30 Jun 25 ₹16,808 30 Jun 26 ₹27,693 Returns for DSP World Gold Fund
absolute basis & more than 1 year are on CAGR (Compound Annual Growth Rate) basis. as on 16 Jul 26 Duration Returns 1 Month -15.7% 3 Month -23.5% 6 Month -18.5% 1 Year 59.4% 3 Year 39.1% 5 Year 21.2% 10 Year 15 Year Since launch 8.7% Historical performance (Yearly) on absolute basis
Year Returns 2024 167.1% 2023 15.9% 2022 7% 2021 -7.7% 2020 -9% 2019 31.4% 2018 35.1% 2017 -10.7% 2016 -4% 2015 52.7% Fund Manager information for DSP World Gold Fund
Name Since Tenure Kaivalya Nadkarni 1 May 25 1.17 Yr. Data below for DSP World Gold Fund as on 31 May 26
Equity Sector Allocation
Sector Value Basic Materials 94.47% Asset Allocation
Asset Class Value Cash 3.62% Equity 94.47% Debt 0% Other 1.91% Top Securities Holdings / Portfolio
Name Holding Value Quantity BGF World Gold I2
Investment Fund | -68% ₹1,141 Cr 1,005,044 VanEck Gold Miners ETF
- | GDX29% ₹490 Cr 573,719 Treps / Reverse Repo Investments
CBLO/Reverse Repo | -3% ₹54 Cr Net Receivables/Payables
Net Current Assets | -0% -₹6 Cr 2. SBI Gold Fund
SBI Gold Fund
Growth Launch Date 12 Sep 11 NAV (17 Jul 26) ₹40.7868 ↓ -0.27 (-0.66 %) Net Assets (Cr) ₹16,533 on 31 May 26 Category Gold - Gold AMC SBI Funds Management Private Limited Rating ☆☆ Risk Moderately High Expense Ratio 0.3 Sharpe Ratio 1.93 Information Ratio 0 Alpha Ratio 0 Min Investment 5,000 Min SIP Investment 500 Exit Load 0-1 Years (1%),1 Years and above(NIL) Growth of 10,000 investment over the years.
Date Value 30 Jun 21 ₹10,000 30 Jun 22 ₹10,828 30 Jun 23 ₹12,154 30 Jun 24 ₹14,949 30 Jun 25 ₹19,644 30 Jun 26 ₹28,455 Returns for SBI Gold Fund
absolute basis & more than 1 year are on CAGR (Compound Annual Growth Rate) basis. as on 16 Jul 26 Duration Returns 1 Month -6.5% 3 Month -7.3% 6 Month -1.8% 1 Year 42.5% 3 Year 31.6% 5 Year 22.4% 10 Year 15 Year Since launch 9.9% Historical performance (Yearly) on absolute basis
Year Returns 2024 71.5% 2023 19.6% 2022 14.1% 2021 12.6% 2020 -5.7% 2019 27.4% 2018 22.8% 2017 6.4% 2016 3.5% 2015 10% Fund Manager information for SBI Gold Fund
Name Since Tenure Viral Chhadva 1 Mar 26 0.33 Yr. Data below for SBI Gold Fund as on 31 May 26
Asset Allocation
Asset Class Value Cash 1.64% Other 98.36% Top Securities Holdings / Portfolio
Name Holding Value Quantity SBI Gold ETF
- | -100% ₹16,542 Cr 1,246,686,194
↑ 13,950,000 Net Receivable / Payable
CBLO | -0% -₹55 Cr Treps
CBLO/Reverse Repo | -0% ₹45 Cr 3. ICICI Prudential Regular Gold Savings Fund
ICICI Prudential Regular Gold Savings Fund
Growth Launch Date 11 Oct 11 NAV (17 Jul 26) ₹43.1042 ↓ -0.28 (-0.66 %) Net Assets (Cr) ₹6,856 on 31 May 26 Category Gold - Gold AMC ICICI Prudential Asset Management Company Limited Rating ☆ Risk Moderately High Expense Ratio 0.38 Sharpe Ratio 1.79 Information Ratio 0 Alpha Ratio 0 Min Investment 5,000 Min SIP Investment 100 Exit Load 0-15 Months (2%),15 Months and above(NIL) Growth of 10,000 investment over the years.
Date Value 30 Jun 21 ₹10,000 30 Jun 22 ₹10,811 30 Jun 23 ₹12,106 30 Jun 24 ₹14,939 30 Jun 25 ₹19,567 30 Jun 26 ₹28,290 Returns for ICICI Prudential Regular Gold Savings Fund
absolute basis & more than 1 year are on CAGR (Compound Annual Growth Rate) basis. as on 16 Jul 26 Duration Returns 1 Month -6.5% 3 Month -7.4% 6 Month -1.8% 1 Year 42.3% 3 Year 31.5% 5 Year 22.3% 10 Year 15 Year Since launch 10.4% Historical performance (Yearly) on absolute basis
Year Returns 2024 72% 2023 19.5% 2022 13.5% 2021 12.7% 2020 -5.4% 2019 26.6% 2018 22.7% 2017 7.4% 2016 0.8% 2015 8.9% Fund Manager information for ICICI Prudential Regular Gold Savings Fund
Name Since Tenure Manish Banthia 27 Sep 12 13.77 Yr. Nishit Patel 29 Dec 20 5.51 Yr. Ashwini Bharucha 1 Nov 25 0.66 Yr. Venus Ahuja 1 Nov 25 0.66 Yr. Data below for ICICI Prudential Regular Gold Savings Fund as on 31 May 26
Asset Allocation
Asset Class Value Cash 1.86% Other 98.14% Top Securities Holdings / Portfolio
Name Holding Value Quantity ICICI Pru Gold ETF
- | -100% ₹6,851 Cr 514,675,516
↑ 10,666,563 Treps
CBLO/Reverse Repo | -0% ₹22 Cr Net Current Assets
Net Current Assets | -0% -₹18 Cr 4. Aditya Birla Sun Life Gold Fund
Aditya Birla Sun Life Gold Fund
Growth Launch Date 20 Mar 12 NAV (17 Jul 26) ₹40.5275 ↓ -0.23 (-0.57 %) Net Assets (Cr) ₹1,822 on 31 May 26 Category Gold - Gold AMC Birla Sun Life Asset Management Co Ltd Rating ☆☆☆ Risk Moderately High Expense Ratio 0.51 Sharpe Ratio 1.76 Information Ratio 0 Alpha Ratio 0 Min Investment 100 Min SIP Investment 100 Exit Load 0-365 Days (1%),365 Days and above(NIL) Growth of 10,000 investment over the years.
Date Value 30 Jun 21 ₹10,000 30 Jun 22 ₹10,697 30 Jun 23 ₹12,029 30 Jun 24 ₹14,752 30 Jun 25 ₹19,394 30 Jun 26 ₹28,089 Returns for Aditya Birla Sun Life Gold Fund
absolute basis & more than 1 year are on CAGR (Compound Annual Growth Rate) basis. as on 16 Jul 26 Duration Returns 1 Month -6.4% 3 Month -7.3% 6 Month -1.7% 1 Year 42.6% 3 Year 31.5% 5 Year 22.1% 10 Year 15 Year Since launch 10.3% Historical performance (Yearly) on absolute basis
Year Returns 2024 72% 2023 18.7% 2022 14.5% 2021 12.3% 2020 -5% 2019 26% 2018 21.3% 2017 6.8% 2016 1.6% 2015 11.5% Fund Manager information for Aditya Birla Sun Life Gold Fund
Name Since Tenure Priya Sridhar 31 Dec 24 1.5 Yr. Data below for Aditya Birla Sun Life Gold Fund as on 31 May 26
Asset Allocation
Asset Class Value Cash 1.57% Other 98.43% Top Securities Holdings / Portfolio
Name Holding Value Quantity Aditya BSL Gold ETF
- | -100% ₹1,821 Cr 133,076,381
↑ 939,171 Clearing Corporation Of India Limited
CBLO/Reverse Repo | -0% ₹5 Cr Net Receivables / (Payables)
Net Current Assets | -0% -₹4 Cr 5. HDFC Gold Fund
HDFC Gold Fund
Growth Launch Date 24 Oct 11 NAV (17 Jul 26) ₹41.6114 ↓ -0.25 (-0.60 %) Net Assets (Cr) ₹12,121 on 31 May 26 Category Gold - Gold AMC HDFC Asset Management Company Limited Rating ☆ Risk Moderately High Expense Ratio 0.49 Sharpe Ratio 1.92 Information Ratio 0 Alpha Ratio 0 Min Investment 5,000 Min SIP Investment 300 Exit Load 0-6 Months (2%),6-12 Months (1%),12 Months and above(NIL) Growth of 10,000 investment over the years.
Date Value 30 Jun 21 ₹10,000 30 Jun 22 ₹10,756 30 Jun 23 ₹12,087 30 Jun 24 ₹14,920 30 Jun 25 ₹19,484 30 Jun 26 ₹28,127 Returns for HDFC Gold Fund
absolute basis & more than 1 year are on CAGR (Compound Annual Growth Rate) basis. as on 16 Jul 26 Duration Returns 1 Month -6.4% 3 Month -7.2% 6 Month -1.9% 1 Year 42.3% 3 Year 31.4% 5 Year 22.2% 10 Year 15 Year Since launch 10.2% Historical performance (Yearly) on absolute basis
Year Returns 2024 71.3% 2023 18.9% 2022 14.1% 2021 12.7% 2020 -5.5% 2019 27.5% 2018 21.7% 2017 6.6% 2016 2.8% 2015 10.1% Fund Manager information for HDFC Gold Fund
Name Since Tenure Arun Agarwal 15 Feb 23 3.38 Yr. Nandita Menezes 29 Mar 25 1.26 Yr. Data below for HDFC Gold Fund as on 31 May 26
Asset Allocation
Asset Class Value Cash 1.47% Other 98.53% Top Securities Holdings / Portfolio
Name Holding Value Quantity HDFC Gold ETF
- | -100% ₹12,121 Cr 912,670,937
↑ 12,580,000 Treps - Tri-Party Repo
CBLO/Reverse Repo | -0% ₹17 Cr Net Current Assets
Net Current Assets | -0% -₹17 Cr 6. Nippon India Gold Savings Fund
Nippon India Gold Savings Fund
Growth Launch Date 7 Mar 11 NAV (17 Jul 26) ₹53.2605 ↓ -0.31 (-0.58 %) Net Assets (Cr) ₹7,553 on 31 May 26 Category Gold - Gold AMC Nippon Life Asset Management Ltd. Rating ☆☆ Risk Moderately High Expense Ratio 0.35 Sharpe Ratio 1.74 Information Ratio 0 Alpha Ratio 0 Min Investment 5,000 Min SIP Investment 100 Exit Load 0-1 Years (2%),1 Years and above(NIL) Growth of 10,000 investment over the years.
Date Value 30 Jun 21 ₹10,000 30 Jun 22 ₹10,753 30 Jun 23 ₹12,075 30 Jun 24 ₹14,797 30 Jun 25 ₹19,451 30 Jun 26 ₹28,091 Returns for Nippon India Gold Savings Fund
absolute basis & more than 1 year are on CAGR (Compound Annual Growth Rate) basis. as on 16 Jul 26 Duration Returns 1 Month -6.5% 3 Month -7.3% 6 Month -1.9% 1 Year 42.1% 3 Year 31.4% 5 Year 22.1% 10 Year 15 Year Since launch 11.5% Historical performance (Yearly) on absolute basis
Year Returns 2024 71.2% 2023 19% 2022 14.3% 2021 12.3% 2020 -5.5% 2019 26.6% 2018 22.5% 2017 6% 2016 1.7% 2015 11.6% Fund Manager information for Nippon India Gold Savings Fund
Name Since Tenure Himanshu Mange 23 Dec 23 2.52 Yr. Data below for Nippon India Gold Savings Fund as on 31 May 26
Asset Allocation
Asset Class Value Cash 1.61% Other 98.39% Top Securities Holdings / Portfolio
Name Holding Value Quantity Nippon India ETF Gold BeES
- | -100% ₹7,553 Cr 587,063,572
↑ 5,276,000 Triparty Repo
CBLO/Reverse Repo | -0% ₹13 Cr Net Current Assets
Net Current Assets | -0% -₹12 Cr Cash Margin - Ccil
CBLO/Reverse Repo | -0% ₹0 Cr 7. Kotak Gold Fund
Kotak Gold Fund
Growth Launch Date 25 Mar 11 NAV (17 Jul 26) ₹53.5283 ↓ -0.27 (-0.50 %) Net Assets (Cr) ₹7,065 on 31 May 26 Category Gold - Gold AMC Kotak Mahindra Asset Management Co Ltd Rating ☆ Risk Moderately High Expense Ratio 0.5 Sharpe Ratio 2.12 Information Ratio 0 Alpha Ratio 0 Min Investment 5,000 Min SIP Investment 1,000 Exit Load 0-6 Months (2%),6-12 Months (1%),12 Months and above(NIL) Growth of 10,000 investment over the years.
Date Value 30 Jun 21 ₹10,000 30 Jun 22 ₹10,677 30 Jun 23 ₹11,934 30 Jun 24 ₹14,710 30 Jun 25 ₹19,261 30 Jun 26 ₹27,849 Returns for Kotak Gold Fund
absolute basis & more than 1 year are on CAGR (Compound Annual Growth Rate) basis. as on 16 Jul 26 Duration Returns 1 Month -6.3% 3 Month -7.3% 6 Month -1.5% 1 Year 42.2% 3 Year 31.4% 5 Year 22% 10 Year 15 Year Since launch 11.6% Historical performance (Yearly) on absolute basis
Year Returns 2024 70.4% 2023 18.9% 2022 13.9% 2021 11.7% 2020 -4.7% 2019 26.6% 2018 24.1% 2017 7.3% 2016 2.5% 2015 10.2% Fund Manager information for Kotak Gold Fund
Name Since Tenure Abhishek Bisen 25 Mar 11 15.28 Yr. Jeetu Sonar 1 Oct 22 3.75 Yr. Data below for Kotak Gold Fund as on 31 May 26
Asset Allocation
Asset Class Value Cash 1.6% Other 98.4% Top Securities Holdings / Portfolio
Name Holding Value Quantity Kotak Gold ETF
- | -100% ₹7,050 Cr 542,538,125
↑ 6,708,000 Triparty Repo
CBLO/Reverse Repo | -0% ₹26 Cr Net Current Assets/(Liabilities)
Net Current Assets | -0% -₹11 Cr 8. IDBI Gold Fund
IDBI Gold Fund
Growth Launch Date 14 Aug 12 NAV (17 Jul 26) ₹36.1168 ↓ -0.33 (-0.90 %) Net Assets (Cr) ₹824 on 31 May 26 Category Gold - Gold AMC IDBI Asset Management Limited Rating Risk Moderately High Expense Ratio 0.64 Sharpe Ratio 1.82 Information Ratio 0 Alpha Ratio 0 Min Investment 5,000 Min SIP Investment 500 Exit Load 0-12 Months (1%),12 Months and above(NIL) Growth of 10,000 investment over the years.
Date Value 30 Jun 21 ₹10,000 30 Jun 22 ₹10,739 30 Jun 23 ₹12,175 30 Jun 24 ₹14,979 30 Jun 25 ₹19,637 30 Jun 26 ₹28,198 Returns for IDBI Gold Fund
absolute basis & more than 1 year are on CAGR (Compound Annual Growth Rate) basis. as on 16 Jul 26 Duration Returns 1 Month -6.7% 3 Month -7.4% 6 Month -2.2% 1 Year 41.2% 3 Year 31.3% 5 Year 22.4% 10 Year 15 Year Since launch 9.7% Historical performance (Yearly) on absolute basis
Year Returns 2024 79% 2023 18.7% 2022 14.8% 2021 12% 2020 -4% 2019 24.2% 2018 21.6% 2017 5.8% 2016 1.4% 2015 8.3% Fund Manager information for IDBI Gold Fund
Name Since Tenure Sumit Bhatnagar 1 Jun 24 2.08 Yr. Data below for IDBI Gold Fund as on 31 May 26
Asset Allocation
Asset Class Value Cash 1.65% Other 98.35% Top Securities Holdings / Portfolio
Name Holding Value Quantity LIC MF Gold ETF
- | -100% ₹823 Cr 58,774,200
↑ 705,000 Treps
CBLO/Reverse Repo | -0% ₹3 Cr Net Receivables / (Payables)
CBLO | -0% -₹2 Cr 9. Axis Gold Fund
Axis Gold Fund
Growth Launch Date 20 Oct 11 NAV (17 Jul 26) ₹40.4465 ↓ -0.28 (-0.69 %) Net Assets (Cr) ₹3,092 on 31 May 26 Category Gold - Gold AMC Axis Asset Management Company Limited Rating ☆ Risk Moderately High Expense Ratio 0.5 Sharpe Ratio 2.08 Information Ratio 0 Alpha Ratio 0 Min Investment 5,000 Min SIP Investment 1,000 Exit Load 0-1 Years (1%),1 Years and above(NIL) Growth of 10,000 investment over the years.
Date Value 30 Jun 21 ₹10,000 30 Jun 22 ₹10,819 30 Jun 23 ₹12,177 30 Jun 24 ₹14,959 30 Jun 25 ₹19,547 30 Jun 26 ₹28,179 Returns for Axis Gold Fund
absolute basis & more than 1 year are on CAGR (Compound Annual Growth Rate) basis. as on 16 Jul 26 Duration Returns 1 Month -6.5% 3 Month -7.3% 6 Month -2% 1 Year 41.9% 3 Year 31.1% 5 Year 22.2% 10 Year 15 Year Since launch 9.9% Historical performance (Yearly) on absolute basis
Year Returns 2024 69.8% 2023 19.2% 2022 14.7% 2021 12.5% 2020 -4.7% 2019 26.9% 2018 23.1% 2017 8.3% 2016 0.7% 2015 10.7% Fund Manager information for Axis Gold Fund
Name Since Tenure Aditya Pagaria 9 Nov 21 4.64 Yr. Pratik Tibrewal 1 Feb 25 1.41 Yr. Data below for Axis Gold Fund as on 31 May 26
Asset Allocation
Asset Class Value Cash 1.81% Other 98.19% Top Securities Holdings / Portfolio
Name Holding Value Quantity Axis Gold ETF
- | -100% ₹3,091 Cr 238,687,058
↑ 2,659,572 Clearing Corporation Of India Ltd
CBLO | -0% ₹6 Cr Net Receivables / (Payables)
CBLO | -0% -₹5 Cr 10. Invesco India Gold Fund
Invesco India Gold Fund
Growth Launch Date 5 Dec 11 NAV (17 Jul 26) ₹39.0681 ↓ -0.27 (-0.68 %) Net Assets (Cr) ₹503 on 31 May 26 Category Gold - Gold AMC Invesco Asset Management (India) Private Ltd Rating ☆☆☆ Risk Moderately High Expense Ratio 0.37 Sharpe Ratio 1.87 Information Ratio 0 Alpha Ratio 0 Min Investment 5,000 Min SIP Investment 500 Exit Load 0-6 Months (2%),6-12 Months (1%),12 Months and above(NIL) Growth of 10,000 investment over the years.
Date Value 30 Jun 21 ₹10,000 30 Jun 22 ₹10,804 30 Jun 23 ₹12,110 30 Jun 24 ₹14,923 30 Jun 25 ₹19,434 30 Jun 26 ₹27,889 Returns for Invesco India Gold Fund
absolute basis & more than 1 year are on CAGR (Compound Annual Growth Rate) basis. as on 16 Jul 26 Duration Returns 1 Month -6.4% 3 Month -7.1% 6 Month -1.6% 1 Year 41.4% 3 Year 31.1% 5 Year 22.1% 10 Year 15 Year Since launch 9.8% Historical performance (Yearly) on absolute basis
Year Returns 2024 69.6% 2023 18.8% 2022 14.5% 2021 12.8% 2020 -5.5% 2019 27.2% 2018 21.4% 2017 6.6% 2016 1.3% 2015 21.6% Fund Manager information for Invesco India Gold Fund
Name Since Tenure Abhisek Bahinipati 1 Nov 25 0.66 Yr. Data below for Invesco India Gold Fund as on 31 May 26
Asset Allocation
Asset Class Value Cash 3.8% Other 96.2% Top Securities Holdings / Portfolio
Name Holding Value Quantity Invesco India Gold ETF
- | -98% ₹491 Cr 36,331,900
↑ 120,000 Triparty Repo
CBLO/Reverse Repo | -2% ₹12 Cr Net Receivables / (Payables)
CBLO | -0% ₹0 Cr
മുകളിൽ പറഞ്ഞതുപോലെ, ഒരു മികച്ച മ്യൂച്വൽ ഫണ്ട് തിരഞ്ഞെടുക്കുന്നത് ഗവേഷണം ആവശ്യമുള്ള മടുപ്പിക്കുന്ന ജോലിയാണ്. മികച്ച മ്യൂച്വൽ ഫണ്ട് സ്കീം തിരഞ്ഞെടുക്കുന്നതിൽ നിങ്ങൾ ശ്രദ്ധാലുവായിരിക്കണം, ഒരാൾ എല്ലാ അപകടസാധ്യതകളും വിലയിരുത്തുകയും മികച്ചതും മികച്ചതുമായ മ്യൂച്വൽ ഫണ്ട് തിരഞ്ഞെടുക്കുന്നതിലേക്ക് പോകുന്ന നിരവധി ഘടകങ്ങൾ കണക്കിലെടുക്കുകയും വേണം. പതിവായി നിക്ഷേപിക്കുന്നത് അസ്ഥിരതയുടെ അപകടസാധ്യത കുറയ്ക്കുകയും നിങ്ങൾക്ക് മികച്ച വരുമാനം നൽകുകയും ചെയ്യുന്നു. ഒരാൾ കാലക്രമേണ സ്ഥിരമായി നിക്ഷേപിച്ചാൽ അത് ഭാവിയിൽ നല്ല ഫലങ്ങളിലേക്ക് നയിക്കും. എപ്പോഴും ഓർക്കുക, മാർക്കറ്റ് ടൈമിംഗല്ല പണമുണ്ടാക്കുന്നത്, നിങ്ങൾ വിപണിയിൽ ചെലവഴിക്കുന്ന സമയമാണ്!
ഇവിടെ നൽകിയിരിക്കുന്ന വിവരങ്ങൾ കൃത്യമാണെന്ന് ഉറപ്പാക്കാൻ എല്ലാ ശ്രമങ്ങളും നടത്തിയിട്ടുണ്ട്. എന്നിരുന്നാലും, ഡാറ്റയുടെ കൃത്യത സംബന്ധിച്ച് യാതൊരു ഉറപ്പും നൽകുന്നില്ല. എന്തെങ്കിലും നിക്ഷേപം നടത്തുന്നതിന് മുമ്പ് സ്കീം വിവര രേഖ ഉപയോഗിച്ച് പരിശോധിക്കുക.


AMFI Registration No. 112358 | CIN: U74999MH2016PTC282153
Shepard Technologies Pvt. Ltd. (with ARN code 112358) makes no warranties or representations, express or implied, on products offered through the platform. It accepts no liability for any damages or losses, however caused, in connection with the use of, or on the reliance of its product or related services. Terms and conditions of the website are applicable.
©2026 Shepard Technologies Private Limited. All Rights Reserved
Nice post, thanks