എസ്ഐപിയിലെ അപകടസാധ്യത: എസ്ഐപി നിക്ഷേപത്തിലെ അപകടസാധ്യതയുടെ വിലയിരുത്തൽ
അപകടസാധ്യതഎസ്.ഐ.പി വ്യത്യസ്തമായി വ്യത്യാസപ്പെടുന്നുമ്യൂച്വൽ ഫണ്ടുകളുടെ തരങ്ങൾ.മ്യൂച്വൽ ഫണ്ടുകളിൽ നിക്ഷേപിക്കുന്നു SIP വഴി (സിസ്റ്റമാറ്റിക്നിക്ഷേപ പദ്ധതി) ഉൾപ്പെടുന്നുവിപണി ബന്ധപ്പെട്ട അപകടസാധ്യതകൾ, അത് തീർച്ചയായും ഉയർന്നതാണ്ഇക്വിറ്റി ഫണ്ടുകൾ കടവും സമതുലിതവുമായതിനേക്കാൾമ്യൂച്വൽ ഫണ്ടുകൾ. എസ്ഐപിയിലെ അപകടസാധ്യത പരിഗണിച്ച് തിരഞ്ഞെടുക്കുന്ന നിക്ഷേപ ഓപ്ഷനെ ആശ്രയിച്ചിരിക്കുന്നുറിസ്ക് പ്രൊഫൈൽ, റിസ്ക് വിശപ്പ് ഒപ്പംദ്രവ്യത. എന്നിരുന്നാലും, SIP-യിലെ അപകടസാധ്യത ഫണ്ട് മാനേജർമാർക്കും ഫണ്ട് ഹൗസിനും നിയന്ത്രിക്കാനും കുറയ്ക്കാനും കഴിയും.
SIP-യിലെ അപകടസാധ്യത കണക്കാക്കാൻ വിവിധ ടൂളുകൾ ലഭ്യമാണ്സിപ്പ് കാൽക്കുലേറ്റർ (SIP റിട്ടേൺ കാൽക്കുലേറ്റർ എന്നും അറിയപ്പെടുന്നു).
എസ്ഐപിയിലെ അപകടസാധ്യത: എസ്ഐപി അപകടസാധ്യതകളുടെ വിലയിരുത്തൽ
റിസ്ക് 1: SIP നെഗറ്റീവായ റിട്ടേൺ അല്ലെങ്കിൽ പ്രൈസ് റിസ്ക് ലഭിക്കാനുള്ള സാധ്യത
മ്യൂച്വൽ ഫണ്ട് നിക്ഷേപങ്ങൾ മാർക്കറ്റ് റിസ്കുകൾക്ക് വിധേയമാണ്, ഇത് സാധാരണയായി കേൾക്കുന്ന പദമാണ്. ഇതിനർത്ഥം, ഒരു എസ്ഐപിയിലെ നിങ്ങളുടെ നിക്ഷേപം കുറയുകയും വിപണി എങ്ങനെ പ്രവർത്തിക്കുന്നു എന്നതിനെ ആശ്രയിച്ച് നിങ്ങൾ നിക്ഷേപിച്ചതിനേക്കാൾ കുറഞ്ഞ മൂല്യത്തിൽ നിങ്ങൾക്ക് അവസാനിക്കുകയും ചെയ്യാം.
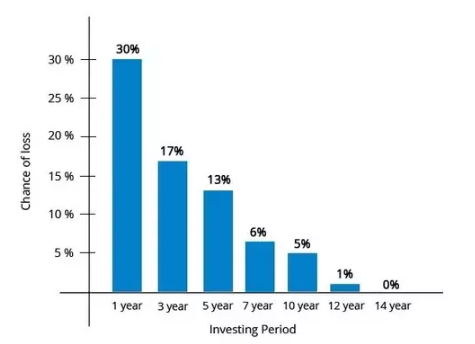
എസ്ഐപിയിലെ അപകടസാധ്യത ഹോൾഡിംഗ് കാലയളവുമായി ബന്ധപ്പെട്ടിരിക്കുന്നു, സാധാരണയായി ഹോൾഡിംഗ് കാലയളവ് കൂടുന്തോറും അപകടസാധ്യത കുറയും. ഉയർന്ന ഹോൾഡിംഗ് കാലയളവ് കൊണ്ട് ലാഭം നേടാനുള്ള സാധ്യത വർദ്ധിക്കുന്നു. ഉദാ. ഇക്വിറ്റിക്കായി ചുവടെ നോക്കുക, ഇക്വിറ്റിയുടെ ദീർഘകാല ഹോൾഡിംഗ് കാലയളവ് നഷ്ടത്തിനുള്ള സാധ്യത കുറയ്ക്കുന്നു. (ചുവടെയുള്ളത് 1979 മുതൽ 2016 വരെയുള്ള ബിഎസ്ഇ സെൻസെക്സിൽ നടത്തിയ ഒരു വിശകലനമാണ്).
അപകടസാധ്യത 2: നിങ്ങളുടെ പണം വേഗത്തിൽ തിരികെ ലഭിക്കുന്നതിനുള്ള അപകടസാധ്യത അല്ലെങ്കിൽ പണലഭ്യത അപകടസാധ്യത
നിങ്ങളുടെ പണം വേഗത്തിൽ തിരികെ ലഭിക്കാനുള്ള കഴിവ് ഇതിനെ ആശ്രയിച്ചിരിക്കുന്നുഅടിവരയിടുന്നു നിക്ഷേപങ്ങൾ. സാധാരണയായി മ്യൂച്വൽ ഫണ്ടുകളിൽ ഇത് ഒരു പ്രശ്നമല്ല, എന്നിരുന്നാലും, സെക്യൂരിറ്റികൾ വിൽക്കുന്നതിൽ പ്രശ്നമുണ്ടായ കാലഘട്ടങ്ങൾ (2008-ൽ).ബോണ്ടുകൾ) കൂടാതെ ചില മ്യൂച്വൽ ഫണ്ടുകൾക്ക് ചില സ്കീമുകളിൽ നിന്നുള്ള പിൻവലിക്കലുകൾ പരിമിതപ്പെടുത്തേണ്ടി വരും. ഇക്വിറ്റി മാർക്കറ്റ് വളരെ ദ്രാവകമാണ് (അർത്ഥം വാങ്ങലും വിൽക്കലും ഒരു പ്രശ്നമല്ല). എന്നിരുന്നാലും, വിൽപ്പന അളവ് വാങ്ങുന്നവരുടെ എണ്ണത്തേക്കാൾ വലിയ തുകയേക്കാൾ കൂടുതലാണെങ്കിൽ, ഇത് ഒരു പ്രശ്നത്തിന് കാരണമാകും, അതിനാൽ തുടർന്നുള്ള പേഔട്ടുകൾ ഒരു പ്രശ്നമാക്കുകയും അതുവഴി ലിക്വിഡിറ്റി റിസ്ക് ഉണ്ടാക്കുകയും ചെയ്യും.
റിസ്ക് 3: ഒരു സെക്യൂരിറ്റി അല്ലെങ്കിൽ ക്രെഡിറ്റ് റിസ്ക് തരംതാഴ്ത്താനുള്ള സാധ്യത
ഒരു പ്രത്യേക കമ്പനിയുടെ/എന്റിറ്റിയുടെ ബോണ്ട് ക്രെഡിറ്റ് റേറ്റിംഗ് ഏജൻസി തരംതാഴ്ത്തുമ്പോൾ, അതിന്റെ വില കുറയുന്നു. വില കുറയുകയാണെങ്കിൽ, ഇത് പോർട്ട്ഫോളിയോയുടെ മൊത്തത്തിലുള്ള മൂല്യത്തെ ബാധിക്കും. ഇതിനെ ക്രെഡിറ്റ് റിസ്ക് എന്ന് വിളിക്കുന്നു.
Talk to our investment specialist
റിസ്ക് 4: കമ്പനി ബോണ്ടിന്റെ ഉടമകൾക്ക് അവരുടെ കുടിശ്ശിക അല്ലെങ്കിൽ ഡിഫോൾട്ട് റിസ്ക് നൽകാത്തതിന്റെ റിസ്ക്
ഒരു കമ്പനി ബോണ്ട് ഹോൾഡർമാർക്കുള്ള പേയ്മെന്റുകളിൽ വീഴ്ച വരുത്തുമ്പോൾ, അതിനെ വിളിക്കുന്നുഡിഫോൾട്ട് റിസ്ക്.
കൂടെനിക്ഷേപകൻ അവരുടെ പണം തിരികെ ലഭിക്കുന്നില്ല, ഇത് അവരുടെ പോർട്ട്ഫോളിയോയെ പ്രതികൂലമായി ബാധിക്കും.
അപകടസാധ്യത 5: നിങ്ങളുടെ ഇടപാട് ശരിയായി പ്രോസസ്സ് ചെയ്യുന്നതിനുള്ള അപകടസാധ്യത അല്ലെങ്കിൽ സാങ്കേതിക അപകടസാധ്യത
ഇന്ന് എല്ലാ ഇടപാടുകളും ഇലക്ട്രോണിക് മോഡിലാണ് നടക്കുന്നത്. വിവിധ ടച്ച് പോയിന്റുകൾ ഉപയോഗിച്ച്, വിവിധ സ്ഥലങ്ങളിൽ, ആർ & ടി ഏജന്റിൽ, സാങ്കേതിക പരാജയത്തിന് സാധ്യതയുണ്ട്.ബാങ്ക് ഫണ്ടുകൾ ഡെബിറ്റ് ചെയ്യാൻ മുതലായവ.
ഒരു ഇടപാട് പ്രോസസ്സ് ചെയ്യാത്തതും എസ്ഐപിയിൽ അപകടകരമാണ്.
റിസ്ക് 6: പോർട്ട്ഫോളിയോ മാനേജർ അല്ലെങ്കിൽ ഫണ്ട് മാനേജ്മെന്റ് റിസ്ക് സ്കീം പ്രകടനത്തിന്റെ അപകടസാധ്യത

എസ്ഐപിയിലെ മറ്റൊരു അപകടസാധ്യത, തിരഞ്ഞെടുത്ത സ്കീം പ്രതീക്ഷകൾക്ക് അനുസൃതമായി നൽകില്ല, പ്രകടനം പ്രതീക്ഷിച്ചതിലും വളരെ കുറവായിരിക്കാം. ഫണ്ട് മാനേജർ പെർഫോമൻസ് കുറവായേക്കാം, ഇത് കുറഞ്ഞ വരുമാനത്തിലേക്ക് നയിക്കുംSIP നിക്ഷേപം.
ഒരു SIP-യിലെ പ്രധാന അപകടസാധ്യതകൾ ഇവയാണ്, അതേസമയം നമുക്ക് SIP-യിലെ കൂടുതൽ അപകടസാധ്യതകൾ വിശദീകരിക്കാം.സമ്പദ് അപകടസാധ്യത മുതലായവ, ഈ അപകടസാധ്യതകളിൽ ഭൂരിഭാഗവും മുകളിലുള്ള ഒന്നോ അതിലധികമോ വിഭാഗങ്ങൾക്ക് കീഴിലായിരിക്കും.
എസ്ഐപിയിൽ തീർച്ചയായും അപകടസാധ്യതയുണ്ടെങ്കിലും, എസ്ഐപി അല്ലെങ്കിൽ ലംപ് സം, ഇതൊരു നിക്ഷേപ മാർഗം മാത്രമാണെന്നും അടിസ്ഥാന നിക്ഷേപമല്ലെന്നും എപ്പോഴും ഓർക്കണം. അടിസ്ഥാന നിക്ഷേപം, അതിന്റെ അപകടസാധ്യതകൾ എന്നിവ പരിശോധിച്ച് അന്തിമ തീരുമാനം എടുക്കേണ്ടതുണ്ട്.
*ഇതിന്റെ ലിസ്റ്റ് ചുവടെയുണ്ട്ടോപ്പ് SIPനിക്ഷേപിക്കാൻ ഒരാൾക്ക് വിലയിരുത്താം "The primary investment objective of the Scheme is to seek capital appreciation by investing predominantly in units of MLIIF - WGF. The Scheme may, at the discretion of the Investment Manager, also invest in the units of other similar overseas mutual fund schemes, which may constitute a significant part of its corpus. The Scheme may also invest a certain portion of its corpus in money market securities and/or units of money market/liquid schemes of DSP Merrill Lynch Mutual Fund, in order to meet liquidity requirements from time to time. However, there is no assurance that the investment objective of the Scheme will be realized." Below is the key information for DSP World Gold Fund Returns up to 1 year are on The primary investment objective of the Scheme is to seek capital appreciation by investing predominantly in units of BGF – USFEF. The Scheme may, at the discretion of the Investment Manager also invest in the units of other similar overseas mutual fund schemes, which may constitute a significant part of its corpus. The Scheme may also invest a certain portion of its corpus in money market securities and/or money market/liquid schemes of DSP BlackRock Mutual Fund, in order to meet liquidity requirements from time to time. However, there is no assurance that the investment objective of the Scheme will be realized. It shall be noted ‘similar overseas mutual fund schemes’ shall have investment objective, investment strategy and risk profile/consideration similar to those of BGF – USFEF. Research Highlights for DSP US Flexible Equity Fund Below is the key information for DSP US Flexible Equity Fund Returns up to 1 year are on (Erstwhile UTI Pharma & Healthcare Fund) The Investment objective of the Scheme is capital appreciation through investments in equities and equity related instruments of the Pharma & Healthcare sectors. Research Highlights for UTI Healthcare Fund Below is the key information for UTI Healthcare Fund Returns up to 1 year are on The primary investment objective of the Scheme is to seek to provide long term capital growth by investing predominantly in the JPMorgan Funds - Emerging Markets Opportunities Fund, an equity fund which invests primarily in an aggressively managed portfolio of emerging market companies Research Highlights for Edelweiss Emerging Markets Opportunities Equity Off-shore Fund Below is the key information for Edelweiss Emerging Markets Opportunities Equity Off-shore Fund Returns up to 1 year are on The objective of the scheme would be to provide investors with opportunities for long-term growth in capital along with the liquidity of an open-ended scheme through an active management of investments in a diversified basket of equity stocks of domestic Public Sector Undertakings and in debt and money market instruments issued by PSUs AND others. Research Highlights for SBI PSU Fund Below is the key information for SBI PSU Fund Returns up to 1 year are on 1. DSP World Gold Fund
DSP World Gold Fund
Growth Launch Date 14 Sep 07 NAV (15 Jul 26) ₹49.6706 ↓ -0.65 (-1.29 %) Net Assets (Cr) ₹1,679 on 31 May 26 Category Equity - Global AMC DSP BlackRock Invmt Managers Pvt. Ltd. Rating ☆☆☆ Risk High Expense Ratio 1.41 Sharpe Ratio 1.77 Information Ratio -0.78 Alpha Ratio -0.46 Min Investment 1,000 Min SIP Investment 500 Exit Load 0-12 Months (1%),12 Months and above(NIL) Growth of 10,000 investment over the years.
Date Value 30 Jun 21 ₹10,000 30 Jun 22 ₹8,181 30 Jun 23 ₹9,294 30 Jun 24 ₹10,640 30 Jun 25 ₹16,808 30 Jun 26 ₹27,693 Returns for DSP World Gold Fund
absolute basis & more than 1 year are on CAGR (Compound Annual Growth Rate) basis. as on 15 Jul 26 Duration Returns 1 Month -11.6% 3 Month -21.9% 6 Month -16.1% 1 Year 63.3% 3 Year 40.7% 5 Year 21.9% 10 Year 15 Year Since launch 8.9% Historical performance (Yearly) on absolute basis
Year Returns 2025 167.1% 2024 15.9% 2023 7% 2022 -7.7% 2021 -9% 2020 31.4% 2019 35.1% 2018 -10.7% 2017 -4% 2016 52.7% Fund Manager information for DSP World Gold Fund
Name Since Tenure Kaivalya Nadkarni 1 May 25 1.17 Yr. Data below for DSP World Gold Fund as on 31 May 26
Equity Sector Allocation
Sector Value Basic Materials 94.47% Asset Allocation
Asset Class Value Cash 3.62% Equity 94.47% Debt 0% Other 1.91% Top Securities Holdings / Portfolio
Name Holding Value Quantity BGF World Gold I2
Investment Fund | -68% ₹1,141 Cr 1,005,044 VanEck Gold Miners ETF
- | GDX29% ₹490 Cr 573,719 Treps / Reverse Repo Investments
CBLO/Reverse Repo | -3% ₹54 Cr Net Receivables/Payables
Net Current Assets | -0% -₹6 Cr 2. DSP US Flexible Equity Fund
DSP US Flexible Equity Fund
Growth Launch Date 3 Aug 12 NAV (15 Jul 26) ₹94.2682 ↓ -0.06 (-0.07 %) Net Assets (Cr) ₹1,323 on 31 May 26 Category Equity - Global AMC DSP BlackRock Invmt Managers Pvt. Ltd. Rating ☆☆☆☆☆ Risk High Expense Ratio 1.55 Sharpe Ratio 2.57 Information Ratio 0.13 Alpha Ratio -3.23 Min Investment 1,000 Min SIP Investment 500 Exit Load 0-12 Months (1%),12 Months and above(NIL) Growth of 10,000 investment over the years.
Date Value 30 Jun 21 ₹10,000 30 Jun 22 ₹9,273 30 Jun 23 ₹11,265 30 Jun 24 ₹13,557 30 Jun 25 ₹15,785 30 Jun 26 ₹23,371 Returns for DSP US Flexible Equity Fund
absolute basis & more than 1 year are on CAGR (Compound Annual Growth Rate) basis. as on 15 Jul 26 Duration Returns 1 Month 0.4% 3 Month 12.4% 6 Month 20.9% 1 Year 48.3% 3 Year 27% 5 Year 18.3% 10 Year 15 Year Since launch 17.5% Historical performance (Yearly) on absolute basis
Year Returns 2025 33.8% 2024 17.8% 2023 22% 2022 -5.9% 2021 24.2% 2020 22.6% 2019 27.5% 2018 -1.1% 2017 15.5% 2016 9.8% Fund Manager information for DSP US Flexible Equity Fund
Name Since Tenure Kaivalya Nadkarni 1 May 25 1.17 Yr. Data below for DSP US Flexible Equity Fund as on 31 May 26
Equity Sector Allocation
Sector Value Technology 33.05% Industrials 13.62% Financial Services 12.17% Communication Services 12.05% Consumer Cyclical 9.62% Health Care 7.65% Basic Materials 2.45% Energy 2.43% Asset Allocation
Asset Class Value Cash 6.96% Equity 93.02% Debt 0.01% Top Securities Holdings / Portfolio
Name Holding Value Quantity BGF US Flexible Equity I2
Investment Fund | -96% ₹1,265 Cr 1,784,131
↓ -32,921 Treps / Reverse Repo Investments
CBLO/Reverse Repo | -4% ₹59 Cr Net Receivables/Payables
Net Current Assets | -0% -₹2 Cr 3. UTI Healthcare Fund
UTI Healthcare Fund
Growth Launch Date 28 Jun 99 NAV (16 Jul 26) ₹335.106 ↑ 1.17 (0.35 %) Net Assets (Cr) ₹1,217 on 31 May 26 Category Equity - Sectoral AMC UTI Asset Management Company Ltd Rating ☆ Risk High Expense Ratio 2.26 Sharpe Ratio 0.42 Information Ratio 0.08 Alpha Ratio 0.91 Min Investment 5,000 Min SIP Investment 500 Exit Load 0-1 Years (1%),1 Years and above(NIL) Growth of 10,000 investment over the years.
Date Value 30 Jun 21 ₹10,000 30 Jun 22 ₹8,478 30 Jun 23 ₹10,006 30 Jun 24 ₹14,264 30 Jun 25 ₹17,337 30 Jun 26 ₹19,764 Returns for UTI Healthcare Fund
absolute basis & more than 1 year are on CAGR (Compound Annual Growth Rate) basis. as on 15 Jul 26 Duration Returns 1 Month 7.4% 3 Month 18% 6 Month 20.7% 1 Year 13.4% 3 Year 26% 5 Year 14.5% 10 Year 15 Year Since launch 15% Historical performance (Yearly) on absolute basis
Year Returns 2025 -3.1% 2024 42.9% 2023 38.2% 2022 -12.3% 2021 19.1% 2020 67.4% 2019 1.2% 2018 -7.5% 2017 6.2% 2016 -9.7% Fund Manager information for UTI Healthcare Fund
Name Since Tenure Kamal Gada 2 May 22 4.17 Yr. Data below for UTI Healthcare Fund as on 31 May 26
Equity Sector Allocation
Sector Value Health Care 94.45% Asset Allocation
Asset Class Value Cash 5.55% Equity 94.45% Top Securities Holdings / Portfolio
Name Holding Value Quantity Sun Pharmaceuticals Industries Ltd (Healthcare)
Equity, Since 31 Oct 06 | SUNPHARMA9% ₹108 Cr 600,000 Divi's Laboratories Ltd (Healthcare)
Equity, Since 30 Sep 17 | DIVISLAB5% ₹59 Cr 88,814
↑ 28,076 Ajanta Pharma Ltd (Healthcare)
Equity, Since 31 Jul 17 | AJANTPHARM5% ₹57 Cr 195,295
↓ -41,216 Gland Pharma Ltd (Healthcare)
Equity, Since 30 Nov 20 | GLAND4% ₹48 Cr 215,251 Lupin Ltd (Healthcare)
Equity, Since 28 Feb 25 | LUPIN4% ₹46 Cr 203,834
↓ -6,166 Apollo Hospitals Enterprise Ltd (Healthcare)
Equity, Since 30 Apr 21 | APOLLOHOSP4% ₹43 Cr 53,000 Dr Reddy's Laboratories Ltd (Healthcare)
Equity, Since 28 Feb 18 | DRREDDY3% ₹38 Cr 290,000 Caplin Point Laboratories Ltd (Healthcare)
Equity, Since 31 Dec 23 | CAPLIPOINT3% ₹37 Cr 185,000
↑ 39,847 Alkem Laboratories Ltd (Healthcare)
Equity, Since 31 May 21 | ALKEM3% ₹37 Cr 68,000 Fortis Healthcare Ltd (Healthcare)
Equity, Since 31 Dec 20 | FORTIS3% ₹37 Cr 400,000 4. Edelweiss Emerging Markets Opportunities Equity Off-shore Fund
Edelweiss Emerging Markets Opportunities Equity Off-shore Fund
Growth Launch Date 7 Jul 14 NAV (15 Jul 26) ₹28.4787 ↑ 0.22 (0.78 %) Net Assets (Cr) ₹250 on 31 May 26 Category Equity - Global AMC Edelweiss Asset Management Limited Rating ☆☆☆ Risk High Expense Ratio 1.04 Sharpe Ratio 2.62 Information Ratio -0.4 Alpha Ratio 5.56 Min Investment 5,000 Min SIP Investment 1,000 Exit Load 0-1 Years (1%),1 Years and above(NIL) Growth of 10,000 investment over the years.
Date Value 30 Jun 21 ₹10,000 30 Jun 22 ₹7,234 30 Jun 23 ₹7,605 30 Jun 24 ₹8,447 30 Jun 25 ₹9,445 30 Jun 26 ₹15,783 Returns for Edelweiss Emerging Markets Opportunities Equity Off-shore Fund
absolute basis & more than 1 year are on CAGR (Compound Annual Growth Rate) basis. as on 15 Jul 26 Duration Returns 1 Month -2.1% 3 Month 10.7% 6 Month 27.7% 1 Year 64.1% 3 Year 25.6% 5 Year 9.7% 10 Year 15 Year Since launch 9.1% Historical performance (Yearly) on absolute basis
Year Returns 2025 41.1% 2024 5.9% 2023 5.5% 2022 -16.8% 2021 -5.9% 2020 21.7% 2019 25.1% 2018 -7.2% 2017 30% 2016 9.8% Fund Manager information for Edelweiss Emerging Markets Opportunities Equity Off-shore Fund
Name Since Tenure Bhavesh Jain 9 Apr 18 8.23 Yr. Bharat Lahoti 1 Oct 21 4.75 Yr. Data below for Edelweiss Emerging Markets Opportunities Equity Off-shore Fund as on 31 May 26
Equity Sector Allocation
Sector Value Technology 35.88% Financial Services 20.6% Consumer Cyclical 10.01% Communication Services 7.79% Industrials 5.82% Energy 5.13% Basic Materials 2.8% Consumer Defensive 1.98% Utility 1.27% Health Care 0.52% Asset Allocation
Asset Class Value Cash 6.04% Equity 93.14% Debt 0.01% Other 0.49% Top Securities Holdings / Portfolio
Name Holding Value Quantity JPM Emerging Mkts Opps I acc USD
Investment Fund | -96% ₹241 Cr 102,137
↑ 3,897 Clearing Corporation Of India Ltd.
CBLO/Reverse Repo | -4% ₹10 Cr Net Receivables/(Payables)
CBLO | -0% -₹1 Cr Accrued Interest
CBLO | -0% ₹0 Cr 5. SBI PSU Fund
SBI PSU Fund
Growth Launch Date 7 Jul 10 NAV (16 Jul 26) ₹34.3974 ↓ -0.06 (-0.19 %) Net Assets (Cr) ₹6,594 on 31 May 26 Category Equity - Sectoral AMC SBI Funds Management Private Limited Rating ☆☆ Risk High Expense Ratio 1.89 Sharpe Ratio 0.26 Information Ratio -0.02 Alpha Ratio 0.16 Min Investment 5,000 Min SIP Investment 500 Exit Load 0-1 Years (1%),1 Years and above(NIL) Growth of 10,000 investment over the years.
Date Value 30 Jun 21 ₹10,000 30 Jun 22 ₹9,973 30 Jun 23 ₹13,609 30 Jun 24 ₹26,792 30 Jun 25 ₹26,602 30 Jun 26 ₹28,255 Returns for SBI PSU Fund
absolute basis & more than 1 year are on CAGR (Compound Annual Growth Rate) basis. as on 15 Jul 26 Duration Returns 1 Month -1.2% 3 Month -4.1% 6 Month 0.6% 1 Year 5.9% 3 Year 25.5% 5 Year 23% 10 Year 15 Year Since launch 8% Historical performance (Yearly) on absolute basis
Year Returns 2025 11.3% 2024 23.5% 2023 54% 2022 29% 2021 32.4% 2020 -10% 2019 6% 2018 -23.8% 2017 21.9% 2016 16.2% Fund Manager information for SBI PSU Fund
Name Since Tenure Rohit Shimpi 1 Jun 24 2.08 Yr. Data below for SBI PSU Fund as on 31 May 26
Equity Sector Allocation
Sector Value Financial Services 32.54% Utility 31.22% Industrials 14.07% Energy 11.97% Basic Materials 6.94% Asset Allocation
Asset Class Value Cash 3.18% Equity 96.74% Debt 0.07% Top Securities Holdings / Portfolio
Name Holding Value Quantity State Bank of India (Financial Services)
Equity, Since 31 Jul 10 | SBIN17% ₹1,112 Cr 11,527,500
↑ 1,000,000 GAIL (India) Ltd (Utilities)
Equity, Since 31 May 24 | GAIL10% ₹628 Cr 38,150,000 NTPC Ltd (Utilities)
Equity, Since 31 Jul 10 | NTPC9% ₹597 Cr 15,443,244 Bharat Electronics Ltd (Industrials)
Equity, Since 30 Jun 24 | BEL9% ₹583 Cr 14,185,000
↑ 800,000 Power Grid Corp Of India Ltd (Utilities)
Equity, Since 31 Jul 10 | POWERGRID9% ₹579 Cr 19,935,554 Oil & Natural Gas Corp Ltd (Energy)
Equity, Since 31 May 20 | ONGC6% ₹389 Cr 14,655,000 Bank of Baroda (Financial Services)
Equity, Since 31 Aug 24 | BANKBARODA5% ₹352 Cr 13,100,000 Bharat Petroleum Corp Ltd (Energy)
Equity, Since 31 Aug 24 | BPCL4% ₹289 Cr 9,700,000 Bharat Heavy Electricals Ltd (Industrials)
Equity, Since 30 Jun 25 | BHEL4% ₹271 Cr 6,500,000 NMDC Ltd (Basic Materials)
Equity, Since 31 Oct 23 | NMDC4% ₹245 Cr 27,900,000
ഇവിടെ നൽകിയിരിക്കുന്ന വിവരങ്ങൾ കൃത്യമാണെന്ന് ഉറപ്പാക്കാൻ എല്ലാ ശ്രമങ്ങളും നടത്തിയിട്ടുണ്ട്. എന്നിരുന്നാലും, ഡാറ്റയുടെ കൃത്യത സംബന്ധിച്ച് യാതൊരു ഉറപ്പും നൽകുന്നില്ല. എന്തെങ്കിലും നിക്ഷേപം നടത്തുന്നതിന് മുമ്പ് സ്കീം വിവര രേഖ ഉപയോഗിച്ച് പരിശോധിക്കുക.


AMFI Registration No. 112358 | CIN: U74999MH2016PTC282153
Shepard Technologies Pvt. Ltd. (with ARN code 112358) makes no warranties or representations, express or implied, on products offered through the platform. It accepts no liability for any damages or losses, however caused, in connection with the use of, or on the reliance of its product or related services. Terms and conditions of the website are applicable.
©2026 Shepard Technologies Private Limited. All Rights Reserved
Research Highlights for DSP World Gold Fund