
 +91-22-48913909
गुंतवणुकीसाठी शीर्ष 5 सर्वोत्तम इक्विटी एसआयपी फंड
जर तुम्हाला तुमच्या गुंतवणुकीला सर्वांमध्ये पसंती हवी असेलबाजार अटी, नंतर तुमची गुंतवणूक घ्याSIP मार्ग सिस्टिमॅटिक इन्व्हेस्टमेंट प्लॅन्स (SIPs) हे सर्वात कार्यक्षम मार्ग मानले जातातम्युच्युअल फंडात गुंतवणूक. आणि जर तुम्ही इक्विटीमध्ये गुंतवणूक करण्याची योजना करत असाल, तर उत्सुक परतावा मिळवण्याचा SIP हा सर्वोत्तम मार्ग आहे. सर्वोत्कृष्ट इक्विटी एसआयपी फंड तुम्हाला दीर्घ मुदतीसाठी अपेक्षित परतावा देऊ शकतातआर्थिक उद्दिष्टे. तर, SIP कसे काम करते, याचे फायदे पाहूएसआयपी गुंतवणूक, a चा लक्षणीय वापरसिप कॅल्क्युलेटर इक्विटी गुंतवणुकीसाठी सर्वोत्तम कामगिरी करणाऱ्या एसआयपी फंडांसह.
Talk to our investment specialist
इक्विटी म्युच्युअल फंडासाठी पद्धतशीर गुंतवणूक
तद्वतच, जेव्हा गुंतवणूकदार इक्विटीमध्ये गुंतवणूक करण्याची योजना आखतात, तेव्हा त्यांना परताव्याच्या स्थिरतेबद्दल शंका असते. याचे कारण असे की ते बाजाराशी जोडलेले असतात आणि अनेकदा अस्थिरतेला सामोरे जातात. अशाप्रकारे, अशा अस्थिरतेचा समतोल राखण्यासाठी आणि दीर्घकालीन स्थिर परतावा सुनिश्चित करण्यासाठी, इक्विटी गुंतवणुकीत एसआयपी अत्यंत शिफारसीय आहेत. ऐतिहासिकदृष्ट्या, बाजाराच्या खराब टप्प्यात, हे लक्षात येते की ज्या गुंतवणूकदारांनी SIP मार्ग स्वीकारला होता त्यांनी एकरकमी मार्ग स्वीकारलेल्यांपेक्षा अधिक स्थिर परतावा मिळवला. SIP ची गुंतवणूक कालांतराने पसरलेली असते, एकरकमी गुंतवणुकीच्या विपरीत जी एकाच वेळी होते. त्यामुळे, SIP मध्ये तुमचे पैसे दररोज वाढू लागतात (शेअर मार्केटमध्ये गुंतवले जात आहे).
एक पद्धतशीरगुंतवणूक योजना सारख्या दीर्घकालीन आर्थिक उद्दिष्टे साध्य करण्यासाठी देखील मोठ्या प्रमाणावर मानले जातेनिवृत्ती नियोजन, मुलाचे शिक्षण, घर/कार किंवा इतर कोणतीही मालमत्ता खरेदी. आपण आणखी काही पाहण्याआधीगुंतवणुकीचे फायदे SIP मध्ये, गुंतवणुकीसाठी काही सर्वोत्तम इक्विटी SIP फंड तपासूया.
इक्विटी फंड 2022 साठी सर्वोत्तम SIP योजना
सर्वोत्तम लार्ज कॅप इक्विटी एसआयपी फंड
Fund NAV Net Assets (Cr) Min SIP Investment 3 MO (%) 6 MO (%) 1 YR (%) 3 YR (%) 5 YR (%) 2025 (%) SBI Bluechip Fund Growth ₹97.104
↑ 0.91 ₹52,416 500 3.7 7.2 1.9 10.5 9.2 9.7 Indiabulls Blue Chip Fund Growth ₹44.99
↑ 0.52 ₹138 500 4.1 8.8 1.3 11 8.6 7.5 JM Core 11 Fund Growth ₹20.5418
↑ 0.15 ₹264 500 -0.6 8.8 0.3 10.3 11.2 -1.9 Aditya Birla Sun Life Frontline Equity Fund Growth ₹544.08
↑ 6.67 ₹28,167 100 4 9.4 -0.4 11.2 9.4 9.4 Nippon India Large Cap Fund Growth ₹93.5298
↑ 1.11 ₹52,109 100 4.3 7 -0.5 12.3 12.9 9.2 Note: Returns up to 1 year are on absolute basis & more than 1 year are on CAGR basis. as on 19 Nov 26 Research Highlights & Commentary of 5 Funds showcased
Commentary SBI Bluechip Fund Indiabulls Blue Chip Fund JM Core 11 Fund Aditya Birla Sun Life Frontline Equity Fund Nippon India Large Cap Fund Point 1 Highest AUM (₹52,416 Cr). Bottom quartile AUM (₹138 Cr). Bottom quartile AUM (₹264 Cr). Lower mid AUM (₹28,167 Cr). Upper mid AUM (₹52,109 Cr). Point 2 Established history (20+ yrs). Established history (14+ yrs). Established history (18+ yrs). Oldest track record among peers (24 yrs). Established history (19+ yrs). Point 3 Top rated. Rating: 4★ (upper mid). Rating: 4★ (lower mid). Rating: 4★ (bottom quartile). Rating: 4★ (bottom quartile). Point 4 Risk profile: Moderately High. Risk profile: Moderately High. Risk profile: High. Risk profile: Moderately High. Risk profile: Moderately High. Point 5 5Y return: 9.20% (bottom quartile). 5Y return: 8.63% (bottom quartile). 5Y return: 11.17% (upper mid). 5Y return: 9.36% (lower mid). 5Y return: 12.87% (top quartile). Point 6 3Y return: 10.51% (bottom quartile). 3Y return: 10.98% (lower mid). 3Y return: 10.31% (bottom quartile). 3Y return: 11.18% (upper mid). 3Y return: 12.32% (top quartile). Point 7 1Y return: 1.90% (top quartile). 1Y return: 1.31% (upper mid). 1Y return: 0.26% (lower mid). 1Y return: -0.40% (bottom quartile). 1Y return: -0.48% (bottom quartile). Point 8 Alpha: 2.35 (top quartile). Alpha: 1.50 (upper mid). Alpha: 0.02 (lower mid). Alpha: -0.09 (bottom quartile). Alpha: -0.62 (bottom quartile). Point 9 Sharpe: -0.61 (top quartile). Sharpe: -0.64 (lower mid). Sharpe: -0.62 (upper mid). Sharpe: -0.74 (bottom quartile). Sharpe: -0.79 (bottom quartile). Point 10 Information ratio: -0.13 (bottom quartile). Information ratio: 0.02 (upper mid). Information ratio: -0.09 (bottom quartile). Information ratio: 0.01 (lower mid). Information ratio: 0.40 (top quartile). SBI Bluechip Fund
Indiabulls Blue Chip Fund
JM Core 11 Fund
Aditya Birla Sun Life Frontline Equity Fund
Nippon India Large Cap Fund
सर्वोत्तम लार्ज आणि मिड कॅप इक्विटी एसआयपी फंड
Fund NAV Net Assets (Cr) Min SIP Investment 3 MO (%) 6 MO (%) 1 YR (%) 3 YR (%) 5 YR (%) 2025 (%) Invesco India Growth Opportunities Fund Growth ₹115.9
↑ 1.08 ₹12,438 100 5.3 17 12.1 21.3 16.8 4.7 Kotak Equity Opportunities Fund Growth ₹359.029
↑ 3.62 ₹30,785 1,000 1.1 6.8 1.6 13.1 12.8 5.6 DSP Equity Opportunities Fund Growth ₹635.001
↑ 7.59 ₹21,825 500 2 5.9 -0.4 13.1 11.9 7.1 Aditya Birla Sun Life Equity Advantage Fund Growth ₹968.05
↑ 7.40 ₹5,466 1,000 0 8.5 5.2 11.2 6.7 3.5 Edelweiss Large and Mid Cap Fund Growth ₹91.902
↑ 0.91 ₹4,595 1,000 0.7 6.1 2.6 12.7 11.4 4.1 Note: Returns up to 1 year are on absolute basis & more than 1 year are on CAGR basis. as on 19 Nov 26 Research Highlights & Commentary of 5 Funds showcased
Commentary Invesco India Growth Opportunities Fund Kotak Equity Opportunities Fund DSP Equity Opportunities Fund Aditya Birla Sun Life Equity Advantage Fund Edelweiss Large and Mid Cap Fund Point 1 Lower mid AUM (₹12,438 Cr). Highest AUM (₹30,785 Cr). Upper mid AUM (₹21,825 Cr). Bottom quartile AUM (₹5,466 Cr). Bottom quartile AUM (₹4,595 Cr). Point 2 Established history (19+ yrs). Established history (22+ yrs). Established history (26+ yrs). Oldest track record among peers (31 yrs). Established history (19+ yrs). Point 3 Top rated. Rating: 5★ (upper mid). Rating: 5★ (lower mid). Rating: 4★ (bottom quartile). Rating: 4★ (bottom quartile). Point 4 Risk profile: Moderately High. Risk profile: Moderately High. Risk profile: Moderately High. Risk profile: Moderately High. Risk profile: Moderately High. Point 5 5Y return: 16.83% (top quartile). 5Y return: 12.77% (upper mid). 5Y return: 11.88% (lower mid). 5Y return: 6.69% (bottom quartile). 5Y return: 11.38% (bottom quartile). Point 6 3Y return: 21.34% (top quartile). 3Y return: 13.11% (upper mid). 3Y return: 13.11% (lower mid). 3Y return: 11.25% (bottom quartile). 3Y return: 12.68% (bottom quartile). Point 7 1Y return: 12.09% (top quartile). 1Y return: 1.61% (bottom quartile). 1Y return: -0.43% (bottom quartile). 1Y return: 5.23% (upper mid). 1Y return: 2.58% (lower mid). Point 8 Alpha: 9.53 (top quartile). Alpha: -0.95 (bottom quartile). Alpha: -2.63 (bottom quartile). Alpha: 3.38 (upper mid). Alpha: 1.25 (lower mid). Point 9 Sharpe: -0.08 (top quartile). Sharpe: -0.58 (bottom quartile). Sharpe: -0.68 (bottom quartile). Sharpe: -0.35 (upper mid). Sharpe: -0.46 (lower mid). Point 10 Information ratio: 1.22 (top quartile). Information ratio: -0.03 (bottom quartile). Information ratio: 0.05 (lower mid). Information ratio: -0.39 (bottom quartile). Information ratio: 0.12 (upper mid). Invesco India Growth Opportunities Fund
Kotak Equity Opportunities Fund
DSP Equity Opportunities Fund
Aditya Birla Sun Life Equity Advantage Fund
Edelweiss Large and Mid Cap Fund
सर्वोत्तम मिड कॅप इक्विटी एसआयपी फंड
Fund NAV Net Assets (Cr) Min SIP Investment 3 MO (%) 6 MO (%) 1 YR (%) 3 YR (%) 5 YR (%) 2025 (%) Taurus Discovery (Midcap) Fund Growth ₹129.72
↑ 0.45 ₹135 1,000 1.3 11.3 4.4 9.5 11.5 0.8 Kotak Emerging Equity Scheme Growth ₹141.417
↑ 1.59 ₹64,629 1,000 -4.1 2.2 2.2 14.3 14.1 1.8 Sundaram Mid Cap Fund Growth ₹1,462.49
↑ 13.28 ₹13,453 100 -4 2.5 1.1 15.3 14.9 4.1 Aditya Birla Sun Life Midcap Fund Growth ₹838.59
↑ 7.15 ₹6,283 1,000 -3.1 5.3 3.8 13.3 11.7 4.4 BNP Paribas Mid Cap Fund Growth ₹109.47
↑ 0.57 ₹2,452 300 -3.2 1.4 3.6 13.6 13 2.5 Note: Returns up to 1 year are on absolute basis & more than 1 year are on CAGR basis. as on 19 Nov 26 Research Highlights & Commentary of 5 Funds showcased
Commentary Taurus Discovery (Midcap) Fund Kotak Emerging Equity Scheme Sundaram Mid Cap Fund Aditya Birla Sun Life Midcap Fund BNP Paribas Mid Cap Fund Point 1 Bottom quartile AUM (₹135 Cr). Highest AUM (₹64,629 Cr). Upper mid AUM (₹13,453 Cr). Lower mid AUM (₹6,283 Cr). Bottom quartile AUM (₹2,452 Cr). Point 2 Oldest track record among peers (32 yrs). Established history (19+ yrs). Established history (24+ yrs). Established history (24+ yrs). Established history (20+ yrs). Point 3 Top rated. Rating: 4★ (upper mid). Rating: 4★ (lower mid). Rating: 3★ (bottom quartile). Rating: 3★ (bottom quartile). Point 4 Risk profile: Moderately High. Risk profile: Moderately High. Risk profile: Moderately High. Risk profile: Moderately High. Risk profile: High. Point 5 5Y return: 11.47% (bottom quartile). 5Y return: 14.06% (upper mid). 5Y return: 14.94% (top quartile). 5Y return: 11.66% (bottom quartile). 5Y return: 12.96% (lower mid). Point 6 3Y return: 9.53% (bottom quartile). 3Y return: 14.32% (upper mid). 3Y return: 15.34% (top quartile). 3Y return: 13.29% (bottom quartile). 3Y return: 13.59% (lower mid). Point 7 1Y return: 4.38% (top quartile). 1Y return: 2.20% (bottom quartile). 1Y return: 1.09% (bottom quartile). 1Y return: 3.81% (upper mid). 1Y return: 3.61% (lower mid). Point 8 Alpha: 2.41 (top quartile). Alpha: -0.76 (bottom quartile). Alpha: -1.69 (bottom quartile). Alpha: 1.13 (lower mid). Alpha: 1.95 (upper mid). Point 9 Sharpe: -0.21 (top quartile). Sharpe: -0.39 (bottom quartile). Sharpe: -0.44 (bottom quartile). Sharpe: -0.30 (lower mid). Sharpe: -0.25 (upper mid). Point 10 Information ratio: -0.72 (bottom quartile). Information ratio: 0.02 (upper mid). Information ratio: 0.46 (top quartile). Information ratio: -0.26 (bottom quartile). Information ratio: -0.01 (lower mid). Taurus Discovery (Midcap) Fund
Kotak Emerging Equity Scheme
Sundaram Mid Cap Fund
Aditya Birla Sun Life Midcap Fund
BNP Paribas Mid Cap Fund
सर्वोत्तम स्मॉल कॅप इक्विटी एसआयपी फंड
Fund NAV Net Assets (Cr) Min SIP Investment 3 MO (%) 6 MO (%) 1 YR (%) 3 YR (%) 5 YR (%) 2025 (%) Aditya Birla Sun Life Small Cap Fund Growth ₹100.109
↑ 1.00 ₹5,870 1,000 0.2 11.2 14.4 13.6 12.5 -3.7 SBI Small Cap Fund Growth ₹181.598
↑ 0.99 ₹39,203 500 -1.7 10.4 6 10.1 11.4 -4.9 DSP Small Cap Fund Growth ₹222.338
↑ 1.44 ₹20,252 500 -3.4 10.4 12.4 13.8 15.1 -2.8 Nippon India Small Cap Fund Growth ₹179.717
↑ 1.61 ₹76,903 100 -2.9 4.8 5.6 12.1 16.3 -4.7 Franklin India Smaller Companies Fund Growth ₹172.422
↑ 1.07 ₹13,305 500 -4.4 2.9 0.7 8.5 13.1 -8.4 Note: Returns up to 1 year are on absolute basis & more than 1 year are on CAGR basis. as on 19 Nov 26 Research Highlights & Commentary of 5 Funds showcased
Commentary Aditya Birla Sun Life Small Cap Fund SBI Small Cap Fund DSP Small Cap Fund Nippon India Small Cap Fund Franklin India Smaller Companies Fund Point 1 Bottom quartile AUM (₹5,870 Cr). Upper mid AUM (₹39,203 Cr). Lower mid AUM (₹20,252 Cr). Highest AUM (₹76,903 Cr). Bottom quartile AUM (₹13,305 Cr). Point 2 Established history (19+ yrs). Established history (17+ yrs). Established history (19+ yrs). Established history (16+ yrs). Oldest track record among peers (20 yrs). Point 3 Top rated. Rating: 5★ (upper mid). Rating: 4★ (lower mid). Rating: 4★ (bottom quartile). Rating: 4★ (bottom quartile). Point 4 Risk profile: Moderately High. Risk profile: Moderately High. Risk profile: Moderately High. Risk profile: Moderately High. Risk profile: Moderately High. Point 5 5Y return: 12.48% (bottom quartile). 5Y return: 11.37% (bottom quartile). 5Y return: 15.11% (upper mid). 5Y return: 16.30% (top quartile). 5Y return: 13.12% (lower mid). Point 6 3Y return: 13.57% (upper mid). 3Y return: 10.09% (bottom quartile). 3Y return: 13.81% (top quartile). 3Y return: 12.10% (lower mid). 3Y return: 8.49% (bottom quartile). Point 7 1Y return: 14.44% (top quartile). 1Y return: 6.04% (lower mid). 1Y return: 12.37% (upper mid). 1Y return: 5.61% (bottom quartile). 1Y return: 0.66% (bottom quartile). Point 8 Alpha: 0.00 (bottom quartile). Alpha: 1.33 (lower mid). Alpha: 12.68 (top quartile). Alpha: 1.60 (upper mid). Alpha: -3.35 (bottom quartile). Point 9 Sharpe: 0.15 (upper mid). Sharpe: -0.23 (bottom quartile). Sharpe: 0.24 (top quartile). Sharpe: -0.16 (lower mid). Sharpe: -0.38 (bottom quartile). Point 10 Information ratio: 0.00 (upper mid). Information ratio: -0.23 (bottom quartile). Information ratio: 0.57 (top quartile). Information ratio: -0.06 (lower mid). Information ratio: -0.63 (bottom quartile). Aditya Birla Sun Life Small Cap Fund
SBI Small Cap Fund
DSP Small Cap Fund
Nippon India Small Cap Fund
Franklin India Smaller Companies Fund
सर्वोत्तम मल्टी कॅप इक्विटी एसआयपी फंड
Fund NAV Net Assets (Cr) Min SIP Investment 3 MO (%) 6 MO (%) 1 YR (%) 3 YR (%) 5 YR (%) 2025 (%) Motilal Oswal Multicap 35 Fund Growth ₹64.2361
↑ 0.62 ₹13,228 500 2.3 15.9 1.9 16.1 12.6 -5.6 Kotak Standard Multicap Fund Growth ₹87.917
↑ 1.02 ₹52,615 500 2.6 6.4 0.4 12.2 10.5 9.5 Mirae Asset India Equity Fund Growth ₹117.967
↑ 1.29 ₹35,551 1,000 4.8 9.9 0.3 10.4 8 10.2 BNP Paribas Multi Cap Fund Growth ₹73.5154
↓ -0.01 ₹588 300 -4.6 -2.6 19.3 17.3 13.6 Aditya Birla Sun Life Equity Fund Growth ₹2,020.94
↑ 19.59 ₹28,398 100 2.7 10.7 7.4 15.5 11.6 11.2 Note: Returns up to 1 year are on absolute basis & more than 1 year are on CAGR basis. as on 19 Nov 26 Research Highlights & Commentary of 5 Funds showcased
Commentary Motilal Oswal Multicap 35 Fund Kotak Standard Multicap Fund Mirae Asset India Equity Fund BNP Paribas Multi Cap Fund Aditya Birla Sun Life Equity Fund Point 1 Bottom quartile AUM (₹13,228 Cr). Highest AUM (₹52,615 Cr). Upper mid AUM (₹35,551 Cr). Bottom quartile AUM (₹588 Cr). Lower mid AUM (₹28,398 Cr). Point 2 Established history (12+ yrs). Established history (17+ yrs). Established history (18+ yrs). Established history (21+ yrs). Oldest track record among peers (28 yrs). Point 3 Top rated. Rating: 5★ (upper mid). Rating: 5★ (lower mid). Rating: 4★ (bottom quartile). Rating: 4★ (bottom quartile). Point 4 Risk profile: Moderately High. Risk profile: Moderately High. Risk profile: Moderately High. Risk profile: Moderately High. Risk profile: Moderately High. Point 5 5Y return: 12.62% (upper mid). 5Y return: 10.51% (bottom quartile). 5Y return: 8.01% (bottom quartile). 5Y return: 13.57% (top quartile). 5Y return: 11.62% (lower mid). Point 6 3Y return: 16.13% (upper mid). 3Y return: 12.21% (bottom quartile). 3Y return: 10.40% (bottom quartile). 3Y return: 17.28% (top quartile). 3Y return: 15.54% (lower mid). Point 7 1Y return: 1.87% (lower mid). 1Y return: 0.39% (bottom quartile). 1Y return: 0.32% (bottom quartile). 1Y return: 19.34% (top quartile). 1Y return: 7.37% (upper mid). Point 8 Alpha: 2.38 (upper mid). Alpha: -1.42 (bottom quartile). Alpha: 0.46 (lower mid). Alpha: 0.00 (bottom quartile). Alpha: 7.25 (top quartile). Point 9 Sharpe: -0.41 (lower mid). Sharpe: -0.69 (bottom quartile). Sharpe: -0.71 (bottom quartile). Sharpe: 2.86 (top quartile). Sharpe: -0.19 (upper mid). Point 10 Information ratio: 0.60 (upper mid). Information ratio: 0.05 (lower mid). Information ratio: -0.51 (bottom quartile). Information ratio: 0.00 (bottom quartile). Information ratio: 1.83 (top quartile). Motilal Oswal Multicap 35 Fund
Kotak Standard Multicap Fund
Mirae Asset India Equity Fund
BNP Paribas Multi Cap Fund
Aditya Birla Sun Life Equity Fund
सर्वोत्तम क्षेत्रातील इक्विटी एसआयपी फंड
Fund NAV Net Assets (Cr) Min SIP Investment 3 MO (%) 6 MO (%) 1 YR (%) 3 YR (%) 5 YR (%) 2025 (%) DSP Natural Resources and New Energy Fund Growth ₹105.721
↓ -1.34 ₹2,457 500 -2.4 -4.3 9.2 16.9 14.8 17.5 Aditya Birla Sun Life Banking And Financial Services Fund Growth ₹65.41
↑ 0.52 ₹3,313 1,000 3.5 9.4 1.6 11.5 10.4 17.5 ICICI Prudential Banking and Financial Services Fund Growth ₹139.38
↑ 1.01 ₹10,709 100 7.4 10.5 -0.1 11.8 10 15.9 Bandhan Infrastructure Fund Growth ₹48.306
↑ 0.35 ₹1,328 100 -1.8 1.7 -2.4 12.7 14.4 -6.9 Franklin Build India Fund Growth ₹141.94
↑ 1.43 ₹2,946 500 -1.1 -1 -2.6 13.4 16.3 3.7 Note: Returns up to 1 year are on absolute basis & more than 1 year are on CAGR basis. as on 18 Nov 26 Research Highlights & Commentary of 5 Funds showcased
Commentary DSP Natural Resources and New Energy Fund Aditya Birla Sun Life Banking And Financial Services Fund ICICI Prudential Banking and Financial Services Fund Bandhan Infrastructure Fund Franklin Build India Fund Point 1 Bottom quartile AUM (₹2,457 Cr). Upper mid AUM (₹3,313 Cr). Highest AUM (₹10,709 Cr). Bottom quartile AUM (₹1,328 Cr). Lower mid AUM (₹2,946 Cr). Point 2 Oldest track record among peers (18 yrs). Established history (12+ yrs). Established history (18+ yrs). Established history (15+ yrs). Established history (17+ yrs). Point 3 Top rated. Rating: 5★ (upper mid). Rating: 5★ (lower mid). Rating: 5★ (bottom quartile). Rating: 5★ (bottom quartile). Point 4 Risk profile: High. Risk profile: High. Risk profile: High. Risk profile: High. Risk profile: High. Point 5 5Y return: 14.84% (upper mid). 5Y return: 10.36% (bottom quartile). 5Y return: 10.01% (bottom quartile). 5Y return: 14.36% (lower mid). 5Y return: 16.25% (top quartile). Point 6 3Y return: 16.92% (top quartile). 3Y return: 11.54% (bottom quartile). 3Y return: 11.84% (bottom quartile). 3Y return: 12.71% (lower mid). 3Y return: 13.45% (upper mid). Point 7 1Y return: 9.20% (top quartile). 1Y return: 1.63% (upper mid). 1Y return: -0.06% (lower mid). 1Y return: -2.38% (bottom quartile). 1Y return: -2.62% (bottom quartile). Point 8 Alpha: 0.00 (upper mid). Alpha: 1.05 (top quartile). Alpha: -2.17 (bottom quartile). Alpha: 0.00 (lower mid). Alpha: 0.00 (bottom quartile). Point 9 Sharpe: -0.01 (top quartile). Sharpe: -0.49 (upper mid). Sharpe: -0.66 (bottom quartile). Sharpe: -0.51 (lower mid). Sharpe: -0.74 (bottom quartile). Point 10 Information ratio: 0.00 (top quartile). Information ratio: -0.36 (bottom quartile). Information ratio: -0.36 (bottom quartile). Information ratio: 0.00 (upper mid). Information ratio: 0.00 (lower mid). DSP Natural Resources and New Energy Fund
Aditya Birla Sun Life Banking And Financial Services Fund
ICICI Prudential Banking and Financial Services Fund
Bandhan Infrastructure Fund
Franklin Build India Fund
सर्वोत्तम ELSS SIP फंड
Fund NAV Net Assets (Cr) Min SIP Investment 3 MO (%) 6 MO (%) 1 YR (%) 3 YR (%) 5 YR (%) 2025 (%) Bandhan Tax Advantage (ELSS) Fund Growth ₹162.068
↑ 1.81 ₹6,582 500 4.3 8.7 2.8 10.5 10.7 8 Tata India Tax Savings Fund Growth ₹47.3719
↑ 0.45 ₹4,302 500 -0.8 6.1 2.3 12.1 10.7 4.9 Aditya Birla Sun Life Tax Relief '96 Growth ₹63.58
↑ 0.71 ₹13,367 500 2.3 7.3 1.5 12 8.1 9.3 DSP Tax Saver Fund Growth ₹145.991
↑ 1.71 ₹15,587 500 5.1 8.7 1.2 14.2 12.2 7.5 HDFC Long Term Advantage Fund Growth ₹595.168
↑ 0.28 ₹1,318 500 1.2 15.4 35.5 20.6 17.4 Note: Returns up to 1 year are on absolute basis & more than 1 year are on CAGR basis. as on 19 Nov 26 Research Highlights & Commentary of 5 Funds showcased
Commentary Bandhan Tax Advantage (ELSS) Fund Tata India Tax Savings Fund Aditya Birla Sun Life Tax Relief '96 DSP Tax Saver Fund HDFC Long Term Advantage Fund Point 1 Lower mid AUM (₹6,582 Cr). Bottom quartile AUM (₹4,302 Cr). Upper mid AUM (₹13,367 Cr). Highest AUM (₹15,587 Cr). Bottom quartile AUM (₹1,318 Cr). Point 2 Established history (17+ yrs). Established history (12+ yrs). Established history (18+ yrs). Established history (19+ yrs). Oldest track record among peers (25 yrs). Point 3 Top rated. Rating: 5★ (upper mid). Rating: 4★ (lower mid). Rating: 4★ (bottom quartile). Rating: 3★ (bottom quartile). Point 4 Risk profile: Moderately High. Risk profile: Moderately High. Risk profile: Moderately High. Risk profile: Moderately High. Risk profile: Moderately High. Point 5 5Y return: 10.66% (bottom quartile). 5Y return: 10.69% (lower mid). 5Y return: 8.12% (bottom quartile). 5Y return: 12.16% (upper mid). 5Y return: 17.39% (top quartile). Point 6 3Y return: 10.49% (bottom quartile). 3Y return: 12.13% (lower mid). 3Y return: 11.97% (bottom quartile). 3Y return: 14.22% (upper mid). 3Y return: 20.64% (top quartile). Point 7 1Y return: 2.77% (upper mid). 1Y return: 2.34% (lower mid). 1Y return: 1.50% (bottom quartile). 1Y return: 1.24% (bottom quartile). 1Y return: 35.51% (top quartile). Point 8 Alpha: 1.38 (lower mid). Alpha: 3.69 (top quartile). Alpha: -1.27 (bottom quartile). Alpha: -0.49 (bottom quartile). Alpha: 1.75 (upper mid). Point 9 Sharpe: -0.56 (lower mid). Sharpe: -0.41 (upper mid). Sharpe: -0.69 (bottom quartile). Sharpe: -0.63 (bottom quartile). Sharpe: 2.27 (top quartile). Point 10 Information ratio: -0.48 (bottom quartile). Information ratio: 0.07 (upper mid). Information ratio: -0.10 (lower mid). Information ratio: 0.48 (top quartile). Information ratio: -0.15 (bottom quartile). Bandhan Tax Advantage (ELSS) Fund
Tata India Tax Savings Fund
Aditya Birla Sun Life Tax Relief '96
DSP Tax Saver Fund
HDFC Long Term Advantage Fund
बेस्ट व्हॅल्यू इक्विटी एसआयपी फंड
Fund NAV Net Assets (Cr) Min SIP Investment 3 MO (%) 6 MO (%) 1 YR (%) 3 YR (%) 5 YR (%) 2025 (%) Tata Equity PE Fund Growth ₹362.112
↑ 2.57 ₹8,009 150 3.2 6.8 0 12 12.4 3.7 JM Value Fund Growth ₹95.1582
↑ 0.25 ₹724 500 -2 5.7 -2.7 8.9 12.5 -4.4 Aditya Birla Sun Life Pure Value Fund Growth ₹137.383
↑ 1.41 ₹6,361 1,000 -0.1 5.8 6.8 12.2 13.3 2.6 HDFC Capital Builder Value Fund Growth ₹816.702
↑ 8.12 ₹8,038 300 2.7 11.1 5.6 15.6 13 8.6 Bandhan Sterling Value Fund Growth ₹153.732
↑ 1.71 ₹9,471 100 4.2 7.4 1.1 10.9 12 5 Note: Returns up to 1 year are on absolute basis & more than 1 year are on CAGR basis. as on 19 Nov 26 Research Highlights & Commentary of 5 Funds showcased
Commentary Tata Equity PE Fund JM Value Fund Aditya Birla Sun Life Pure Value Fund HDFC Capital Builder Value Fund Bandhan Sterling Value Fund Point 1 Lower mid AUM (₹8,009 Cr). Bottom quartile AUM (₹724 Cr). Bottom quartile AUM (₹6,361 Cr). Upper mid AUM (₹8,038 Cr). Highest AUM (₹9,471 Cr). Point 2 Established history (22+ yrs). Established history (29+ yrs). Established history (18+ yrs). Oldest track record among peers (32 yrs). Established history (18+ yrs). Point 3 Top rated. Rating: 4★ (upper mid). Rating: 3★ (lower mid). Rating: 3★ (bottom quartile). Rating: 3★ (bottom quartile). Point 4 Risk profile: Moderately High. Risk profile: High. Risk profile: Moderately High. Risk profile: Moderately High. Risk profile: Moderately High. Point 5 5Y return: 12.41% (bottom quartile). 5Y return: 12.46% (lower mid). 5Y return: 13.26% (top quartile). 5Y return: 13.00% (upper mid). 5Y return: 11.99% (bottom quartile). Point 6 3Y return: 11.96% (lower mid). 3Y return: 8.88% (bottom quartile). 3Y return: 12.23% (upper mid). 3Y return: 15.58% (top quartile). 3Y return: 10.93% (bottom quartile). Point 7 1Y return: 0.04% (bottom quartile). 1Y return: -2.68% (bottom quartile). 1Y return: 6.81% (top quartile). 1Y return: 5.59% (upper mid). 1Y return: 1.08% (lower mid). Point 8 Alpha: -2.59 (bottom quartile). Alpha: 0.02 (lower mid). Alpha: 7.67 (top quartile). Alpha: 5.15 (upper mid). Alpha: -0.21 (bottom quartile). Point 9 Sharpe: -0.77 (bottom quartile). Sharpe: -0.59 (lower mid). Sharpe: -0.18 (top quartile). Sharpe: -0.32 (upper mid). Sharpe: -0.65 (bottom quartile). Point 10 Information ratio: 0.05 (lower mid). Information ratio: -0.18 (bottom quartile). Information ratio: 0.20 (upper mid). Information ratio: 1.52 (top quartile). Information ratio: -0.21 (bottom quartile). Tata Equity PE Fund
JM Value Fund
Aditya Birla Sun Life Pure Value Fund
HDFC Capital Builder Value Fund
Bandhan Sterling Value Fund
सर्वोत्तम केंद्रित इक्विटी एसआयपी फंड
Fund NAV Net Assets (Cr) Min SIP Investment 3 MO (%) 6 MO (%) 1 YR (%) 3 YR (%) 5 YR (%) 2025 (%) Axis Focused 25 Fund Growth ₹57.62
↑ 0.58 ₹10,446 500 1.6 13.5 2.9 10.2 3.7 2.5 Aditya Birla Sun Life Focused Equity Fund Growth ₹154.893
↑ 0.93 ₹7,657 1,000 4.5 10.6 4.8 14.1 10.5 10.1 Motilal Oswal Focused 25 Fund Growth ₹55.493
↑ 0.39 ₹1,848 500 4.7 23.6 24.8 13.6 10.3 -1.7 Sundaram Select Focus Fund Growth ₹264.968
↓ -1.18 ₹1,354 100 -5 8.5 24.5 17 17.3 HDFC Focused 30 Fund Growth ₹248.738
↑ 3.34 ₹26,956 300 6.1 13.2 3.5 16.3 16.8 10.9 Note: Returns up to 1 year are on absolute basis & more than 1 year are on CAGR basis. as on 19 Nov 26 Research Highlights & Commentary of 5 Funds showcased
Commentary Axis Focused 25 Fund Aditya Birla Sun Life Focused Equity Fund Motilal Oswal Focused 25 Fund Sundaram Select Focus Fund HDFC Focused 30 Fund Point 1 Upper mid AUM (₹10,446 Cr). Lower mid AUM (₹7,657 Cr). Bottom quartile AUM (₹1,848 Cr). Bottom quartile AUM (₹1,354 Cr). Highest AUM (₹26,956 Cr). Point 2 Established history (14+ yrs). Established history (21+ yrs). Established history (13+ yrs). Oldest track record among peers (24 yrs). Established history (22+ yrs). Point 3 Top rated. Rating: 4★ (upper mid). Rating: 3★ (lower mid). Rating: 3★ (bottom quartile). Rating: 3★ (bottom quartile). Point 4 Risk profile: Moderately High. Risk profile: Moderately High. Risk profile: Moderately High. Risk profile: Moderately High. Risk profile: Moderately High. Point 5 5Y return: 3.68% (bottom quartile). 5Y return: 10.48% (lower mid). 5Y return: 10.31% (bottom quartile). 5Y return: 17.29% (top quartile). 5Y return: 16.77% (upper mid). Point 6 3Y return: 10.20% (bottom quartile). 3Y return: 14.10% (lower mid). 3Y return: 13.56% (bottom quartile). 3Y return: 17.03% (top quartile). 3Y return: 16.27% (upper mid). Point 7 1Y return: 2.91% (bottom quartile). 1Y return: 4.83% (lower mid). 1Y return: 24.79% (top quartile). 1Y return: 24.49% (upper mid). 1Y return: 3.52% (bottom quartile). Point 8 Alpha: 2.18 (lower mid). Alpha: 3.22 (upper mid). Alpha: 23.66 (top quartile). Alpha: -5.62 (bottom quartile). Alpha: 0.56 (bottom quartile). Point 9 Sharpe: -0.47 (bottom quartile). Sharpe: -0.40 (lower mid). Sharpe: 0.68 (upper mid). Sharpe: 1.85 (top quartile). Sharpe: -0.55 (bottom quartile). Point 10 Information ratio: -0.21 (bottom quartile). Information ratio: 0.57 (upper mid). Information ratio: 0.26 (lower mid). Information ratio: -0.52 (bottom quartile). Information ratio: 0.76 (top quartile). Axis Focused 25 Fund
Aditya Birla Sun Life Focused Equity Fund
Motilal Oswal Focused 25 Fund
Sundaram Select Focus Fund
HDFC Focused 30 Fund
इक्विटी फंडांवर कर आकारणी
अर्थसंकल्प 2018 च्या भाषणानुसार, एक नवीन दीर्घकालीनभांडवल इक्विटी ओरिएंटेड वर लाभ (LTCG) करम्युच्युअल फंड आणि साठा १ एप्रिलपासून लागू होईल. वित्त विधेयक 2018 हे 14 मार्च 2018 रोजी लोकसभेत आवाजी मतदानाने मंजूर करण्यात आले. हे कसे नवीन आहेआयकर 1 एप्रिल 2018 पासून इक्विटी गुंतवणुकीवर बदलांचा परिणाम होईल. *
1. दीर्घकालीन भांडवली नफा
INR 1 लाख पेक्षा जास्त LTCGs उद्भवतातविमोचन 1 एप्रिल 2018 रोजी किंवा नंतर म्युच्युअल फंड युनिट्स किंवा इक्विटींवर 10 टक्के (अधिक उपकर) किंवा 10.4 टक्के कर आकारला जाईल. दीर्घकालीनभांडवली नफा INR 1 लाख पर्यंत सूट दिली जाईल. उदाहरणार्थ, तुम्ही एका आर्थिक वर्षात स्टॉक किंवा म्युच्युअल फंड गुंतवणुकीतून एकत्रित दीर्घकालीन भांडवली नफ्यात INR 3 लाख कमावल्यास. करपात्र LTCG INR 2 लाख (INR 3 लाख - 1 लाख) असतील आणिकर दायित्व 20 रुपये असेल,000 (INR 2 लाख पैकी 10 टक्के).
दीर्घकालीन भांडवली नफा म्हणजे विक्री किंवा पूर्तता केल्यामुळे होणारा नफाइक्विटी फंड एक वर्षापेक्षा जास्त आयोजित.
2. शॉर्ट टर्म कॅपिटल गेन
म्युच्युअल फंड युनिट्स होल्डिंगच्या एक वर्षापूर्वी विकल्यास, शॉर्ट टर्म कॅपिटल गेन (STCGs) कर लागू होईल. STCGs कर 15 टक्के वर अपरिवर्तित ठेवण्यात आला आहे.
| इक्विटी योजना | होल्डिंग कालावधी | कर दर |
|---|---|---|
| दीर्घकालीन भांडवली नफा (LTCG) | 1 वर्षापेक्षा जास्त | 10% (कोणत्याही इंडेक्सेशनशिवाय) **** |
| शॉर्ट टर्म कॅपिटल गेन (STCG) | एका वर्षापेक्षा कमी किंवा त्यापेक्षा कमी | १५% |
| वितरित लाभांशावर कर | - | 10%# |
* INR 1 लाख पर्यंतचे नफा करमुक्त आहेत. INR 1 लाखापेक्षा जास्त नफ्यावर 10% कर लागू होतो. पूर्वीचा दर 31 जानेवारी 2018 रोजी क्लोजिंग किंमत म्हणून 0% किंमत मोजला होता. #10% लाभांश कर + अधिभार 12% + उपकर 4% = 11.648% 4% आरोग्य आणि शिक्षण उपकर सुरू केला. पूर्वी शिक्षण उपकर 3 होता%
SIP गुंतवणुकीचे फायदे
काही महत्वाचेपद्धतशीर गुंतवणूक योजनांचे फायदे आहेत:
रुपया खर्च सरासरी
एसआयपी ऑफरचा सर्वात मोठा फायदा म्हणजे रुपयाची किंमत सरासरी, जी एखाद्या व्यक्तीला मालमत्ता खरेदीची किंमत काढण्यास मदत करते. म्युच्युअल फंडात एकरकमी गुंतवणूक करताना काही युनिट्सची खरेदी केली जातेगुंतवणूकदार सर्व एकाच वेळी, एसआयपीच्या बाबतीत युनिट्सची खरेदी दीर्घ कालावधीसाठी केली जाते आणि ती मासिक अंतराने (सामान्यतः) समान प्रमाणात पसरविली जाते. कालांतराने गुंतवणुकीचा प्रसार होत असल्यामुळे, गुंतवणूकदाराला सरासरी खर्चाचा फायदा देऊन वेगवेगळ्या किंमतींवर शेअर बाजारात गुंतवणूक केली जाते, त्यामुळे रुपयाची सरासरी किंमत ही संज्ञा आहे.
कंपाउंडिंगची शक्ती
SIP चा लाभ देतातकंपाउंडिंगची शक्ती. जेव्हा तुम्ही फक्त मुद्दलावर व्याज मिळवता तेव्हा साधे व्याज असते. चक्रवाढ व्याजाच्या बाबतीत, व्याजाची रक्कम मुद्दलामध्ये जोडली जाते आणि व्याज नवीन मुद्दल (जुने मुद्दल अधिक नफा) वर मोजले जाते. ही प्रक्रिया प्रत्येक वेळी चालू राहते. SIP मधील म्युच्युअल फंड हप्त्यांमध्ये असल्याने, ते चक्रवाढ केले जातात, ज्यामुळे सुरुवातीला गुंतवलेल्या रकमेत अधिक भर पडते.
परवडणारी
SIP खूप परवडणारे आहेत. SIP मधील मासिक किमान गुंतवणूक रक्कम INR 500 इतकी कमी असू शकते. काही फंड हाऊसेस, अगदी "MicroSIP" नावाचे काहीतरी ऑफर करतात जेथे तिकीट आकार INR 100 इतका कमी असतो. यामुळे तरुणांना त्यांचे दीर्घकाळ सुरू करण्यासाठी एक चांगला पर्याय मिळतो. - आयुष्याच्या सुरुवातीच्या टप्प्यावर मुदतीची गुंतवणूक.
एसआयपी कॅल्क्युलेटर
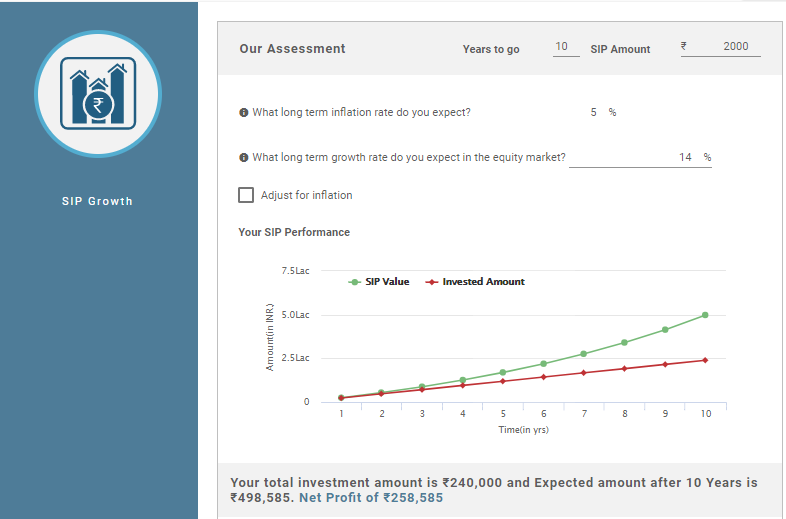
एसआयपी कॅल्क्युलेटर हे तुमच्या गुंतवणुकीसाठी सर्वात उपयुक्त साधन असू शकते. जोपर्यंत तुम्ही गुंतवणूक करू इच्छिता तोपर्यंत तुमच्या SIP गुंतवणुकीच्या वाढीचा अंदाज आहे. तर, अगदी आधीगुंतवणूक फंडामध्ये, कोणीही त्यांची एकूण SIP पूर्वनिश्चित करू शकतोकमाई SIP कॅल्क्युलेटर द्वारे. कॅल्क्युलेटर सामान्यत: गुंतवणूक करू इच्छित असलेल्या SIP गुंतवणुकीची रक्कम, गुंतवणुकीचा कालावधी, अपेक्षित असे इनपुट घेतात.महागाई दर (याचा हिशेब असणे आवश्यक आहे). याचे उदाहरण खाली दिले आहे.
समजा, तुम्ही 10 वर्षांसाठी 5,000 रुपये गुंतवल्यास, तुमची SIP गुंतवणूक कशी वाढते ते पहा-
मासिक गुंतवणूक: INR 5,000
गुंतवणुकीचा कालावधी: 10 वर्षे
एकूण गुंतवणूक केलेली रक्कम: INR 6,00,000
दीर्घकालीन वाढीचा दर (अंदाजे): 14%
एसआयपी कॅल्क्युलेटरनुसार अपेक्षित परतावा: INR 12,46,462
निव्वळ नफा: INR 6,46,462
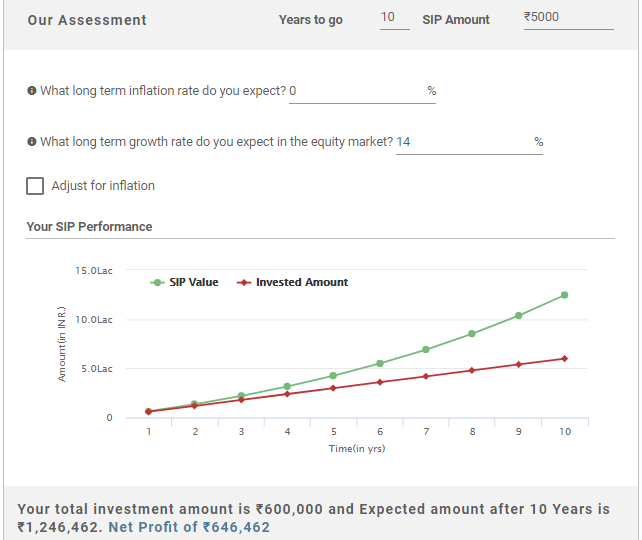
वरील गणने दर्शविते की जर तुम्ही 10 वर्षांसाठी मासिक 5,000 रुपये (एकूण 6,00,000 रुपये) गुंतवले तर तुम्हाला कमाई होईलINR 12,46,462 याचा अर्थ तुम्ही कमावलेला निव्वळ नफा आहेINR ६,४६,४६२. छान आहे ना!
येथे प्रदान केलेली माहिती अचूक असल्याची खात्री करण्यासाठी सर्व प्रयत्न केले गेले आहेत. तथापि, डेटाच्या अचूकतेबद्दल कोणतीही हमी दिली जात नाही. कृपया कोणतीही गुंतवणूक करण्यापूर्वी योजना माहिती दस्तऐवजासह सत्यापित करा.






AMFI Registration No. 112358 | CIN: U74999MH2016PTC282153
Shepard Technologies Pvt. Ltd. (with ARN code 112358) makes no warranties or representations, express or implied, on products offered through the platform. It accepts no liability for any damages or losses, however caused, in connection with the use of, or on the reliance of its product or related services. Terms and conditions of the website are applicable.
©2026 Shepard Technologies Private Limited. All Rights Reserved