मनी मार्केट म्युच्युअल फंड
मनी मार्केट फंड म्हणजे काय?
एक पैसाबाजार फंड (एमएमएफ) हा निश्चित प्रकार आहेउत्पन्न म्युच्युअल फंड जो डेट सिक्युरिटीजमध्ये गुंतवणूक करतो. पण, मनी मार्केट फंड्सपासून सुरुवात करण्यापूर्वी, हे समजून घेणे महत्त्वाचे आहे की निश्चित उत्पन्न साधन म्हणजे काय? बरं, नाव दर्शविल्याप्रमाणे, एक निश्चित उत्पन्न साधन हे असे काहीतरी आहे जे विशिष्ट कालावधीत विशिष्ट प्रमाणात उत्पन्न निर्माण करते. दगुंतवणूकदार जारीकर्त्याकडे असलेल्या मालमत्तेवर निश्चित दावा केला जातो, निश्चित उत्पन्न साधने कमी-जोखीम आणि कमी-उत्पन्न गुंतवणूक मानली जातात.
मूलत:, निश्चित उत्पन्न साधने काहीही नसतात, परंतु निधी उधार घेण्याचा एक मार्ग असतो (जेथे कर्ज जारीकर्त्याद्वारे केले जाते).
स्थिर उत्पन्न वि स्टॉक्स
सुरुवातीच्यासाठी निश्चित उत्पन्न धारकास आर्थिक अधिकार देते, ज्यामध्ये व्याज देयके प्राप्त करण्याचा अधिकार आणि सर्व किंवा काही भाग परत करणे समाविष्ट आहे.भांडवल दिलेल्या तारखेला गुंतवणूक केली. याउलट, दभागधारक (स्टॉक मालक) जारीकर्त्याकडून लाभांश प्राप्त करतो, परंतु कंपनी लाभांश देण्यास कोणत्याही कायद्याने बांधील नाही. तसेच, आणखी एक महत्त्वाचा फरक असा आहे की निश्चित उत्पन्न धारक हा सिक्युरिटी जारी करणार्या कंपनीचा कर्जदार असतो, तर भागधारक हा भागीदार असतो, भांडवली स्टॉकचा काही भाग मालक असतो. येथे हे समजून घेणे महत्त्वाचे आहे की जर कंपनी बस्ट झाली, तर कर्जदारांना (बॉन्डधारक) भागधारक (इक्विटी धारक) पेक्षा प्राधान्य दिले जाते.
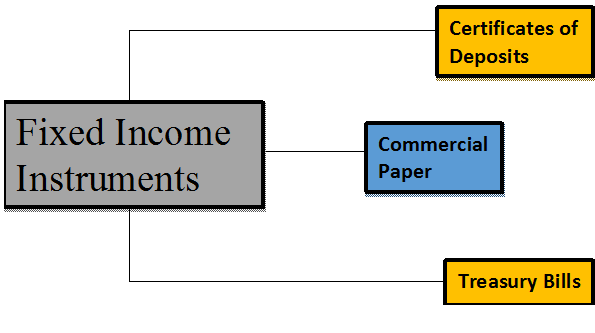
निश्चित उत्पन्न साधनांचे प्रकार
मनी मार्केट इन्स्ट्रुमेंट अंतर्गत येणारी वेगवेगळी निश्चित उत्पन्न साधने आहेत, त्यापैकी काहींची नावे द्या:
ठेवींचे प्रमाणपत्र (सीडी)
मुदत ठेवी सारख्या वेळेच्या ठेवी सामान्यतः बँका (शेड्युल्ड कमर्शियल बँका) आणि अखिल भारतीय वित्तीय संस्थांद्वारे ग्राहकांना ऑफर केल्या जातात. यामधील फरक आणि मुदत ठेव अबँक म्हणजे सीडी काढता येत नाही.
कमर्शियल पेपर (CPs)
व्यावसायिक कागदपत्रे सहसा प्रॉमिसरी नोट्स म्हणून ओळखली जातात जी असुरक्षित असतात आणि सामान्यत: कंपन्या आणि वित्तीय संस्थांद्वारे त्यांच्याकडून सवलतीच्या दराने जारी केल्या जातात.दर्शनी मूल्य. व्यावसायिक कागदपत्रांसाठी निश्चित परिपक्वता 1 ते 270 दिवस आहे. ज्या उद्देशांसाठी ते जारी केले जातात ते आहेत - इन्व्हेंटरी फायनान्सिंग, खातीप्राप्य, आणि अल्प-मुदतीच्या दायित्वांची किंवा कर्जांची पुर्तता करणे.
Talk to our investment specialist
ट्रेझरी बिले (टी-बिले)
ट्रेझरी बिले प्रथम भारत सरकारने 1917 मध्ये जारी केली होती. ट्रेझरी बिले ही अल्प-मुदतीची आर्थिक साधने आहेत जी देशाच्या सेंट्रल बँकेद्वारे जारी केली जातात. हे सर्वात सुरक्षित मनी मार्केट साधनांपैकी एक आहे कारण ते बाजारातील जोखमींपासून मुक्त आहे (जोखीम सार्वभौम आहे किंवा या प्रकरणात भारत सरकार आहे), जरी गुंतवणुकीवरील परतावा इतका मोठा नाही. ट्रेझरी बिले प्राथमिक तसेच दुय्यम बाजाराद्वारे प्रसारित केली जातात. ट्रेझरी बिलांसाठी परिपक्वता कालावधी अनुक्रमे 3-महिने, 6-महिने आणि 1-वर्ष आहेत.
इतर अनेक निश्चित उत्पन्न साधने आहेत जसे की पुनर्खरेदी करार (रेपो), मालमत्ता-बॅक्ड सिक्युरिटीज इत्यादी, जी भारतीय निश्चित उत्पन्न बाजारात देखील अस्तित्वात आहेत, परंतु वरील अधिक सामान्य आहेत.
मनी मार्केट म्युच्युअल फंडात गुंतवणूक का करावी?
- मनी मार्केटमधील रोखे तुलनेने कमी धोका असतात.
- मनी मार्केट फंड हे सर्व म्युच्युअल फंड गुंतवणुकीसाठी सुरक्षित आणि सुरक्षित मानले जातात.
- मनी मार्केट फंड लक्षात घेता, मनी मार्केट खात्यात गुंतवणूक करणे सोपे आहे.गुंतवणूक माध्यमातूनम्युच्युअल फंड गुंतवणूकदार त्यांच्या सोयीनुसार खाते उघडू शकतात, ठेवी आणि पैसे काढू शकतात.
- मनी मार्केट फंड हा सर्व म्युच्युअल फंड गुंतवणुकीतील सर्वात कमी अस्थिर प्रकारांपैकी एक मानला जातो.
- मनी मार्केट फंडांची कामगिरी रिझर्व्ह बँक ऑफ इंडियाने ठरवलेल्या व्याजदरांशी जवळून जोडलेली आहे,सेंट्रल बँक ऑफ इंडिया. म्हणून, जेव्हा RBI बाजारात दर वाढवते, तेव्हा उत्पन्न वाढते आणि मनी मार्केट फंड चांगला परतावा देण्यास सक्षम असतात.
मनी मार्केट इन्स्ट्रुमेंट्स आणि बाँड्स: फरक
बंध एक वर्षापेक्षा जास्त कालावधीचा मॅच्युरिटी कालावधी असतो जो इतर डेट सिक्युरिटीज जसे की कमर्शियल पेपर्स, ट्रेझरी बिले आणि इतर मनी मार्केट इन्स्ट्रुमेंट्सपासून वेगळे करतो ज्यांचा मॅच्युरिटी कालावधी सामान्यत: एक वर्षापेक्षा कमी असतो.
मनी मार्केट म्हणजे काय?
मनी मार्केट सामान्यत: वित्तीय बाजाराच्या एका विभागाचा संदर्भ देते जेथे लहान परिपक्वता (एक वर्षापेक्षा कमी) आणि उच्च आर्थिक साधनेतरलता व्यवहार केले जातात. भारतात खूप सक्रिय मुद्रा बाजार आहे, जिथे अनेक साधनांचा व्यापार केला जातो. येथे तुमच्याकडे म्युच्युअल फंड कंपन्या, सरकारी बँका आणि इतर मोठ्या देशांतर्गत संस्था सहभागी आहेत. कमर्शिअल पेपर्स आणि ट्रेझरी बिले यासारख्या अल्प-मुदतीच्या सिक्युरिटीजच्या खरेदी-विक्रीसाठी मनी मार्केट हा आर्थिक बाजाराचा एक घटक बनला आहे.
मनी मार्केट रेट
मनी मार्केट रेट हे अल्प-मुदतीच्या मनी मार्केट साधनांद्वारे ऑफर केलेले व्याज दर आहेत. या उपकरणांची परिपक्वता 1 दिवस ते एक वर्षांपर्यंत असते. ट्रेझरी बिले यांसारख्या अनेक जटिल साधनांवर मनी मार्केटचे दर बदलतात.कॉल करा पैसा,वाणिज्यिक दस्तावेज (CP), ठेवींचे प्रमाणपत्र (CDs), रेपो, इ. रिझर्व्ह बँक ऑफ इंडिया (RBI) ही मुख्यत्वे मनी मार्केटवर प्रशासकीय अधिकार आहे.
RBI च्या साईटवर 28 फेब्रुवारी 2017 पर्यंत दिलेल्या विविध साधनांच्या मनी मार्केट रेटचे उदाहरण संदर्भासाठी खाली दिले आहे.
| आवाज (एक पाय) | भारित सरासरी दर | श्रेणी | |
|---|---|---|---|
| A. रात्रभर विभाग (I+II+III+IV) | ४,००,६५९.३६ | ३.२५ | ०.०१-५.३० |
| I. कॉल मनी | १२,६७१.७० | ३.२३ | 1.90-3.50 |
| II. त्रिपक्षीय रेपो | २,७९,३४९.७० | ३.२६ | 2.00-3.45 |
| III. मार्केट रेपो | १,०७,५८२.९६ | ३.२५ | ०.०१-३.५० |
| IV. कॉर्पोरेट बाँडमध्ये रेपो | 1,055.00 | ३.५६ | ३.४०-५.३० |
| B. टर्म सेगमेंट | |||
| I. नोटिस मनी** | ४५.०० | २.९७ | २.६५-३.५० |
| II. टर्म मनी@@ | 311.00 | - | ३.१५-३.४५ |
| III. त्रिपक्षीय रेपो | १,४९३.०० | ३.३० | ३.३०-३.३५ |
| IV. मार्केट रेपो | ५,९६९.१० | ३.३७ | ०.०१-३.६० |
| कॉर्पोरेट बाँडमध्ये व्ही. रेपो | ०.०० | - | - |
स्रोत: मनी मार्केट ऑपरेशन्स, RBI तारीख- तारीख: 30 मार्च 2021
म्युच्युअल फंड कंपन्या मनी मार्केट फंड ऑफर करतात
जसे आपण वर विविध प्रकारच्या साधनांबद्दल शिकलो आहोत, गुंतवणूकदार मनी मार्केट फंडामध्ये कशी गुंतवणूक करू शकतो हे जाणून घेणे तितकेच महत्त्वाचे आहे. 44 आहेतAMCs (अॅसेट मॅनेजमेंट कंपन्या), भारतातील बहुतेकअर्पण मनी मार्केट फंड (प्रामुख्यानेलिक्विड फंड आणि गुंतवणूकदारांसाठी अल्ट्रा-शॉर्ट फंड). गुंतवणूकदार बँका आणि ब्रोकर्स सारख्या वितरकांद्वारे देखील गुंतवणूक करू शकतात. मनी मार्केट फंडांमध्ये गुंतवणूक करण्यासाठी संबंधित प्रक्रिया आणि संबंधित अनुप्रयोगांचे पालन करणे आवश्यक आहे. डेट म्युच्युअल फंडाच्या अटी आणि शर्ती भिन्न असू शकतात, म्हणून, संपूर्ण ज्ञान मिळवणे आणि नंतर आपल्या गरजा पूर्ण करणारा एक निवडणे महत्वाचे आहे. शिवाय, कोणत्याही मनी मार्केट म्युच्युअल फंडामध्ये गुंतवणूक करण्यापूर्वी त्याची गुंतवणूक उद्दिष्टे, जोखीम, परतावा आणि खर्च यांचा काळजीपूर्वक विचार करा.
विचारात घेण्यासारखे घटक
भारतातील मनी मार्केट फंडांमध्ये गुंतवणूक करण्यापूर्वी तुम्ही विचारात घेतलेल्या काही महत्त्वाच्या बाबी येथे आहेत:
a जोखीम आणि परतावा
मनी मार्केट फंड आहेतकर्ज निधी आणि त्यामुळे व्याजदर जोखीम आणि क्रेडिट जोखीम यासारख्या डेट फंडांना लागू होणारे सर्व धोके वाहून घ्या. याव्यतिरिक्त, निधी व्यवस्थापक परतावा वाढवण्यासाठी किंचित जास्त जोखीम घटक असलेल्या साधनांमध्ये गुंतवणूक करू शकतो. सामान्यतः, मनी मार्केट फंड नियमित पेक्षा चांगले परतावा देतातबचत खाते. निव्वळ मालमत्ता मूल्य किंवानाही यातील निधी व्याजदराच्या बदलासह बदलतात.
b खर्चाचे प्रमाण
परतावा फारसा जास्त नसल्यामुळे, खर्चाचे प्रमाण तुमचे निर्धारण करण्यात महत्त्वाची भूमिका बजावतेकमाई मनी मार्केट फंडातून. खर्चाचे प्रमाण हे फंडाच्या एकूण मालमत्तेची एक लहान टक्केवारी आहे जी फंड हाऊसद्वारे फंड व्यवस्थापन सेवांसाठी आकारली जाते.
आदर्शपणे, तुमचा परतावा वाढवण्यासाठी तुम्ही कमी खर्चाचे प्रमाण असलेले फंड शोधले पाहिजेत.
c तुमच्या गुंतवणूक योजनेनुसार गुंतवणूक करा
सहसा, 90-365 दिवसांच्या गुंतवणुकीच्या क्षितिजासह गुंतवणूकदारांना मनी मार्केट फंडाची शिफारस केली जाते. या योजना तुम्हाला तुमच्या पोर्टफोलिओमध्ये वैविध्य आणण्यास मदत करू शकतात आणि तरलता राखून अतिरिक्त रोख गुंतवणूक करण्यात मदत करू शकतात. तुम्ही तुमच्यानुसार गुंतवणूक करत असल्याची खात्री करागुंतवणूक योजना.
d कर आकारणी
मनी मार्केट फंडांच्या बाबतीत, कर आकारणीचे नियम खालीलप्रमाणे आहेत:
कॅपिटल गेन टॅक्स
जर तुम्ही योजनेचे युनिट्स तीन वर्षांपर्यंतच्या कालावधीसाठी धारण केले तरभांडवली नफा तुम्ही मिळवलेल्या कमाईला अल्पकालीन भांडवली नफा किंवा STCG म्हणतात. STCG जोडले आहे तुमच्याकरपात्र उत्पन्न आणि लागू नुसार करआयकर स्लॅब
जर तुम्ही योजनेची युनिट्स तीन वर्षांहून अधिक काळ धरून ठेवलीत, तर तुम्ही मिळवलेल्या भांडवली नफ्याला दीर्घकालीन भांडवली नफा किंवा LTCG म्हणतात. त्यावर इंडेक्सेशन लाभांसह 20% कर आकारला जातो.
आर्थिक वर्ष 22 - 23 मध्ये गुंतवणूक करण्यासाठी सर्वोत्तम मनी मार्केट फंड
भारतातील काही सर्वोत्तम मनी मार्केट फंड खालीलप्रमाणे आहेत-Fund NAV Net Assets (Cr) 3 MO (%) 6 MO (%) 1 YR (%) 3 YR (%) 2025 (%) Debt Yield (YTM) Mod. Duration Eff. Maturity UTI Money Market Fund Growth ₹3,290.98
↑ 0.54 ₹18,611 1.6 3.2 6.2 7.3 7.5 7.58% 6M 20D 6M 20D Aditya Birla Sun Life Money Manager Fund Growth ₹394.729
↑ 0.07 ₹27,550 1.6 3.3 6.2 7.3 7.4 7.94% 7M 28D 8M 1D Tata Money Market Fund Growth ₹5,037.87
↑ 0.79 ₹33,030 1.6 3.3 6.2 7.3 7.4 7.79% 7M 1D 7M 1D Kotak Money Market Scheme Growth ₹4,790.6
↑ 0.65 ₹31,606 1.6 3.2 6.2 7.3 7.4 7.71% 7M 6D 7M 6D Bandhan Money Manager Fund Growth ₹42.99
↑ 0.01 ₹14,977 1.6 3.2 6.1 6.9 7.3 7.75% 7M 21D 7M 21D Note: Returns up to 1 year are on absolute basis & more than 1 year are on CAGR basis. as on 10 Jul 26 Research Highlights & Commentary of 5 Funds showcased
Commentary UTI Money Market Fund Aditya Birla Sun Life Money Manager Fund Tata Money Market Fund Kotak Money Market Scheme Bandhan Money Manager Fund Point 1 Bottom quartile AUM (₹18,611 Cr). Lower mid AUM (₹27,550 Cr). Highest AUM (₹33,030 Cr). Upper mid AUM (₹31,606 Cr). Bottom quartile AUM (₹14,977 Cr). Point 2 Established history (17+ yrs). Established history (20+ yrs). Oldest track record among peers (23 yrs). Established history (23+ yrs). Established history (23+ yrs). Point 3 Rating: 4★ (upper mid). Top rated. Rating: 3★ (bottom quartile). Rating: 4★ (lower mid). Rating: 3★ (bottom quartile). Point 4 Risk profile: Low. Risk profile: Low. Risk profile: Low. Risk profile: Low. Risk profile: Moderately Low. Point 5 1Y return: 6.20% (top quartile). 1Y return: 6.16% (upper mid). 1Y return: 6.16% (lower mid). 1Y return: 6.15% (bottom quartile). 1Y return: 6.14% (bottom quartile). Point 6 1M return: 0.76% (upper mid). 1M return: 0.79% (top quartile). 1M return: 0.75% (lower mid). 1M return: 0.75% (bottom quartile). 1M return: 0.74% (bottom quartile). Point 7 Sharpe: 0.35 (lower mid). Sharpe: 0.19 (bottom quartile). Sharpe: 0.48 (top quartile). Sharpe: 0.24 (bottom quartile). Sharpe: 0.39 (upper mid). Point 8 Information ratio: 0.00 (top quartile). Information ratio: 0.00 (upper mid). Information ratio: 0.00 (lower mid). Information ratio: 0.00 (bottom quartile). Information ratio: 0.00 (bottom quartile). Point 9 Yield to maturity (debt): 7.58% (bottom quartile). Yield to maturity (debt): 7.94% (top quartile). Yield to maturity (debt): 7.79% (upper mid). Yield to maturity (debt): 7.71% (bottom quartile). Yield to maturity (debt): 7.75% (lower mid). Point 10 Modified duration: 0.56 yrs (top quartile). Modified duration: 0.66 yrs (bottom quartile). Modified duration: 0.59 yrs (upper mid). Modified duration: 0.60 yrs (lower mid). Modified duration: 0.64 yrs (bottom quartile). UTI Money Market Fund
Aditya Birla Sun Life Money Manager Fund
Tata Money Market Fund
Kotak Money Market Scheme
Bandhan Money Manager Fund
To provide highest possible current income consistent with preservation of capital and providing liquidity from investing in a diversified portfolio of short term money market securities. Below is the key information for UTI Money Market Fund Returns up to 1 year are on (Erstwhile Aditya Birla Sun Life Floating Rate Fund - Short Term) The primary objective of the schemes is to generate regular income through investment in a portfolio comprising substantially of floating rate debt / money market instruments. The schemes may invest a portion of its net assets in fixed rate debt securities and money market instruments. Research Highlights for Aditya Birla Sun Life Money Manager Fund Below is the key information for Aditya Birla Sun Life Money Manager Fund Returns up to 1 year are on (Erstwhile Tata Liquid Fund) To create a highly liquid portfolio of good quality debt as well as money market instruments so as to provide reasonable returns and high liquidity to the unitholders. Research Highlights for Tata Money Market Fund Below is the key information for Tata Money Market Fund Returns up to 1 year are on (Erstwhile Kotak Floater Short Term Fund) To reduce the interest rate risk associated with investments in fixed rate instruments by investing predominantly in floating rate securities, money market instruments and using appropriate derivatives. Research Highlights for Kotak Money Market Scheme Below is the key information for Kotak Money Market Scheme Returns up to 1 year are on (Erstwhile IDFC Money Manager Fund - Treasury Plan) Seek to generate stable returns with a low risk strategy by creating a portfolio that is substantially invested in good quality floating rate debt or money market
instruments, fixed rate debt or money market instruments swapped for floating
returns and fixed rate debt and money market instruments. However, there can
be no assurance that the investment objectives of the scheme will be realized. Research Highlights for Bandhan Money Manager Fund Below is the key information for Bandhan Money Manager Fund Returns up to 1 year are on 1. UTI Money Market Fund
UTI Money Market Fund
Growth Launch Date 13 Jul 09 NAV (10 Jul 26) ₹3,290.98 ↑ 0.54 (0.02 %) Net Assets (Cr) ₹18,611 on 31 May 26 Category Debt - Money Market AMC UTI Asset Management Company Ltd Rating ☆☆☆☆ Risk Low Expense Ratio 0.25 Sharpe Ratio 0.35 Information Ratio 0 Alpha Ratio 0 Min Investment 10,000 Min SIP Investment 500 Exit Load NIL Yield to Maturity 7.58% Effective Maturity 6 Months 20 Days Modified Duration 6 Months 20 Days Growth of 10,000 investment over the years.
Date Value 30 Jun 21 ₹10,000 30 Jun 22 ₹10,381 30 Jun 23 ₹11,091 30 Jun 24 ₹11,922 30 Jun 25 ₹12,901 30 Jun 26 ₹13,717 Returns for UTI Money Market Fund
absolute basis & more than 1 year are on CAGR (Compound Annual Growth Rate) basis. as on 10 Jul 26 Duration Returns 1 Month 0.8% 3 Month 1.6% 6 Month 3.2% 1 Year 6.2% 3 Year 7.3% 5 Year 6.5% 10 Year 15 Year Since launch 7.3% Historical performance (Yearly) on absolute basis
Year Returns 2025 7.5% 2024 7.7% 2023 7.4% 2022 4.9% 2021 3.7% 2020 6% 2019 8% 2018 7.8% 2017 6.7% 2016 7.7% Fund Manager information for UTI Money Market Fund
Name Since Tenure Anurag Mittal 1 Dec 21 4.58 Yr. Amit Sharma 7 Jul 17 8.99 Yr. Data below for UTI Money Market Fund as on 31 May 26
Asset Allocation
Asset Class Value Cash 86.17% Debt 13.52% Other 0.31% Debt Sector Allocation
Sector Value Corporate 46.48% Cash Equivalent 35.25% Government 17.97% Credit Quality
Rating Value AAA 100% Top Securities Holdings / Portfolio
Name Holding Value Quantity India (Republic of)
- | -4% ₹654 Cr 6,629,850,000 Indusind Bank Ltd.
Debentures | -2% ₹338 Cr 3,500,000,000
↑ 3,500,000,000 Tbill
Sovereign Bonds | -2% ₹297 Cr 3,000,000,000 Tbill
Sovereign Bonds | -2% ₹296 Cr 3,000,000,000 5.74% Govt Stock 2026
Sovereign Bonds | -2% ₹280 Cr 2,800,000,000 Tbill
Sovereign Bonds | -1% ₹248 Cr 2,500,000,000 Tbill
Sovereign Bonds | -1% ₹198 Cr 2,000,000,000 Indian Bank
Domestic Bonds | -1% ₹195 Cr 2,000,000,000 Axis Bank Ltd.
Debentures | -1% ₹191 Cr 2,000,000,000
↑ 2,000,000,000 Indian Overseas Bank
Debentures | -1% ₹190 Cr 2,000,000,000 2. Aditya Birla Sun Life Money Manager Fund
Aditya Birla Sun Life Money Manager Fund
Growth Launch Date 13 Oct 05 NAV (10 Jul 26) ₹394.729 ↑ 0.07 (0.02 %) Net Assets (Cr) ₹27,550 on 31 May 26 Category Debt - Money Market AMC Birla Sun Life Asset Management Co Ltd Rating ☆☆☆☆☆ Risk Low Expense Ratio 0.35 Sharpe Ratio 0.19 Information Ratio 0 Alpha Ratio 0 Min Investment 1,000 Min SIP Investment 1,000 Exit Load NIL Yield to Maturity 7.94% Effective Maturity 8 Months 1 Day Modified Duration 7 Months 28 Days Growth of 10,000 investment over the years.
Date Value 30 Jun 21 ₹10,000 30 Jun 22 ₹10,373 30 Jun 23 ₹11,087 30 Jun 24 ₹11,925 30 Jun 25 ₹12,891 30 Jun 26 ₹13,700 Returns for Aditya Birla Sun Life Money Manager Fund
absolute basis & more than 1 year are on CAGR (Compound Annual Growth Rate) basis. as on 10 Jul 26 Duration Returns 1 Month 0.8% 3 Month 1.6% 6 Month 3.3% 1 Year 6.2% 3 Year 7.3% 5 Year 6.5% 10 Year 15 Year Since launch 6.8% Historical performance (Yearly) on absolute basis
Year Returns 2025 7.4% 2024 7.8% 2023 7.4% 2022 4.8% 2021 3.8% 2020 6.6% 2019 8% 2018 7.9% 2017 6.8% 2016 7.7% Fund Manager information for Aditya Birla Sun Life Money Manager Fund
Name Since Tenure Kaustubh Gupta 15 Jul 11 14.97 Yr. Anuj Jain 22 Mar 21 5.28 Yr. Mohit Sharma 1 Apr 17 9.25 Yr. Data below for Aditya Birla Sun Life Money Manager Fund as on 31 May 26
Asset Allocation
Asset Class Value Cash 69.19% Debt 30.52% Other 0.29% Debt Sector Allocation
Sector Value Corporate 51.26% Cash Equivalent 33.61% Government 14.84% Credit Quality
Rating Value AAA 100% Top Securities Holdings / Portfolio
Name Holding Value Quantity Indusind Bank Ltd.
Debentures | -5% ₹1,383 Cr 29,000 Axis Bank Ltd.
Debentures | -3% ₹917 Cr 19,000 Federal Bank Ltd.
Debentures | -3% ₹905 Cr 19,000 Gujarat State Development Loans
Sovereign Bonds | -3% ₹797 Cr 79,327,600 Karur Vysya Bank Ltd.
Debentures | -2% ₹475 Cr 10,000 Tbill
Sovereign Bonds | -1% ₹394 Cr 40,000,000 7.49% Gujarat Sgs 2026
Sovereign Bonds | -1% ₹327 Cr 32,500,000 7.43% Gujarat Sgs 2027
Sovereign Bonds | -1% ₹247 Cr 24,500,000 Tbill
Sovereign Bonds | -1% ₹245 Cr 25,000,000 Karur Vysya Bank Ltd.
Debentures | -1% ₹242 Cr 5,000 3. Tata Money Market Fund
Tata Money Market Fund
Growth Launch Date 22 May 03 NAV (10 Jul 26) ₹5,037.87 ↑ 0.79 (0.02 %) Net Assets (Cr) ₹33,030 on 31 May 26 Category Debt - Money Market AMC Tata Asset Management Limited Rating ☆☆☆ Risk Low Expense Ratio 0.44 Sharpe Ratio 0.48 Information Ratio 0 Alpha Ratio 0 Min Investment 5,000 Min SIP Investment 500 Exit Load NIL Yield to Maturity 7.79% Effective Maturity 7 Months 1 Day Modified Duration 7 Months 1 Day Growth of 10,000 investment over the years.
Date Value 30 Jun 21 ₹10,000 30 Jun 22 ₹10,373 30 Jun 23 ₹11,077 30 Jun 24 ₹11,911 30 Jun 25 ₹12,877 30 Jun 26 ₹13,686 Returns for Tata Money Market Fund
absolute basis & more than 1 year are on CAGR (Compound Annual Growth Rate) basis. as on 10 Jul 26 Duration Returns 1 Month 0.7% 3 Month 1.6% 6 Month 3.3% 1 Year 6.2% 3 Year 7.3% 5 Year 6.5% 10 Year 15 Year Since launch 6.8% Historical performance (Yearly) on absolute basis
Year Returns 2025 7.4% 2024 7.7% 2023 7.4% 2022 4.8% 2021 3.9% 2020 6.4% 2019 8.1% 2018 -0.1% 2017 6.7% 2016 7.6% Fund Manager information for Tata Money Market Fund
Name Since Tenure Amit Somani 16 Oct 13 12.71 Yr. Harsh Dave 1 Jun 26 0.08 Yr. Data below for Tata Money Market Fund as on 31 May 26
Asset Allocation
Asset Class Value Cash 87.56% Debt 12.11% Other 0.32% Debt Sector Allocation
Sector Value Corporate 46.25% Cash Equivalent 37.93% Government 15.5% Credit Quality
Rating Value AAA 100% Top Securities Holdings / Portfolio
Name Holding Value Quantity India (Republic of)
- | -3% ₹1,000 Cr 100,000,000
↑ 100,000,000 Indian Bank
Domestic Bonds | -3% ₹958 Cr 19,500 Indian Overseas Bank
Debentures | -2% ₹666 Cr 14,000 Equitas Small Finance Bank Ltd.
Debentures | -2% ₹567 Cr 12,000 India (Republic of)
- | -2% ₹527 Cr 53,000,000 7.86% Karnataka Sdl 2027
Sovereign Bonds | -2% ₹491 Cr 48,500,000
↑ 48,500,000 Karur Vysya Bank Ltd.
Debentures | -2% ₹491 Cr 10,000 Tbill
Sovereign Bonds | -1% ₹445 Cr 45,000,000 India (Republic of)
- | -1% ₹400 Cr 40,500,000 India (Republic of)
- | -1% ₹302 Cr 30,500,000
↓ -25,000,000 4. Kotak Money Market Scheme
Kotak Money Market Scheme
Growth Launch Date 14 Jul 03 NAV (10 Jul 26) ₹4,790.6 ↑ 0.65 (0.01 %) Net Assets (Cr) ₹31,606 on 31 May 26 Category Debt - Money Market AMC Kotak Mahindra Asset Management Co Ltd Rating ☆☆☆☆ Risk Low Expense Ratio 0.36 Sharpe Ratio 0.24 Information Ratio 0 Alpha Ratio 0 Min Investment 5,000 Min SIP Investment 1,000 Exit Load NIL Yield to Maturity 7.71% Effective Maturity 7 Months 6 Days Modified Duration 7 Months 6 Days Growth of 10,000 investment over the years.
Date Value 30 Jun 21 ₹10,000 30 Jun 22 ₹10,382 30 Jun 23 ₹11,079 30 Jun 24 ₹11,905 30 Jun 25 ₹12,872 30 Jun 26 ₹13,680 Returns for Kotak Money Market Scheme
absolute basis & more than 1 year are on CAGR (Compound Annual Growth Rate) basis. as on 10 Jul 26 Duration Returns 1 Month 0.7% 3 Month 1.6% 6 Month 3.2% 1 Year 6.2% 3 Year 7.3% 5 Year 6.5% 10 Year 15 Year Since launch 7.1% Historical performance (Yearly) on absolute basis
Year Returns 2025 7.4% 2024 7.7% 2023 7.3% 2022 4.9% 2021 3.7% 2020 5.7% 2019 8% 2018 7.7% 2017 6.7% 2016 7.7% Fund Manager information for Kotak Money Market Scheme
Name Since Tenure Deepak Agrawal 1 Nov 06 19.67 Yr. Manu Sharma 1 Nov 22 3.66 Yr. Data below for Kotak Money Market Scheme as on 31 May 26
Asset Allocation
Asset Class Value Cash 87.94% Debt 11.75% Other 0.31% Debt Sector Allocation
Sector Value Corporate 46.99% Cash Equivalent 33.44% Government 19.26% Credit Quality
Rating Value AAA 100% Top Securities Holdings / Portfolio
Name Holding Value Quantity India (Republic of)
- | -4% ₹1,332 Cr 135,000,000 Tbill
Sovereign Bonds | -3% ₹988 Cr 100,000,000 Tbill
Sovereign Bonds | -2% ₹742 Cr 75,000,000 Indusind Bank Ltd.
Debentures | -2% ₹715 Cr 75,000 Punjab National Bank
Debentures | -2% ₹478 Cr 50,000 06/08/2026 Maturing 182 DTB
Sovereign Bonds | -1% ₹397 Cr 40,000,000
↓ -25,000,000 Tbill
Sovereign Bonds | -1% ₹371 Cr 37,500,000 Federal Bank Ltd.
Debentures | -1% ₹359 Cr 37,500 India (Republic of)
- | -1% ₹248 Cr 25,000,000
↓ -15,000,000 Karur Vysya Bank Ltd.
Debentures | -1% ₹238 Cr 25,000 5. Bandhan Money Manager Fund
Bandhan Money Manager Fund
Growth Launch Date 18 Feb 03 NAV (10 Jul 26) ₹42.99 ↑ 0.01 (0.02 %) Net Assets (Cr) ₹14,977 on 31 May 26 Category Debt - Money Market AMC IDFC Asset Management Company Limited Rating ☆☆☆ Risk Moderately Low Expense Ratio 0.58 Sharpe Ratio 0.39 Information Ratio 0 Alpha Ratio 0 Min Investment 100 Min SIP Investment 1,000 Exit Load NIL Yield to Maturity 7.75% Effective Maturity 7 Months 21 Days Modified Duration 7 Months 21 Days Growth of 10,000 investment over the years.
Date Value 30 Jun 21 ₹10,000 30 Jun 22 ₹10,296 30 Jun 23 ₹10,917 30 Jun 24 ₹11,653 30 Jun 25 ₹12,576 30 Jun 26 ₹13,365 Returns for Bandhan Money Manager Fund
absolute basis & more than 1 year are on CAGR (Compound Annual Growth Rate) basis. as on 10 Jul 26 Duration Returns 1 Month 0.7% 3 Month 1.6% 6 Month 3.2% 1 Year 6.1% 3 Year 6.9% 5 Year 6% 10 Year 15 Year Since launch 6.4% Historical performance (Yearly) on absolute basis
Year Returns 2025 7.3% 2024 7.2% 2023 6.7% 2022 4% 2021 2.9% 2020 5% 2019 6.7% 2018 6.2% 2017 6% 2016 8.1% Fund Manager information for Bandhan Money Manager Fund
Name Since Tenure Gautam Kaul 1 Dec 21 4.58 Yr. Brijesh Shah 12 Jul 21 4.97 Yr. Data below for Bandhan Money Manager Fund as on 31 May 26
Asset Allocation
Asset Class Value Cash 92.62% Debt 7.14% Other 0.24% Debt Sector Allocation
Sector Value Corporate 48.39% Cash Equivalent 36.25% Government 15.12% Credit Quality
Rating Value AAA 100% Top Securities Holdings / Portfolio
Name Holding Value Quantity Tbill
Sovereign Bonds | -7% ₹990 Cr 100,000,000 National Bank for Agriculture and Rural Development
Domestic Bonds | -2% ₹331 Cr 35,000,000 Tbill
Sovereign Bonds | -2% ₹248 Cr 25,000,000 ICICI Bank Ltd.
Debentures | -1% ₹189 Cr 20,000,000 7.08% Karnataka Sdl 2026
Sovereign Bonds | -1% ₹106 Cr 10,500,000 Tbill
Sovereign Bonds | -1% ₹99 Cr 10,000,000 HDFC Bank Ltd.
Debentures | -1% ₹95 Cr 10,000,000 Tbill
Sovereign Bonds | -1% ₹79 Cr 8,000,000
↓ -2,000,000 National Bank for Agriculture and Rural Development
Domestic Bonds | -0% ₹71 Cr 7,500,000 7.39% Tamilnadu SDL 2026
Sovereign Bonds | -0% ₹60 Cr 5,928,300
निष्कर्ष
आम्ही मनी मार्केट इन्स्ट्रुमेंट्स बद्दल शिकलो असताना, डेट म्युच्युअल फंड, त्यांचे प्रकार आणि वर्गीकरण याबद्दल जाणून घेणे देखील महत्त्वाचे आहे. बरं, डेट म्युच्युअल फंड हे लिक्विड फंड, अल्ट्रा यांसारख्या सामान्य विस्तृत श्रेणींमध्ये वर्गीकृत आहेतअल्पकालीन निधी, अल्पकालीन निधी, दीर्घकालीन उत्पन्न निधी आणिगिल्ट फंड.
तथापि, मनी मार्केट फंडांमध्ये गुंतवणूक करण्यासाठी, परिस्थिती समजून घेणे फार महत्वाचे आहेअर्थव्यवस्था, व्याजदरांची दिशा आणि गुंतवणूक करताना कॉर्पोरेट कर्ज तसेच सरकारी कर्जातील उत्पन्नाच्या हालचालीची अपेक्षित दिशा.
येथे प्रदान केलेली माहिती अचूक असल्याची खात्री करण्यासाठी सर्व प्रयत्न केले गेले आहेत. तथापि, डेटाच्या अचूकतेबद्दल कोणतीही हमी दिली जात नाही. कृपया कोणतीही गुंतवणूक करण्यापूर्वी योजना माहिती दस्तऐवजासह सत्यापित करा.


?")


AMFI Registration No. 112358 | CIN: U74999MH2016PTC282153
Shepard Technologies Pvt. Ltd. (with ARN code 112358) makes no warranties or representations, express or implied, on products offered through the platform. It accepts no liability for any damages or losses, however caused, in connection with the use of, or on the reliance of its product or related services. Terms and conditions of the website are applicable.
©2026 Shepard Technologies Private Limited. All Rights Reserved
Research Highlights for UTI Money Market Fund