7 بہترین ثالثی میوچل فنڈز 2022
عام طور پر، ثالثی فنڈز میں سرمایہ کاری کرنے کے خواہشمند لوگ بہترین ثالثی فنڈز تلاش کرتے ہیں۔ لیکن ثالثی فنڈز کیا ہیں؟
ثالثی فنڈ ہندوستان میں ایک مقبول مختصر مدتی مالیاتی سرمایہ کاری ہے۔ ثالثی فنڈز ہیں۔باہمی چندہ جو نقد کے درمیان فرق کی قیمت کا فائدہ اٹھاتا ہے۔مارکیٹ اور مشتق مارکیٹ میوچل فنڈ ریٹرن پیدا کرنے کے لیے۔
ثالثی فنڈز سے حاصل ہونے والے منافع کا انحصار اسٹاک مارکیٹ کے اتار چڑھاؤ پر ہوتا ہے۔ ثالثی میوچل فنڈز فطرت میں ہائبرڈ ہوتے ہیں اور زیادہ یا مستقل اتار چڑھاؤ کے وقت، یہ فنڈز سرمایہ کاروں کو نسبتاً خطرے سے پاک واپسی پیش کرتے ہیں۔ اس سے پہلےسرمایہ کاری ان فنڈز میں ثالثی فنڈز کے ٹیکس کو سمجھنا اور بہترین ثالثی فنڈز کو جاننا ضروری ہے۔
ثالثی فنڈز میں سرمایہ کاری کیوں؟
یہاں کے کچھ ہیںسرمایہ کاری کے فوائد ثالثی فنڈز میں:
1. نہ ہونے کے برابر خطرہ
ثالثی فنڈز 100% خطرے سے پاک نہیں ہوتے لیکن ان میں نہ ہونے کے برابر خطرہ ہوتا ہے۔ وہبینک مارکیٹوں میں ہونے والی غلط قیمتوں پر۔ یہ دیتا ہےسرمایہ کار دوسرے کے مقابلے میں ایک محفوظ آپشنمختصر مدت کے فنڈز چونکہ یہ فنڈز مارکیٹ کے اتار چڑھاؤ کے دوران بہتر منافع پیش کرتے ہیں۔
2. واپسی
یہ فنڈز عموماً لگائی گئی رقم کا تقریباً 7-9% واپسی دیتے ہیں۔ کے مقابلے میں یہ زیادہ ہے۔مائع فنڈز یا کم شرح والے ماحول میں مختصر مدت کے قرض فنڈز (جب RBI شرح کو کم کر رہا ہے)۔
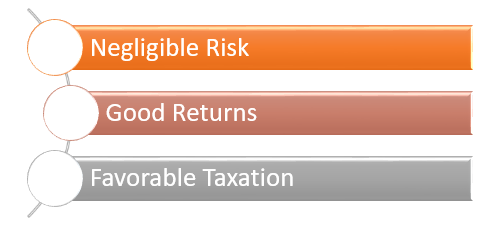
اس طرح، ثالثی فنڈز کو ایک منافع بخش سرمایہ کاری کا اختیار بنانا۔
3. سازگار ٹیکس
ان فنڈز میں سرمایہ کاری کا سب سے بڑا فائدہ ٹیکس کا علاج ہے۔ایکویٹی فنڈز طویل مدتی کو اپنی طرف متوجہ کریںسرمایہ فوائد. اگر منافع INR 1 لاکھ تک ہوتا ہے تو اس کا شمار ٹیکس فری کے تحت ہوتا ہے۔ INR 1 لاکھ سے زیادہ کے منافع پر 10% ٹیکس لاگو ہوتا ہے۔
ثالثی فنڈز ٹیکسیشن
جیسا کہ اوپر ذکر کیا گیا ہے، ان فنڈز پر احسن طریقے سے ٹیکس لگایا جاتا ہے۔ کہا جاتا ہے کہ وہ خیر کا مجموعہ ہیں۔قرض فنڈ ریٹرن اور ایکویٹی میوچل فنڈز کے ٹیکس کا علاج۔ اگر فنڈ کا 65% سے زیادہ ایکویٹی میں لگایا جاتا ہے، تو اسے ٹیکس کے لیے ایکویٹی فنڈ سمجھا جائے گا۔ بجٹ 2018 کے مطابق، ایکویٹی فنڈز لانگ ٹرم کیپیٹل گینز (LTCG) کو راغب کریں گے۔ طویل مدتی کے تحت سرمایہ کاروں پر 10% (بغیر اشاریہ کے) ٹیکس لگایا جائے گا۔سرمایہ حاصل ٹیکس INR 1 لاکھ تک کے منافع ٹیکس سے پاک ہیں۔ INR 1 لاکھ سے زیادہ کے منافع پر 10% ٹیکس لاگو ہوتا ہے۔ ایکویٹی سے قلیل مدتی سرمائے کا فائدہ 15% رعایتی شرح کو راغب کرتا ہے۔
لہذا، اگر آپ مختصر مدت کی سرمایہ کاری کرنے اور اس کے ساتھ ٹیکس کے فوائد حاصل کرنے کا منصوبہ بنا رہے ہیں، تو ثالثی فنڈز میں سرمایہ کاری کرنے پر غور کریں۔
Talk to our investment specialist
ٹاپ 7 آربیٹریج میوچل فنڈز 2022 - 2023
Fund NAV Net Assets (Cr) 3 MO (%) 6 MO (%) 1 YR (%) 3 YR (%) 5 YR (%) 2025 (%) Invesco India Arbitrage Fund Growth ₹34.0037
↑ 0.00 ₹28,526 1.6 2.9 6 6.9 6.3 6.5 Kotak Equity Arbitrage Fund Growth ₹39.9223
↑ 0.01 ₹72,409 1.6 3 6 7 6.2 6.4 ICICI Prudential Equity Arbitrage Fund Growth ₹36.5476
↑ 0.01 ₹33,423 1.6 2.9 6 6.9 6.1 6.5 HDFC Arbitrage Fund Growth ₹32.626
↑ 0.00 ₹23,772 1.6 2.9 6 6.9 6 6.3 UTI Arbitrage Fund Growth ₹37.3256
↑ 0.01 ₹11,324 1.5 2.9 6 7 6 6.5 SBI Arbitrage Opportunities Fund Growth ₹36.0104
↑ 0.00 ₹45,923 1.5 2.9 5.9 6.9 6.2 6.5 Nippon India Arbitrage Fund Growth ₹28.2414
↑ 0.01 ₹16,638 1.6 2.9 5.9 6.8 5.9 6.2 Note: Returns up to 1 year are on absolute basis & more than 1 year are on CAGR basis. as on 31 Jul 26 Research Highlights & Commentary of 7 Funds showcased
Commentary Invesco India Arbitrage Fund Kotak Equity Arbitrage Fund ICICI Prudential Equity Arbitrage Fund HDFC Arbitrage Fund UTI Arbitrage Fund SBI Arbitrage Opportunities Fund Nippon India Arbitrage Fund Point 1 Lower mid AUM (₹28,526 Cr). Highest AUM (₹72,409 Cr). Upper mid AUM (₹33,423 Cr). Lower mid AUM (₹23,772 Cr). Bottom quartile AUM (₹11,324 Cr). Upper mid AUM (₹45,923 Cr). Bottom quartile AUM (₹16,638 Cr). Point 2 Established history (19+ yrs). Oldest track record among peers (20 yrs). Established history (19+ yrs). Established history (18+ yrs). Established history (20+ yrs). Established history (19+ yrs). Established history (15+ yrs). Point 3 Rating: 3★ (lower mid). Top rated. Rating: 4★ (upper mid). Rating: 3★ (lower mid). Rating: 3★ (bottom quartile). Rating: 2★ (bottom quartile). Rating: 4★ (upper mid). Point 4 Risk profile: Moderately Low. Risk profile: Moderately Low. Risk profile: Moderate. Risk profile: Moderately Low. Risk profile: Moderately Low. Risk profile: Moderately Low. Risk profile: Moderately Low. Point 5 5Y return: 6.26% (top quartile). 5Y return: 6.23% (upper mid). 5Y return: 6.06% (lower mid). 5Y return: 6.02% (bottom quartile). 5Y return: 6.05% (lower mid). 5Y return: 6.25% (upper mid). 5Y return: 5.95% (bottom quartile). Point 6 3Y return: 6.93% (upper mid). 3Y return: 7.02% (top quartile). 3Y return: 6.91% (lower mid). 3Y return: 6.90% (bottom quartile). 3Y return: 6.96% (upper mid). 3Y return: 6.91% (lower mid). 3Y return: 6.75% (bottom quartile). Point 7 1Y return: 6.03% (top quartile). 1Y return: 5.99% (upper mid). 1Y return: 5.99% (upper mid). 1Y return: 5.97% (lower mid). 1Y return: 5.97% (lower mid). 1Y return: 5.93% (bottom quartile). 1Y return: 5.90% (bottom quartile). Point 8 1M return: 0.62% (upper mid). 1M return: 0.62% (upper mid). 1M return: 0.64% (top quartile). 1M return: 0.58% (bottom quartile). 1M return: 0.60% (lower mid). 1M return: 0.61% (lower mid). 1M return: 0.59% (bottom quartile). Point 9 Alpha: 0.00 (top quartile). Alpha: 0.00 (upper mid). Alpha: 0.00 (upper mid). Alpha: 0.00 (lower mid). Alpha: 0.00 (lower mid). Alpha: 0.00 (bottom quartile). Alpha: 0.00 (bottom quartile). Point 10 Sharpe: 0.47 (top quartile). Sharpe: 0.31 (lower mid). Sharpe: 0.29 (bottom quartile). Sharpe: 0.36 (upper mid). Sharpe: 0.34 (upper mid). Sharpe: 0.33 (lower mid). Sharpe: 0.22 (bottom quartile). Invesco India Arbitrage Fund
Kotak Equity Arbitrage Fund
ICICI Prudential Equity Arbitrage Fund
HDFC Arbitrage Fund
UTI Arbitrage Fund
SBI Arbitrage Opportunities Fund
Nippon India Arbitrage Fund
*نیچے ترتیب دیئے گئے ثالثی فنڈز کی فہرست ہے۔آخری 1 سال کی واپسی اور AUM> 100 کروڑ ہونا.
The primary investment objective of the scheme is to generate income through arbitrage opportunities emerging out of mis-pricing between the cash market and the derivatives market and through deployment of surplus cash in fixed income instruments. Below is the key information for Invesco India Arbitrage Fund Returns up to 1 year are on The investment objective of the scheme is to generate capital appreciation and income by predominantly investing in arbitrage opportunities in the cash and derivatives segment of the equity market, and by investing the balance in debt and money market instruments. However, there is no assurance that the objective of the scheme will be realized Research Highlights for Kotak Equity Arbitrage Fund Below is the key information for Kotak Equity Arbitrage Fund Returns up to 1 year are on The investment objective of Income Optimiser Plan under the scheme is to seek to generate low volatility returns by using arbitrage and other derivative strategies in equity markets and investments in short-term debt portfolio. Research Highlights for ICICI Prudential Equity Arbitrage Fund Below is the key information for ICICI Prudential Equity Arbitrage Fund Returns up to 1 year are on "To generate income through arbitrage opportunities between cash and derivative market and arbitrage opportunities within the derivative segment and by deployment of surplus cash in debt securities and money market instruments." Research Highlights for HDFC Arbitrage Fund Below is the key information for HDFC Arbitrage Fund Returns up to 1 year are on (Erstwhile UTI SPREAD Fund) The investment objective of the scheme is to provide capital appreciation and dividend distribution through arbitrage opportunities arising out of price differences between the cash and derivative market by investing predominantly in equity and equity-related securities, derivatives and the balance portion in debt securities. However, there can be no assurance that the investment objective of the scheme will be realised. Research Highlights for UTI Arbitrage Fund Below is the key information for UTI Arbitrage Fund Returns up to 1 year are on To provide capital appreciation and regular income for unitholders by identifying profitable arbitrage opportunities between the spot and derivative market segments as also through investment of surplus cash in debt and money market instruments. Research Highlights for SBI Arbitrage Opportunities Fund Below is the key information for SBI Arbitrage Opportunities Fund Returns up to 1 year are on (Erstwhile Reliance Arbitrage Advantage Fund) The investment objective of the scheme is to generate income by taking advantage of the arbitrage opportunities that potentially exists between cash and derivative market and within the derivative segment along with investments in debt securities & money market instruments. Research Highlights for Nippon India Arbitrage Fund Below is the key information for Nippon India Arbitrage Fund Returns up to 1 year are on 1. Invesco India Arbitrage Fund
Invesco India Arbitrage Fund
Growth Launch Date 30 Apr 07 NAV (31 Jul 26) ₹34.0037 ↑ 0.00 (0.01 %) Net Assets (Cr) ₹28,526 on 30 Jun 26 Category Hybrid - Arbitrage AMC Invesco Asset Management (India) Private Ltd Rating ☆☆☆ Risk Moderately Low Expense Ratio 1.06 Sharpe Ratio 0.47 Information Ratio 0 Alpha Ratio 0 Min Investment 5,000 Min SIP Investment 500 Exit Load 0-15 Days (0.5%),15 Days and above(NIL) Growth of 10,000 investment over the years.
Date Value 31 Jul 21 ₹10,000 31 Jul 22 ₹10,368 31 Jul 23 ₹11,077 31 Jul 24 ₹11,946 31 Jul 25 ₹12,775 Returns for Invesco India Arbitrage Fund
absolute basis & more than 1 year are on CAGR (Compound Annual Growth Rate) basis. as on 31 Jul 26 Duration Returns 1 Month 0.6% 3 Month 1.6% 6 Month 2.9% 1 Year 6% 3 Year 6.9% 5 Year 6.3% 10 Year 15 Year Since launch 6.6% Historical performance (Yearly) on absolute basis
Year Returns 2025 6.5% 2024 7.6% 2023 7.4% 2022 5.1% 2021 3.5% 2020 4.3% 2019 5.9% 2018 5.9% 2017 5.5% 2016 6.5% Fund Manager information for Invesco India Arbitrage Fund
Name Since Tenure Deepak Gupta 11 Nov 21 4.64 Yr. Pradeep Sukte 25 Jun 26 0.01 Yr. Data below for Invesco India Arbitrage Fund as on 30 Jun 26
Asset Allocation
Asset Class Value Cash 97.74% Debt 2.79% Equity Sector Allocation
Sector Value Financial Services 29.67% Basic Materials 6.63% Consumer Cyclical 5.89% Industrials 5.55% Energy 5.47% Health Care 4.85% Consumer Defensive 3.25% Communication Services 3.2% Utility 2.3% Real Estate 0.73% Technology 0.54% Debt Sector Allocation
Sector Value Cash Equivalent 81.55% Corporate 17.35% Government 2.28% Credit Quality
Rating Value AA 1.84% AAA 98.16% Top Securities Holdings / Portfolio
Name Holding Value Quantity Future on BANK Index
- | -18% -₹4,993 Cr 233,489,475
↑ 135,632,150 Invesco India Liquid Dir Gr
Investment Fund | -7% ₹1,886 Cr 4,932,898
↓ -1,205,000 HDFC Bank Ltd (Financial Services)
Equity, Since 31 Jan 23 | HDFCBANK6% ₹1,767 Cr 23,732,950
↑ 14,076,050 ICICI Bank Ltd (Financial Services)
Equity, Since 31 Oct 24 | ICICIBANK6% ₹1,583 Cr 12,601,400
↑ 5,239,500 Invesco India Money Market Dir Gr
Investment Fund | -5% ₹1,467 Cr 4,415,910 Future on Reliance Industries Ltd
Derivatives | -3% -₹711 Cr 5,343,000
↑ 5,343,000 Reliance Industries Ltd (Energy)
Equity, Since 31 Dec 22 | RELIANCE3% ₹706 Cr 5,343,000
↑ 1,528,500 Future on Bharat Heavy Electricals Ltd
Derivatives | -2% -₹655 Cr 15,584,625
↑ 15,584,625 Bharat Heavy Electricals Ltd (Industrials)
Equity, Since 31 Mar 23 | BHEL2% ₹649 Cr 15,584,625
↓ -2,000,250 State Bank of India (Financial Services)
Equity, Since 31 Jan 23 | SBIN2% ₹641 Cr 6,649,500
↓ -2,771,250 2. Kotak Equity Arbitrage Fund
Kotak Equity Arbitrage Fund
Growth Launch Date 29 Sep 05 NAV (31 Jul 26) ₹39.9223 ↑ 0.01 (0.02 %) Net Assets (Cr) ₹72,409 on 30 Jun 26 Category Hybrid - Arbitrage AMC Kotak Mahindra Asset Management Co Ltd Rating ☆☆☆☆ Risk Moderately Low Expense Ratio 0.97 Sharpe Ratio 0.31 Information Ratio 0 Alpha Ratio 0 Min Investment 5,000 Min SIP Investment 500 Exit Load 0-30 Days (0.25%),30 Days and above(NIL) Growth of 10,000 investment over the years.
Date Value 31 Jul 21 ₹10,000 31 Jul 22 ₹10,349 31 Jul 23 ₹11,034 31 Jul 24 ₹11,925 31 Jul 25 ₹12,761 Returns for Kotak Equity Arbitrage Fund
absolute basis & more than 1 year are on CAGR (Compound Annual Growth Rate) basis. as on 31 Jul 26 Duration Returns 1 Month 0.6% 3 Month 1.6% 6 Month 3% 1 Year 6% 3 Year 7% 5 Year 6.2% 10 Year 15 Year Since launch 6.9% Historical performance (Yearly) on absolute basis
Year Returns 2025 6.4% 2024 7.8% 2023 7.4% 2022 4.5% 2021 4% 2020 4.3% 2019 6.1% 2018 6.3% 2017 5.8% 2016 6.7% Fund Manager information for Kotak Equity Arbitrage Fund
Name Since Tenure Hiten Shah 3 Oct 19 6.75 Yr. Data below for Kotak Equity Arbitrage Fund as on 30 Jun 26
Asset Allocation
Asset Class Value Cash 92.61% Debt 8% Other 0.06% Equity Sector Allocation
Sector Value Financial Services 26.85% Consumer Cyclical 7.94% Basic Materials 7.71% Energy 6.55% Industrials 6.48% Utility 4.97% Health Care 4.21% Communication Services 3.84% Consumer Defensive 3.45% Technology 0.96% Debt Sector Allocation
Sector Value Cash Equivalent 79.27% Corporate 16.25% Government 5.08% Credit Quality
Rating Value AAA 100% Top Securities Holdings / Portfolio
Name Holding Value Quantity Kotak Money Market Dir Gr
Investment Fund | -11% ₹8,159 Cr 17,061,028 Kotak Savings Fund Dir Gr
Investment Fund | -5% ₹3,915 Cr 826,303,438
↓ -31,700,680 ICICI Bank Ltd (Financial Services)
Equity, Since 31 Dec 19 | ICICIBANK5% ₹3,562 Cr 28,349,300
↑ 12,098,800 ICICI Bank Ltd.-JUN2026
Derivatives | -5% -₹3,407 Cr 26,824,000
↑ 23,160,900 HDFC Bank Ltd (Financial Services)
Equity, Since 30 Apr 22 | HDFCBANK4% ₹3,219 Cr 43,231,450
↑ 7,065,700 HDFC Bank Ltd.-JUN2026
Derivatives | -4% -₹2,898 Cr 39,114,350
↑ 25,024,450 Reliance Industries Ltd (Energy)
Equity, Since 31 May 18 | RELIANCE3% ₹2,405 Cr 18,201,500
↑ 11,245,500 RELIANCE INDUSTRIES LTD.-JUN2026
Derivatives | -3% -₹2,319 Cr 17,438,500
↑ 13,632,000 Kotak Low Duration Dir Gr
Investment Fund | -3% ₹2,050 Cr 5,338,100
↑ 377,270 Axis Bank Ltd (Financial Services)
Equity, Since 30 Jun 18 | AXISBANK2% ₹1,474 Cr 11,455,000
↓ -410,625 3. ICICI Prudential Equity Arbitrage Fund
ICICI Prudential Equity Arbitrage Fund
Growth Launch Date 30 Dec 06 NAV (31 Jul 26) ₹36.5476 ↑ 0.01 (0.02 %) Net Assets (Cr) ₹33,423 on 30 Jun 26 Category Hybrid - Arbitrage AMC ICICI Prudential Asset Management Company Limited Rating ☆☆☆☆ Risk Moderate Expense Ratio 0.9 Sharpe Ratio 0.29 Information Ratio 0 Alpha Ratio 0 Min Investment 5,000 Min SIP Investment 1,000 Exit Load 0-1 Months (0.25%),1 Months and above(NIL) Growth of 10,000 investment over the years.
Date Value 31 Jul 21 ₹10,000 31 Jul 22 ₹10,319 31 Jul 23 ₹10,981 31 Jul 24 ₹11,831 31 Jul 25 ₹12,660 Returns for ICICI Prudential Equity Arbitrage Fund
absolute basis & more than 1 year are on CAGR (Compound Annual Growth Rate) basis. as on 31 Jul 26 Duration Returns 1 Month 0.6% 3 Month 1.6% 6 Month 2.9% 1 Year 6% 3 Year 6.9% 5 Year 6.1% 10 Year 15 Year Since launch 6.8% Historical performance (Yearly) on absolute basis
Year Returns 2025 6.5% 2024 7.6% 2023 7.1% 2022 4.2% 2021 3.9% 2020 4.3% 2019 5.9% 2018 6.2% 2017 5.5% 2016 6.8% Fund Manager information for ICICI Prudential Equity Arbitrage Fund
Name Since Tenure Nikhil Kabra 29 Dec 20 5.51 Yr. Sharmila D'Silva 31 Jul 22 3.92 Yr. Darshil Dedhia 13 Sep 24 1.8 Yr. Ajaykumar Solanki 23 Aug 24 1.85 Yr. Archana Nair 1 Feb 24 2.41 Yr. Data below for ICICI Prudential Equity Arbitrage Fund as on 30 Jun 26
Asset Allocation
Asset Class Value Cash 94.91% Debt 5.69% Other 0.05% Equity Sector Allocation
Sector Value Financial Services 22.67% Communication Services 9.35% Basic Materials 7.56% Consumer Cyclical 6.61% Industrials 6.02% Health Care 5.39% Energy 5.07% Utility 3.51% Consumer Defensive 2.98% Real Estate 1.44% Technology 0.45% Debt Sector Allocation
Sector Value Cash Equivalent 77.8% Corporate 17.69% Government 5.12% Credit Quality
Rating Value AAA 100% Top Securities Holdings / Portfolio
Name Holding Value Quantity ICICI Pru Money Market Dir Gr
Investment Fund | -16% ₹5,182 Cr 127,933,512 Future on Bharti Airtel Ltd
Derivatives | -5% -₹1,675 Cr 9,081,050
↑ 9,081,050 Bharti Airtel Ltd (Communication Services)
Equity, Since 31 Dec 23 | BHARTIARTL5% ₹1,661 Cr 9,081,050
↓ -931,950 HDFC Bank Ltd (Financial Services)
Equity, Since 30 Nov 21 | HDFCBANK4% ₹1,259 Cr 16,903,300
↑ 2,274,400 Future on HDFC Bank Ltd
Derivatives | -4% -₹1,254 Cr 16,903,300
↑ 16,903,300 Future on Vodafone Idea Ltd
Derivatives | -4% -₹1,206 Cr 853,197,075
↑ 853,197,075 Vodafone Idea Ltd (Communication Services)
Equity, Since 30 Sep 23 | 5328224% ₹1,194 Cr 853,197,075
↓ -1,929,825 Future on Reliance Industries Ltd
Derivatives | -4% -₹1,137 Cr 8,541,500
↑ 8,541,500 Reliance Industries Ltd (Energy)
Equity, Since 31 Aug 18 | RELIANCE3% ₹1,129 Cr 8,541,500
↑ 2,788,000 Future on State Bank of India
Derivatives | -3% -₹961 Cr 9,864,000
↑ 9,864,000 4. HDFC Arbitrage Fund
HDFC Arbitrage Fund
Growth Launch Date 23 Oct 07 NAV (31 Jul 26) ₹32.626 ↑ 0.00 (0.01 %) Net Assets (Cr) ₹23,772 on 30 Jun 26 Category Hybrid - Arbitrage AMC HDFC Asset Management Company Limited Rating ☆☆☆ Risk Moderately Low Expense Ratio 0.97 Sharpe Ratio 0.36 Information Ratio 0 Alpha Ratio 0 Min Investment 100,000 Min SIP Investment 300 Exit Load 0-1 Months (0.25%),1 Months and above(NIL) Growth of 10,000 investment over the years.
Date Value 31 Jul 21 ₹10,000 31 Jul 22 ₹10,301 31 Jul 23 ₹10,964 31 Jul 24 ₹11,823 31 Jul 25 ₹12,639 Returns for HDFC Arbitrage Fund
absolute basis & more than 1 year are on CAGR (Compound Annual Growth Rate) basis. as on 31 Jul 26 Duration Returns 1 Month 0.6% 3 Month 1.6% 6 Month 2.9% 1 Year 6% 3 Year 6.9% 5 Year 6% 10 Year 15 Year Since launch 6.5% Historical performance (Yearly) on absolute basis
Year Returns 2025 6.3% 2024 7.7% 2023 7.2% 2022 4.2% 2021 3.6% 2020 3.7% 2019 6% 2018 5.7% 2017 5.3% 2016 6.6% Fund Manager information for HDFC Arbitrage Fund
Name Since Tenure Anil Bamboli 1 Feb 22 4.41 Yr. Arun Agarwal 24 Aug 20 5.85 Yr. Dhruv Muchhal 22 Jun 23 3.02 Yr. Nandita Menezes 29 Mar 25 1.25 Yr. Data below for HDFC Arbitrage Fund as on 30 Jun 26
Asset Allocation
Asset Class Value Cash 92.8% Debt 7.74% Other 0.05% Equity Sector Allocation
Sector Value Financial Services 23.93% Basic Materials 9.82% Consumer Cyclical 7.47% Energy 6.54% Industrials 6.04% Consumer Defensive 4.02% Communication Services 3.36% Health Care 3.21% Utility 3.01% Real Estate 0.7% Technology 0.68% Debt Sector Allocation
Sector Value Cash Equivalent 78.24% Corporate 18.35% Government 3.94% Credit Quality
Rating Value AAA 100% Top Securities Holdings / Portfolio
Name Holding Value Quantity HDFC Money Market Dir Gr
Investment Fund | -8% ₹2,064 Cr 3,354,179 HDFC Bank Ltd (Financial Services)
Equity, Since 31 Jan 23 | HDFCBANK6% ₹1,553 Cr 20,863,200
↑ 143,600 Hdfc Bank Ltd.
Derivatives | -6% -₹1,547 Cr 20,863,200
↑ 20,863,200 Reliance Industries Ltd.
Derivatives | -4% -₹1,111 Cr 8,355,000
↑ 8,355,000 Reliance Industries Ltd (Energy)
Equity, Since 31 Oct 21 | RELIANCE4% ₹1,104 Cr 8,355,000
↑ 522,000 Icici Bank Ltd.
Derivatives | -4% -₹1,004 Cr 7,896,700
↑ 7,896,700 ICICI Bank Ltd (Financial Services)
Equity, Since 30 Jun 24 | ICICIBANK4% ₹992 Cr 7,896,700
↑ 1,415,400 HDFC Liquid Dir Gr
Investment Fund | -4% ₹933 Cr 1,704,922 Bharti Airtel Ltd.
Derivatives | -2% -₹616 Cr 3,339,250
↑ 3,339,250 Jsw Steel Ltd.
Derivatives | -2% -₹613 Cr 4,739,175
↑ 4,739,175 5. UTI Arbitrage Fund
UTI Arbitrage Fund
Growth Launch Date 22 Jun 06 NAV (31 Jul 26) ₹37.3256 ↑ 0.01 (0.02 %) Net Assets (Cr) ₹11,324 on 30 Jun 26 Category Hybrid - Arbitrage AMC UTI Asset Management Company Ltd Rating ☆☆☆ Risk Moderately Low Expense Ratio 0.78 Sharpe Ratio 0.34 Information Ratio 0 Alpha Ratio 0 Min Investment 5,000 Min SIP Investment 500 Exit Load 0-30 Days (0.5%),30 Days and above(NIL) Growth of 10,000 investment over the years.
Date Value 31 Jul 21 ₹10,000 31 Jul 22 ₹10,313 31 Jul 23 ₹10,961 31 Jul 24 ₹11,822 31 Jul 25 ₹12,658 Returns for UTI Arbitrage Fund
absolute basis & more than 1 year are on CAGR (Compound Annual Growth Rate) basis. as on 31 Jul 26 Duration Returns 1 Month 0.6% 3 Month 1.5% 6 Month 2.9% 1 Year 6% 3 Year 7% 5 Year 6% 10 Year 15 Year Since launch 6.8% Historical performance (Yearly) on absolute basis
Year Returns 2025 6.5% 2024 7.7% 2023 7.2% 2022 4% 2021 3.9% 2020 4.4% 2019 6.2% 2018 6.2% 2017 5.7% 2016 6.5% Fund Manager information for UTI Arbitrage Fund
Name Since Tenure Amit Sharma 2 Jul 18 8 Yr. Sharwan Kumar Goyal 1 Jan 21 5.5 Yr. Data below for UTI Arbitrage Fund as on 30 Jun 26
Asset Allocation
Asset Class Value Cash 96.72% Debt 3.81% Other 0.06% Equity Sector Allocation
Sector Value Financial Services 30.95% Basic Materials 8.08% Consumer Cyclical 6.66% Health Care 5.43% Communication Services 5.25% Industrials 4.66% Energy 3.41% Consumer Defensive 3.2% Real Estate 1.2% Technology 0.76% Utility 0.71% Debt Sector Allocation
Sector Value Cash Equivalent 79.24% Corporate 17.66% Government 3.64% Credit Quality
Rating Value AAA 99.96% Top Securities Holdings / Portfolio
Name Holding Value Quantity UTI Money Market Dir Gr
Investment Fund | -15% ₹1,660 Cr 5,038,839
↑ 608,752 Future on ICICI Bank Ltd
Derivatives | -5% -₹590 Cr 4,645,900
↑ 4,645,900 ICICI Bank Ltd (Financial Services)
Equity, Since 30 Sep 24 | ICICIBANK5% ₹584 Cr 4,645,900
↑ 1,540,700 HDFC Bank Ltd (Financial Services)
Equity, Since 30 Apr 22 | HDFCBANK5% ₹541 Cr 7,260,650
↓ -371,150 Future on HDFC Bank Ltd
Derivatives | -5% -₹539 Cr 7,260,650
↑ 7,260,650 Future on Reliance Industries Ltd
Derivatives | -3% -₹336 Cr 2,522,500
↑ 2,522,500 Reliance Industries Ltd (Energy)
Equity, Since 31 Aug 23 | RELIANCE3% ₹333 Cr 2,522,500
↑ 343,500 Future on Steel Authority Of India Ltd
Derivatives | -3% -₹295 Cr 14,273,900
↑ 14,273,900 Steel Authority Of India Ltd (Basic Materials)
Equity, Since 31 May 23 | SAIL3% ₹292 Cr 14,273,900
↑ 1,057,500 Future on Bharti Airtel Ltd
Derivatives | -3% -₹287 Cr 1,557,050
↑ 1,557,050 6. SBI Arbitrage Opportunities Fund
SBI Arbitrage Opportunities Fund
Growth Launch Date 3 Nov 06 NAV (31 Jul 26) ₹36.0104 ↑ 0.00 (0.01 %) Net Assets (Cr) ₹45,923 on 30 Jun 26 Category Hybrid - Arbitrage AMC SBI Funds Management Private Limited Rating ☆☆ Risk Moderately Low Expense Ratio 0.95 Sharpe Ratio 0.33 Information Ratio 0 Alpha Ratio 0 Min Investment 5,000 Min SIP Investment 500 Exit Load 0-1 Months (0.5%),1 Months and above(NIL) Growth of 10,000 investment over the years.
Date Value 31 Jul 21 ₹10,000 31 Jul 22 ₹10,371 31 Jul 23 ₹11,080 31 Jul 24 ₹11,942 31 Jul 25 ₹12,781 Returns for SBI Arbitrage Opportunities Fund
absolute basis & more than 1 year are on CAGR (Compound Annual Growth Rate) basis. as on 31 Jul 26 Duration Returns 1 Month 0.6% 3 Month 1.5% 6 Month 2.9% 1 Year 5.9% 3 Year 6.9% 5 Year 6.2% 10 Year 15 Year Since launch 6.7% Historical performance (Yearly) on absolute basis
Year Returns 2025 6.5% 2024 7.5% 2023 7.4% 2022 4.6% 2021 4% 2020 3.5% 2019 6% 2018 6.2% 2017 5.3% 2016 6.4% Fund Manager information for SBI Arbitrage Opportunities Fund
Name Since Tenure Neeraj Kumar 5 Oct 12 13.74 Yr. Ardhendu Bhattacharya 27 Dec 24 1.51 Yr. Data below for SBI Arbitrage Opportunities Fund as on 30 Jun 26
Asset Allocation
Asset Class Value Cash 98.64% Debt 1.84% Other 0.05% Equity Sector Allocation
Sector Value Financial Services 30.08% Basic Materials 8.13% Industrials 7.69% Consumer Cyclical 5.81% Energy 5.26% Communication Services 4.2% Utility 3.85% Consumer Defensive 3.81% Health Care 3.65% Real Estate 1.67% Technology 0.79% Debt Sector Allocation
Sector Value Cash Equivalent 87.8% Corporate 10.39% Government 2.29% Credit Quality
Rating Value AA 1.87% AAA 98.13% Top Securities Holdings / Portfolio
Name Holding Value Quantity SBI Liquid Dir Gr
Investment Fund | -8% ₹3,665 Cr 8,413,178
↑ 2,746,616 SBI Savings Dir Gr
Investment Fund | -8% ₹3,407 Cr 726,722,883 HDFC Bank Ltd (Financial Services)
Equity, Since 30 Apr 22 | HDFCBANK6% ₹2,463 Cr 33,079,600
↑ 3,964,250 Future on HDFC Bank Ltd
Derivatives | -6% -₹2,454 Cr 33,079,600
↑ 33,079,600 Future on ICICI Bank Ltd
Derivatives | -5% -₹2,372 Cr 18,673,900
↑ 18,673,900 ICICI Bank Ltd (Financial Services)
Equity, Since 30 Jun 21 | ICICIBANK5% ₹2,346 Cr 18,673,900
↑ 5,756,100 Future on State Bank of India
Derivatives | -3% -₹1,368 Cr 14,047,500
↑ 14,047,500 State Bank of India (Financial Services)
Equity, Since 31 May 23 | SBIN3% ₹1,355 Cr 14,047,500
↑ 650,250 Future on Reliance Industries Ltd
Derivatives | -3% -₹1,090 Cr 8,193,000
↑ 8,193,000 Reliance Industries Ltd (Energy)
Equity, Since 30 Nov 21 | RELIANCE3% ₹1,082 Cr 8,193,000
↑ 2,581,000 7. Nippon India Arbitrage Fund
Nippon India Arbitrage Fund
Growth Launch Date 14 Oct 10 NAV (31 Jul 26) ₹28.2414 ↑ 0.01 (0.02 %) Net Assets (Cr) ₹16,638 on 30 Jun 26 Category Hybrid - Arbitrage AMC Nippon Life Asset Management Ltd. Rating ☆☆☆☆ Risk Moderately Low Expense Ratio 1.07 Sharpe Ratio 0.22 Information Ratio 0 Alpha Ratio 0 Min Investment 5,000 Min SIP Investment 100 Exit Load 0-1 Months (0.25%),1 Months and above(NIL) Growth of 10,000 investment over the years.
Date Value 31 Jul 21 ₹10,000 31 Jul 22 ₹10,327 31 Jul 23 ₹10,974 31 Jul 24 ₹11,817 31 Jul 25 ₹12,607 Returns for Nippon India Arbitrage Fund
absolute basis & more than 1 year are on CAGR (Compound Annual Growth Rate) basis. as on 31 Jul 26 Duration Returns 1 Month 0.6% 3 Month 1.6% 6 Month 2.9% 1 Year 5.9% 3 Year 6.8% 5 Year 5.9% 10 Year 15 Year Since launch 6.8% Historical performance (Yearly) on absolute basis
Year Returns 2025 6.2% 2024 7.5% 2023 7% 2022 4.2% 2021 3.8% 2020 4.3% 2019 6.2% 2018 6.8% 2017 5.5% 2016 6.6% Fund Manager information for Nippon India Arbitrage Fund
Name Since Tenure Kinjal Desai 25 May 18 8.1 Yr. Vikash Agarwal 14 Sep 24 1.79 Yr. Nemish Sheth 21 Mar 25 1.28 Yr. Rohit Shah 8 Apr 24 2.23 Yr. Amber Singhania 11 Mar 26 0.3 Yr. Data below for Nippon India Arbitrage Fund as on 30 Jun 26
Asset Allocation
Asset Class Value Equity 140.95% Debt 8.25% Other 0.06% Equity Sector Allocation
Sector Value Financial Services 25.75% Basic Materials 9.28% Consumer Cyclical 7.98% Energy 7.13% Industrials 5.49% Communication Services 4.01% Health Care 3.8% Utility 3.11% Consumer Defensive 2.7% Real Estate 0.79% Technology 0.57% Debt Sector Allocation
Sector Value Corporate 16.46% Government 3.66% Credit Quality
Rating Value AA 36.68% AAA 63.32% Top Securities Holdings / Portfolio
Name Holding Value Quantity Nippon India Money Market Dir Gr
Investment Fund | -15% ₹2,441 Cr 5,504,465
↑ 451,140 Nippon India U/ST Duration Dir Gr
Investment Fund | -7% ₹1,193 Cr 2,533,969
↑ 425,422 HDFC Bank Ltd (Financial Services)
Equity, Since 31 Jan 23 | HDFCBANK6% ₹952 Cr 12,786,150
↑ 1,419,400 Future on HDFC Bank Ltd Cedear
Derivatives, Since 31 May 26 | -6% ₹948 Cr 12,786,150
↑ 12,786,150 Future on Reliance Industries Ltd
Derivatives, Since 31 May 26 | -5% ₹754 Cr 5,666,000
↑ 5,666,000 Reliance Industries Ltd (Energy)
Equity, Since 31 Dec 17 | RELIANCE5% ₹749 Cr 5,666,000
↑ 2,751,500 Future on ICICI Bank Ltd
Derivatives, Since 31 May 26 | -4% ₹581 Cr 4,571,700
↑ 4,571,700 ICICI Bank Ltd (Financial Services)
Equity, Since 31 Oct 24 | ICICIBANK4% ₹574 Cr 4,571,700
↑ 1,042,300 Future on Axis Bank Ltd
Derivatives, Since 31 May 26 | -2% ₹394 Cr 3,031,875
↑ 3,031,875 Axis Bank Ltd (Financial Services)
Equity, Since 31 Jul 23 | AXISBANK2% ₹390 Cr 3,031,875
↑ 262,500
ایک سرمایہ کار کے طور پر غور کرنے کی چیزیں
1. خطرہ
چونکہ سٹاک ایکسچینج میں تجارت ہوتی ہے، اس لیے ان فنڈز میں کوئی بھی فریق مخالف خطرہ نہیں ہوتا۔ اگرچہ فنڈ مینیجر نقد اور فیوچر مارکیٹ میں حصص کی خرید و فروخت کر رہا ہے، لیکن ایکویٹی میں کوئی خطرہ نہیں ہے جیسا کہ دیگر متنوع ایکویٹی میوچل فنڈز کا معاملہ ہے۔ اگرچہ سواری ہموار لگ رہی ہے، ان فنڈز کے ساتھ زیادہ آرام دہ نہ ہوں۔ جیسے جیسے زیادہ لوگ ثالثی فنڈز میں تجارت شروع کرتے ہیں، ثالثی کے زیادہ مواقع دستیاب نہیں ہوں گے۔ نقد اور مستقبل کی مارکیٹ کی قیمتوں کے درمیان پھیلاؤ کم ہو جائے گا، جس سے ثالثی پر توجہ مرکوز کرنے والے سرمایہ کاروں کے لیے بہت کم رہ جائے گا۔
2. واپسی
ثالثی فنڈز ان لوگوں کے لیے معقول منافع کمانے کا ایک اچھا موقع ہو سکتا ہے جو اسے سمجھ سکتے ہیں اور پھر اس سے زیادہ سے زیادہ فائدہ اٹھا سکتے ہیں۔ فنڈ مینیجر ایک پیدا کرنے کی کوشش کرتا ہے۔الفا مارکیٹوں میں قیمت کے فرق کا استعمال کرتے ہوئے. تاریخی طور پر، ثالثی فنڈز میں ریٹرن دینے کے لیے پائے گئے ہیں۔رینج 5-10 سال کی مدت میں 7%-8%۔ اگر آپ کسی ایسے پورٹ فولیو کے ذریعے اعتدال پسند منافع کمانے کے خواہاں ہیں جس میں ایک غیر مستحکم مارکیٹ میں قرض اور ایکویٹی کا بہترین امتزاج ہے، تو ثالثی فنڈز آپ کی چیز ہو سکتی ہے۔ تاہم، آپ کو ایک بات ذہن میں رکھنے کی ضرورت ہے کہ ثالثی فنڈز میں کوئی ضمانت شدہ واپسی نہیں ہے۔
3. لاگت
ثالثی فنڈز کا جائزہ لیتے وقت لاگت ایک اہم غور و فکر بن جاتی ہے۔ یہ فنڈز ایک سالانہ فیس وصول کرتے ہیں جسے اخراجات کا تناسب کہا جاتا ہے جسے فنڈ کے اثاثوں کے فیصد کے طور پر ظاہر کیا جاتا ہے۔ اس میں فنڈ مینیجر کی فیس اور فنڈ مینجمنٹ چارجز شامل ہیں۔ متواتر ٹریڈنگ کی وجہ سے، ثالثی فنڈز لین دین کے بھاری اخراجات اٹھائیں گے اور اس کا ٹرن اوور کا تناسب بہت زیادہ ہے۔ مزید برآں، فنڈ 30 سے 60 دنوں کی مدت کے لیے ایگزٹ بوجھ لگا سکتا ہے تاکہ سرمایہ کاروں کو جلد باہر نکلنے سے روکا جا سکے۔ یہ تمام اخراجات فنڈ کے اخراجات کے تناسب میں اضافے کا باعث بن سکتے ہیں۔ اعلی اخراجات کا تناسب آپ کے گھر لے جانے کی واپسی پر نیچے کی طرف دباؤ ڈالتا ہے۔
4. سرمایہ کاری افق
ثالثی فنڈز ان سرمایہ کاروں کے لیے موزوں ہو سکتے ہیں جن کے پاس 3 سے 5 سال کی مختصر سے درمیانی مدت کا افق ہو۔ چونکہ یہ فنڈز ایگزٹ بوجھ وصول کرتے ہیں، آپ ان پر صرف اس وقت غور کر سکتے ہیں جب آپ کم از کم 3-6 ماہ کی مدت تک سرمایہ کاری کرنے کے لیے تیار ہوں۔ ایک ہی وقت میں، آپ کو یہ سمجھنے کی ضرورت ہے کہ فنڈ کی واپسی بہت زیادہ اتار چڑھاؤ کے وجود پر منحصر ہے۔ لہذا، یکمشت سرمایہ کاری کا انتخاب کرنا معنی خیز ہوگا۔منظم سرمایہ کاری کا منصوبہ (SIPs)۔ اتار چڑھاؤ کی غیر موجودگی میں، مائع فنڈز اسی سرمایہ کاری کے افق پر ثالثی فنڈز سے بہتر منافع دے سکتے ہیں۔ لہذا، آپ کو ثالثی فنڈز کا انتخاب کرتے وقت مارکیٹ کے مجموعی منظر نامے کو ذہن میں رکھنے کی ضرورت ہے۔
5. مالی اہداف
اگر آپ کے پاس مختصر سے درمیانی مدت ہے۔مالی اہداف، پھر ثالثی فنڈز آپ کی چیز ہیں۔ ریگولر سیونگ بینک اکاؤنٹ کے بجائے، آپ ایمرجنسی فنڈ بنانے اور ان پر زیادہ منافع حاصل کرنے کے لیے اضافی فنڈز کو پارک کرنے کے لیے ان فنڈز کا استعمال کر سکتے ہیں۔ اگر آپ نے پہلے ہی خطرے والے ہیونس ایکویٹی فنڈز میں سرمایہ کاری کی ہے، تو آپ ایک شروع کر سکتے ہیں۔منظم منتقلی کا منصوبہ (STP) ایکویٹی فنڈز سے کم خطرناک پناہ گاہ جیسے ثالثی فنڈز تک جب آپ مالی ہدف کی تکمیل کے قریب پہنچتے ہیں۔ یہ آپ کے پورٹ فولیو کو مجموعی طور پر کم کر دے گا۔رسک پروفائل لیکن ایک ہی وقت میں واپسی کو بھی کم. آپ ثالثی فنڈز میں دوہرے ہندسے کے منافع حاصل کرنے کی توقع نہیں کر سکتے۔
آربٹریج فنڈز میں آن لائن سرمایہ کاری کیسے کی جائے؟
Fincash.com پر لائف ٹائم کے لیے مفت انویسٹمنٹ اکاؤنٹ کھولیں۔
اپنی رجسٹریشن اور KYC کا عمل مکمل کریں۔
دستاویزات اپ لوڈ کریں (PAN، آدھار، وغیرہ)۔اور، آپ سرمایہ کاری کے لیے تیار ہیں!
یہاں فراہم کردہ معلومات کے درست ہونے کو یقینی بنانے کے لیے تمام کوششیں کی گئی ہیں۔ تاہم، ڈیٹا کی درستگی کے حوالے سے کوئی ضمانت نہیں دی جاتی ہے۔ براہ کرم کوئی بھی سرمایہ کاری کرنے سے پہلے اسکیم کی معلومات کے دستاویز کے ساتھ تصدیق کریں۔
You Might Also Like


AMFI Registration No. 112358 | CIN: U74999MH2016PTC282153
Shepard Technologies Pvt. Ltd. (with ARN code 112358) makes no warranties or representations, express or implied, on products offered through the platform. It accepts no liability for any damages or losses, however caused, in connection with the use of, or on the reliance of its product or related services. Terms and conditions of the website are applicable.
©2026 Shepard Technologies Private Limited. All Rights Reserved
Research Highlights for Invesco India Arbitrage Fund