8 بہترین بین الاقوامی میوچل فنڈز 2022
بین اقوامیباہمی چندہ وہ فنڈز ہیں جو غیر ملکی منڈیوں میں سرمایہ کاری کرتے ہیں سوائے اس کےسرمایہ کاررہائش کا ملک۔ دوسری جانب،عالمی فنڈ غیر ملکی منڈیوں کے ساتھ ساتھ سرمایہ کار کے رہائشی ملک میں سرمایہ کاری کریں۔ بین الاقوامی میوچل فنڈز کو "غیر ملکی فنڈ" کے نام سے بھی جانا جاتا ہے اور یہ 'فنڈز کا فنڈ' حکمت عملی.
بین الاقوامی میوچل فنڈز گزشتہ چند سالوں میں غیر مستحکم مقامی منڈیوں کی وجہ سے سرمایہ کاروں کے لیے سرمایہ کاری کا ایک پرکشش اختیار بن گیا ہے۔معیشت اس کے اتار چڑھاؤ سے گزرنا۔
ہندوستان میں بین الاقوامی میوچل فنڈز کا پس منظر
ریزرو کی اجازت سےبینک ہندوستان (RBI) کے، بین الاقوامی میوچل فنڈز ہندوستان میں 2007 میں کھولے گئے۔ ہر فنڈ کو USD 500 ملین کا کارپس حاصل کرنے کی اجازت ہے۔
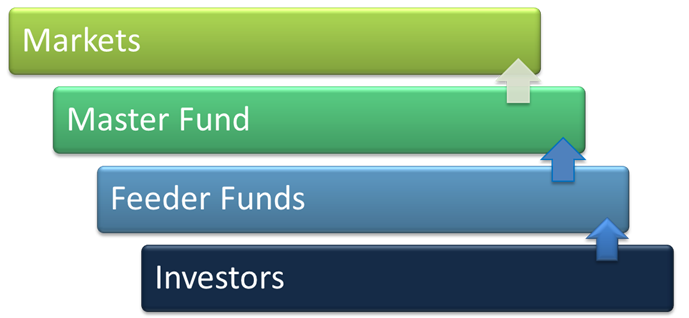
بین الاقوامی میوچل فنڈز کا ماسٹر فیڈر ڈھانچہ
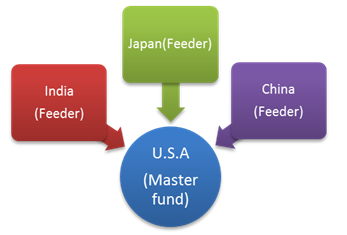
بین الاقوامی میوچل فنڈز ماسٹر فیڈر ڈھانچے کی پیروی کرتے ہیں۔ ایک ماسٹر فیڈر ڈھانچہ ایک تین درجے کا ڈھانچہ ہے جہاں سرمایہ کار اپنا پیسہ فیڈر فنڈ میں ڈالتے ہیں جو پھر ماسٹر فنڈ میں سرمایہ کاری کرتا ہے۔ ماسٹر فنڈ اس کے بعد رقم کو سرمایہ کاری میں لگاتا ہے۔مارکیٹ. ایک فیڈر فنڈ ساحل پر مبنی ہوتا ہے یعنی ہندوستان میں، جب کہ ماسٹر فنڈ آف شور پر مبنی ہوتا ہے (غیر ملکی جغرافیہ جیسے لکسمبرگ وغیرہ میں)۔
ایک ماسٹر فنڈ میں متعدد فیڈر فنڈز ہوسکتے ہیں۔ مثال کے طور پر،
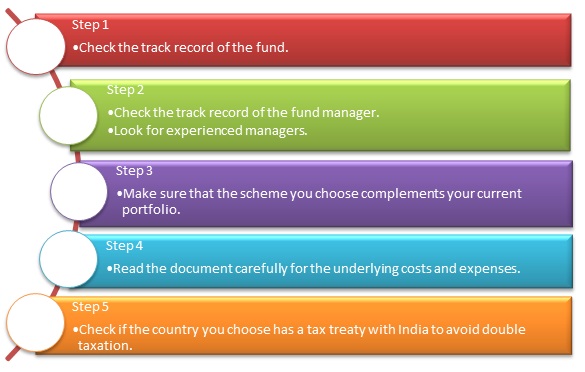
بین الاقوامی میوچل فنڈ کا انتخاب کیسے کریں؟
مناسب فنڈ کا انتخاب کرتے وقت کچھ چیزوں کو ذہن میں رکھنا ضروری ہے۔
مالی سال 22 - 23 میں سرمایہ کاری کے لیے بہترین بین الاقوامی میوچل فنڈز
The primary investment objective of the Scheme is to seek capital appreciation by investing predominantly in the units of BlackRock Global Funds – World Mining Fund. The Scheme may, at the discretion of the Investment Manager, also invest in the units of other similar overseas mutual fund schemes, which may
constitute a significant part of its corpus. The Scheme may also invest a certain portion of its corpus in money market securities and/or money market/liquid schemes of DSP BlackRock Mutual Fund, in order to meet liquidity requirements from time to time. Research Highlights for DSP World Mining Fund Below is the key information for DSP World Mining Fund Returns up to 1 year are on "The primary investment objective of the Scheme is to seek capital appreciation by investing predominantly in units of MLIIF - WGF. The Scheme may, at the discretion of the Investment Manager, also invest in the units of other similar overseas mutual fund schemes, which may constitute a significant part of its corpus. The Scheme may also invest a certain portion of its corpus in money market securities and/or units of money market/liquid schemes of DSP Merrill Lynch Mutual Fund, in order to meet liquidity requirements from time to time. However, there is no assurance that the investment objective of the Scheme will be realized." Research Highlights for DSP World Gold Fund Below is the key information for DSP World Gold Fund Returns up to 1 year are on The primary investment objective of the Scheme is to seek to provide long term capital growth by investing predominantly in the JPMorgan Funds - Emerging Markets Opportunities Fund, an equity fund which invests primarily in an aggressively managed portfolio of emerging market companies Research Highlights for Edelweiss Emerging Markets Opportunities Equity Off-shore Fund Below is the key information for Edelweiss Emerging Markets Opportunities Equity Off-shore Fund Returns up to 1 year are on The investment objective of the scheme is to provide long-term capital appreciation by investing in an overseas mutual fund scheme that invests in a diversified portfolio of securities as prescribed by SEBI from time to time in global emerging markets. Research Highlights for Kotak Global Emerging Market Fund Below is the key information for Kotak Global Emerging Market Fund Returns up to 1 year are on (Erstwhile Invesco India Pan European Equity Fund) To generate capital appreciation by investing predominantly in units of Invesco Pan European Equity Fund, an overseas equity fund which invests primarily in equity securities of European companies with an emphasis on larger companies.
The Scheme may, at the discretion of Fund Manager, also invest in units of
other similar Overseas Mutual Funds with similar objectives, strategy and
attributes which may constitute a significant portion of its net assets. Research Highlights for Invesco India Feeder- Invesco Pan European Equity Fund Below is the key information for Invesco India Feeder- Invesco Pan European Equity Fund Returns up to 1 year are on The primary investment objective of the Scheme is to seek capital appreciation by investing predominantly in the units of BlackRock Global Funds – World Energy Fund and BlackRock Global Funds – New Energy Fund. The Scheme may, at the discretion of the Investment Manager, also invest in the units of other similar overseas mutual fund schemes, which may constitute a significant part of its corpus. The Scheme may also invest a certain portion of its corpus in money market securities
and/or money market/liquid schemes of DSP BlackRock Mutual Fund, in order to meet liquidity
requirements from time to time. Research Highlights for DSP World Energy Fund Below is the key information for DSP World Energy Fund Returns up to 1 year are on The primary investment objective of the Scheme is to seek capital appreciation by investing predominantly in units of BGF – USFEF. The Scheme may, at the discretion of the Investment Manager also invest in the units of other similar overseas mutual fund schemes, which may constitute a significant part of its corpus. The Scheme may also invest a certain portion of its corpus in money market securities and/or money market/liquid schemes of DSP BlackRock Mutual Fund, in order to meet liquidity requirements from time to time. However, there is no assurance that the investment objective of the Scheme will be realized. It shall be noted ‘similar overseas mutual fund schemes’ shall have investment objective, investment strategy and risk profile/consideration similar to those of BGF – USFEF. Research Highlights for DSP US Flexible Equity Fund Below is the key information for DSP US Flexible Equity Fund Returns up to 1 year are on An open-end diversified equity fund that seeks to provide medium to long term appreciation through investments primarily in Asian Companies / sectors (excluding Japan) with long term potential across market capitalisation. Research Highlights for Franklin Asian Equity Fund Below is the key information for Franklin Asian Equity Fund Returns up to 1 year are on Fund NAV Net Assets (Cr) Min SIP Investment 3 MO (%) 6 MO (%) 1 YR (%) 3 YR (%) 5 YR (%) 2025 (%) DSP World Mining Fund Growth ₹29.8397
↑ 0.06 ₹164 500 -5.4 -12.8 65.3 22 14.3 79 DSP World Gold Fund Growth ₹48.7996
↓ -0.41 ₹1,433 500 -14.1 -28.9 57.5 42.1 21.4 167.1 Edelweiss Emerging Markets Opportunities Equity Off-shore Fund Growth ₹26.2862
↓ -0.34 ₹259 1,000 -1.6 8.9 49 22.1 9.1 41.1 Kotak Global Emerging Market Fund Growth ₹36.373
↓ -0.51 ₹1,767 1,000 -3.2 3.5 38.4 20.5 9.8 39.1 Invesco India Feeder- Invesco Pan European Equity Fund Growth ₹26.678
↑ 0.31 ₹219 500 8.1 9.8 36.1 19 14.9 42.5 DSP World Energy Fund Growth ₹27.6399
↓ -0.28 ₹117 500 -6.1 5.3 36 14.2 11.3 39.2 DSP US Flexible Equity Fund Growth ₹89.2508
↑ 0.15 ₹1,291 500 1.4 10.4 35.9 24.3 17 33.8 Franklin Asian Equity Fund Growth ₹41.9857
↓ -0.10 ₹979 500 4.1 8.6 31.9 16.6 7 23.7 Note: Returns up to 1 year are on absolute basis & more than 1 year are on CAGR basis. as on 29 Jul 26 Research Highlights & Commentary of 8 Funds showcased
Commentary DSP World Mining Fund DSP World Gold Fund Edelweiss Emerging Markets Opportunities Equity Off-shore Fund Kotak Global Emerging Market Fund Invesco India Feeder- Invesco Pan European Equity Fund DSP World Energy Fund DSP US Flexible Equity Fund Franklin Asian Equity Fund Point 1 Bottom quartile AUM (₹164 Cr). Top quartile AUM (₹1,433 Cr). Lower mid AUM (₹259 Cr). Highest AUM (₹1,767 Cr). Lower mid AUM (₹219 Cr). Bottom quartile AUM (₹117 Cr). Upper mid AUM (₹1,291 Cr). Upper mid AUM (₹979 Cr). Point 2 Established history (16+ yrs). Oldest track record among peers (18 yrs). Established history (12+ yrs). Established history (18+ yrs). Established history (12+ yrs). Established history (16+ yrs). Established history (14+ yrs). Established history (18+ yrs). Point 3 Rating: 3★ (upper mid). Rating: 3★ (upper mid). Rating: 3★ (lower mid). Rating: 3★ (lower mid). Rating: 3★ (bottom quartile). Rating: 2★ (bottom quartile). Top rated. Rating: 5★ (top quartile). Point 4 Risk profile: High. Risk profile: High. Risk profile: High. Risk profile: High. Risk profile: High. Risk profile: High. Risk profile: High. Risk profile: High. Point 5 5Y return: 14.30% (upper mid). 5Y return: 21.36% (top quartile). 5Y return: 9.08% (bottom quartile). 5Y return: 9.81% (lower mid). 5Y return: 14.91% (upper mid). 5Y return: 11.30% (lower mid). 5Y return: 16.96% (top quartile). 5Y return: 7.03% (bottom quartile). Point 6 3Y return: 21.97% (upper mid). 3Y return: 42.06% (top quartile). 3Y return: 22.06% (upper mid). 3Y return: 20.46% (lower mid). 3Y return: 19.05% (lower mid). 3Y return: 14.24% (bottom quartile). 3Y return: 24.25% (top quartile). 3Y return: 16.63% (bottom quartile). Point 7 1Y return: 65.29% (top quartile). 1Y return: 57.48% (top quartile). 1Y return: 49.01% (upper mid). 1Y return: 38.45% (upper mid). 1Y return: 36.11% (lower mid). 1Y return: 36.01% (lower mid). 1Y return: 35.93% (bottom quartile). 1Y return: 31.89% (bottom quartile). Point 8 Alpha: 0.00 (upper mid). Alpha: 2.12 (top quartile). Alpha: 6.30 (top quartile). Alpha: -1.76 (bottom quartile). Alpha: 0.00 (upper mid). Alpha: 0.00 (lower mid). Alpha: -4.10 (bottom quartile). Alpha: 0.00 (lower mid). Point 9 Sharpe: 1.74 (lower mid). Sharpe: 1.22 (bottom quartile). Sharpe: 2.20 (top quartile). Sharpe: 1.88 (upper mid). Sharpe: 1.61 (lower mid). Sharpe: 2.76 (top quartile). Sharpe: 1.93 (upper mid). Sharpe: 1.54 (bottom quartile). Point 10 Information ratio: 0.00 (top quartile). Information ratio: -0.50 (bottom quartile). Information ratio: -0.41 (bottom quartile). Information ratio: -0.25 (lower mid). Information ratio: 0.00 (upper mid). Information ratio: 0.00 (upper mid). Information ratio: 0.15 (top quartile). Information ratio: 0.00 (lower mid). DSP World Mining Fund
DSP World Gold Fund
Edelweiss Emerging Markets Opportunities Equity Off-shore Fund
Kotak Global Emerging Market Fund
Invesco India Feeder- Invesco Pan European Equity Fund
DSP World Energy Fund
DSP US Flexible Equity Fund
Franklin Asian Equity Fund
10 کروڑ زیادہ کی اور پچھلے ایک سال کی واپسی پر ترتیب دی گئی۔1. DSP World Mining Fund
DSP World Mining Fund
Growth Launch Date 29 Dec 09 NAV (29 Jul 26) ₹29.8397 ↑ 0.06 (0.20 %) Net Assets (Cr) ₹164 on 30 Jun 26 Category Equity - Global AMC DSP BlackRock Invmt Managers Pvt. Ltd. Rating ☆☆☆ Risk High Expense Ratio 1.14 Sharpe Ratio 1.74 Information Ratio 0 Alpha Ratio 0 Min Investment 1,000 Min SIP Investment 500 Exit Load 0-12 Months (1%),12 Months and above(NIL) Growth of 10,000 investment over the years.
Date Value 30 Jun 21 ₹10,000 30 Jun 22 ₹9,282 30 Jun 23 ₹10,814 30 Jun 24 ₹11,032 30 Jun 25 ₹11,747 30 Jun 26 ₹20,331 Returns for DSP World Mining Fund
absolute basis & more than 1 year are on CAGR (Compound Annual Growth Rate) basis. as on 29 Jul 26 Duration Returns 1 Month 0.6% 3 Month -5.4% 6 Month -12.8% 1 Year 65.3% 3 Year 22% 5 Year 14.3% 10 Year 15 Year Since launch 6.8% Historical performance (Yearly) on absolute basis
Year Returns 2025 79% 2024 -8.1% 2023 0% 2022 12.2% 2021 18% 2020 34.9% 2019 21.5% 2018 -9.4% 2017 21.1% 2016 49.7% Fund Manager information for DSP World Mining Fund
Name Since Tenure Kaivalya Nadkarni 1 May 25 1.17 Yr. Data below for DSP World Mining Fund as on 30 Jun 26
Equity Sector Allocation
Sector Value Basic Materials 93.17% Energy 1.11% Asset Allocation
Asset Class Value Cash 5.71% Equity 94.28% Debt 0.01% Top Securities Holdings / Portfolio
Name Holding Value Quantity BGF World Mining I2
Investment Fund | -96% ₹180 Cr 141,035 Treps / Reverse Repo Investments
CBLO/Reverse Repo | -4% ₹7 Cr Net Receivables/Payables
Net Current Assets | -0% ₹0 Cr 2. DSP World Gold Fund
DSP World Gold Fund
Growth Launch Date 14 Sep 07 NAV (29 Jul 26) ₹48.7996 ↓ -0.41 (-0.83 %) Net Assets (Cr) ₹1,433 on 30 Jun 26 Category Equity - Global AMC DSP BlackRock Invmt Managers Pvt. Ltd. Rating ☆☆☆ Risk High Expense Ratio 1.41 Sharpe Ratio 1.22 Information Ratio -0.5 Alpha Ratio 2.12 Min Investment 1,000 Min SIP Investment 500 Exit Load 0-12 Months (1%),12 Months and above(NIL) Growth of 10,000 investment over the years.
Date Value 30 Jun 21 ₹10,000 30 Jun 22 ₹8,181 30 Jun 23 ₹9,294 30 Jun 24 ₹10,640 30 Jun 25 ₹16,808 30 Jun 26 ₹27,693 Returns for DSP World Gold Fund
absolute basis & more than 1 year are on CAGR (Compound Annual Growth Rate) basis. as on 29 Jul 26 Duration Returns 1 Month -1.4% 3 Month -14.1% 6 Month -28.9% 1 Year 57.5% 3 Year 42.1% 5 Year 21.4% 10 Year 15 Year Since launch 8.8% Historical performance (Yearly) on absolute basis
Year Returns 2025 167.1% 2024 15.9% 2023 7% 2022 -7.7% 2021 -9% 2020 31.4% 2019 35.1% 2018 -10.7% 2017 -4% 2016 52.7% Fund Manager information for DSP World Gold Fund
Name Since Tenure Kaivalya Nadkarni 1 May 25 1.17 Yr. Data below for DSP World Gold Fund as on 30 Jun 26
Equity Sector Allocation
Sector Value Basic Materials 94.47% Asset Allocation
Asset Class Value Cash 3.62% Equity 94.47% Debt 0% Other 1.91% Top Securities Holdings / Portfolio
Name Holding Value Quantity BGF World Gold I2
Investment Fund | -68% ₹1,141 Cr 1,005,044 VanEck Gold Miners ETF
- | GDX29% ₹490 Cr 573,719 Treps / Reverse Repo Investments
CBLO/Reverse Repo | -3% ₹54 Cr Net Receivables/Payables
Net Current Assets | -0% -₹6 Cr 3. Edelweiss Emerging Markets Opportunities Equity Off-shore Fund
Edelweiss Emerging Markets Opportunities Equity Off-shore Fund
Growth Launch Date 7 Jul 14 NAV (29 Jul 26) ₹26.2862 ↓ -0.34 (-1.28 %) Net Assets (Cr) ₹259 on 30 Jun 26 Category Equity - Global AMC Edelweiss Asset Management Limited Rating ☆☆☆ Risk High Expense Ratio 1.04 Sharpe Ratio 2.2 Information Ratio -0.41 Alpha Ratio 6.3 Min Investment 5,000 Min SIP Investment 1,000 Exit Load 0-1 Years (1%),1 Years and above(NIL) Growth of 10,000 investment over the years.
Date Value 30 Jun 21 ₹10,000 30 Jun 22 ₹7,234 30 Jun 23 ₹7,605 30 Jun 24 ₹8,447 30 Jun 25 ₹9,445 30 Jun 26 ₹15,783 Returns for Edelweiss Emerging Markets Opportunities Equity Off-shore Fund
absolute basis & more than 1 year are on CAGR (Compound Annual Growth Rate) basis. as on 29 Jul 26 Duration Returns 1 Month -6.8% 3 Month -1.6% 6 Month 8.9% 1 Year 49% 3 Year 22.1% 5 Year 9.1% 10 Year 15 Year Since launch 8.3% Historical performance (Yearly) on absolute basis
Year Returns 2025 41.1% 2024 5.9% 2023 5.5% 2022 -16.8% 2021 -5.9% 2020 21.7% 2019 25.1% 2018 -7.2% 2017 30% 2016 9.8% Fund Manager information for Edelweiss Emerging Markets Opportunities Equity Off-shore Fund
Name Since Tenure Bhavesh Jain 9 Apr 18 8.23 Yr. Bharat Lahoti 1 Oct 21 4.75 Yr. Data below for Edelweiss Emerging Markets Opportunities Equity Off-shore Fund as on 30 Jun 26
Equity Sector Allocation
Sector Value Technology 35.88% Financial Services 20.6% Consumer Cyclical 10.01% Communication Services 7.79% Industrials 5.82% Energy 5.13% Basic Materials 2.8% Consumer Defensive 1.98% Utility 1.27% Health Care 0.52% Asset Allocation
Asset Class Value Cash 6.04% Equity 93.14% Debt 0.01% Other 0.49% Top Securities Holdings / Portfolio
Name Holding Value Quantity JPM Emerging Mkts Opps I acc USD
Investment Fund | -96% ₹241 Cr 102,137
↑ 3,897 Clearing Corporation Of India Ltd.
CBLO/Reverse Repo | -4% ₹10 Cr Net Receivables/(Payables)
CBLO | -0% -₹1 Cr Accrued Interest
CBLO | -0% ₹0 Cr 4. Kotak Global Emerging Market Fund
Kotak Global Emerging Market Fund
Growth Launch Date 26 Sep 07 NAV (29 Jul 26) ₹36.373 ↓ -0.51 (-1.39 %) Net Assets (Cr) ₹1,767 on 30 Jun 26 Category Equity - Global AMC Kotak Mahindra Asset Management Co Ltd Rating ☆☆☆ Risk High Expense Ratio 1.64 Sharpe Ratio 1.88 Information Ratio -0.25 Alpha Ratio -1.76 Min Investment 5,000 Min SIP Investment 1,000 Exit Load 0-1 Years (1%),1 Years and above(NIL) Growth of 10,000 investment over the years.
Date Value 30 Jun 21 ₹10,000 30 Jun 22 ₹7,904 30 Jun 23 ₹8,130 30 Jun 24 ₹9,267 30 Jun 25 ₹10,468 30 Jun 26 ₹16,878 Returns for Kotak Global Emerging Market Fund
absolute basis & more than 1 year are on CAGR (Compound Annual Growth Rate) basis. as on 29 Jul 26 Duration Returns 1 Month -9.2% 3 Month -3.2% 6 Month 3.5% 1 Year 38.4% 3 Year 20.5% 5 Year 9.8% 10 Year 15 Year Since launch 7.1% Historical performance (Yearly) on absolute basis
Year Returns 2025 39.1% 2024 5.9% 2023 10.8% 2022 -15% 2021 -0.5% 2020 29.1% 2019 21.4% 2018 -14.4% 2017 30.4% 2016 -1.2% Fund Manager information for Kotak Global Emerging Market Fund
Name Since Tenure Arjun Khanna 9 May 19 7.15 Yr. Data below for Kotak Global Emerging Market Fund as on 30 Jun 26
Equity Sector Allocation
Sector Value Technology 43.42% Financial Services 19.61% Industrials 8.58% Consumer Cyclical 8.12% Basic Materials 6.67% Communication Services 5.05% Energy 4.51% Health Care 0.71% Asset Allocation
Asset Class Value Cash 3.32% Equity 96.68% Top Securities Holdings / Portfolio
Name Holding Value Quantity CI Emerging Markets Class A
Investment Fund | -98% ₹1,762 Cr 4,589,366
↑ 100,988 Triparty Repo
CBLO/Reverse Repo | -2% ₹33 Cr Net Current Assets/(Liabilities)
Net Current Assets | -0% -₹2 Cr 5. Invesco India Feeder- Invesco Pan European Equity Fund
Invesco India Feeder- Invesco Pan European Equity Fund
Growth Launch Date 31 Jan 14 NAV (30 Jul 26) ₹26.678 ↑ 0.31 (1.18 %) Net Assets (Cr) ₹219 on 30 Jun 26 Category Equity - Global AMC Invesco Asset Management (India) Private Ltd Rating ☆☆☆ Risk High Expense Ratio 0.95 Sharpe Ratio 1.61 Information Ratio 0 Alpha Ratio 0 Min Investment 5,000 Min SIP Investment 500 Exit Load 0-1 Years (1%),1 Years and above(NIL) Growth of 10,000 investment over the years.
Date Value 30 Jun 21 ₹10,000 30 Jun 22 ₹8,770 30 Jun 23 ₹11,534 30 Jun 24 ₹12,354 30 Jun 25 ₹14,687 30 Jun 26 ₹19,766 Returns for Invesco India Feeder- Invesco Pan European Equity Fund
absolute basis & more than 1 year are on CAGR (Compound Annual Growth Rate) basis. as on 29 Jul 26 Duration Returns 1 Month 2.6% 3 Month 8.1% 6 Month 9.8% 1 Year 36.1% 3 Year 19% 5 Year 14.9% 10 Year 15 Year Since launch 8.2% Historical performance (Yearly) on absolute basis
Year Returns 2025 42.5% 2024 -5.1% 2023 20.5% 2022 1.6% 2021 16.6% 2020 1.6% 2019 17.2% 2018 -11.2% 2017 14.8% 2016 -0.2% Fund Manager information for Invesco India Feeder- Invesco Pan European Equity Fund
Name Since Tenure Sagar Gandhi 1 Mar 25 1.33 Yr. Data below for Invesco India Feeder- Invesco Pan European Equity Fund as on 30 Jun 26
Equity Sector Allocation
Sector Value Industrials 24.69% Financial Services 20.7% Technology 9.93% Health Care 7.76% Consumer Defensive 7.69% Basic Materials 6.95% Energy 6.06% Utility 4.4% Consumer Cyclical 3.34% Communication Services 3.11% Asset Allocation
Asset Class Value Cash 5.32% Equity 94.64% Debt 0.04% Top Securities Holdings / Portfolio
Name Holding Value Quantity Invesco Pan European Equity C EUR Acc
Investment Fund | -95% ₹211 Cr 463,645
↑ 77,694 Triparty Repo
CBLO/Reverse Repo | -5% ₹10 Cr Net Receivables / (Payables)
CBLO | -0% ₹0 Cr 6. DSP World Energy Fund
DSP World Energy Fund
Growth Launch Date 14 Aug 09 NAV (29 Jul 26) ₹27.6399 ↓ -0.28 (-0.99 %) Net Assets (Cr) ₹117 on 30 Jun 26 Category Equity - Global AMC DSP BlackRock Invmt Managers Pvt. Ltd. Rating ☆☆ Risk High Expense Ratio 1.18 Sharpe Ratio 2.76 Information Ratio 0 Alpha Ratio 0 Min Investment 1,000 Min SIP Investment 500 Exit Load 0-12 Months (1%),12 Months and above(NIL) Growth of 10,000 investment over the years.
Date Value 30 Jun 21 ₹10,000 30 Jun 22 ₹8,249 30 Jun 23 ₹10,979 30 Jun 24 ₹10,687 30 Jun 25 ₹11,189 30 Jun 26 ₹18,095 Returns for DSP World Energy Fund
absolute basis & more than 1 year are on CAGR (Compound Annual Growth Rate) basis. as on 29 Jul 26 Duration Returns 1 Month -6.2% 3 Month -6.1% 6 Month 5.3% 1 Year 36% 3 Year 14.2% 5 Year 11.3% 10 Year 15 Year Since launch 6.2% Historical performance (Yearly) on absolute basis
Year Returns 2025 39.2% 2024 -6.8% 2023 12.9% 2022 -8.6% 2021 29.5% 2020 0% 2019 18.2% 2018 -11.3% 2017 -1.9% 2016 22.5% Fund Manager information for DSP World Energy Fund
Name Since Tenure Kaivalya Nadkarni 1 May 25 1.17 Yr. Data below for DSP World Energy Fund as on 30 Jun 26
Equity Sector Allocation
Sector Value Industrials 36.73% Utility 22.76% Technology 22.09% Basic Materials 9.94% Consumer Cyclical 0.71% Asset Allocation
Asset Class Value Cash 7.75% Equity 92.23% Debt 0.02% Top Securities Holdings / Portfolio
Name Holding Value Quantity BGF Sustainable Energy I2
Investment Fund | -97% ₹118 Cr 404,670 Treps / Reverse Repo Investments
CBLO/Reverse Repo | -3% ₹4 Cr Net Receivables/Payables
Net Current Assets | -0% ₹0 Cr 7. DSP US Flexible Equity Fund
DSP US Flexible Equity Fund
Growth Launch Date 3 Aug 12 NAV (29 Jul 26) ₹89.2508 ↑ 0.15 (0.17 %) Net Assets (Cr) ₹1,291 on 30 Jun 26 Category Equity - Global AMC DSP BlackRock Invmt Managers Pvt. Ltd. Rating ☆☆☆☆☆ Risk High Expense Ratio 1.55 Sharpe Ratio 1.93 Information Ratio 0.15 Alpha Ratio -4.1 Min Investment 1,000 Min SIP Investment 500 Exit Load 0-12 Months (1%),12 Months and above(NIL) Growth of 10,000 investment over the years.
Date Value 30 Jun 21 ₹10,000 30 Jun 22 ₹9,273 30 Jun 23 ₹11,265 30 Jun 24 ₹13,557 30 Jun 25 ₹15,785 30 Jun 26 ₹23,371 Returns for DSP US Flexible Equity Fund
absolute basis & more than 1 year are on CAGR (Compound Annual Growth Rate) basis. as on 29 Jul 26 Duration Returns 1 Month -3% 3 Month 1.4% 6 Month 10.4% 1 Year 35.9% 3 Year 24.3% 5 Year 17% 10 Year 15 Year Since launch 16.9% Historical performance (Yearly) on absolute basis
Year Returns 2025 33.8% 2024 17.8% 2023 22% 2022 -5.9% 2021 24.2% 2020 22.6% 2019 27.5% 2018 -1.1% 2017 15.5% 2016 9.8% Fund Manager information for DSP US Flexible Equity Fund
Name Since Tenure Kaivalya Nadkarni 1 May 25 1.17 Yr. Data below for DSP US Flexible Equity Fund as on 30 Jun 26
Equity Sector Allocation
Sector Value Technology 33.05% Industrials 13.62% Financial Services 12.17% Communication Services 12.05% Consumer Cyclical 9.62% Health Care 7.65% Basic Materials 2.45% Energy 2.43% Asset Allocation
Asset Class Value Cash 6.96% Equity 93.02% Debt 0.01% Top Securities Holdings / Portfolio
Name Holding Value Quantity BGF US Flexible Equity I2
Investment Fund | -96% ₹1,265 Cr 1,784,131
↓ -32,921 Treps / Reverse Repo Investments
CBLO/Reverse Repo | -4% ₹59 Cr Net Receivables/Payables
Net Current Assets | -0% -₹2 Cr 8. Franklin Asian Equity Fund
Franklin Asian Equity Fund
Growth Launch Date 16 Jan 08 NAV (30 Jul 26) ₹41.9857 ↓ -0.10 (-0.23 %) Net Assets (Cr) ₹979 on 30 Jun 26 Category Equity - Global AMC Franklin Templeton Asst Mgmt(IND)Pvt Ltd Rating ☆☆☆☆☆ Risk High Expense Ratio 2.54 Sharpe Ratio 1.54 Information Ratio 0 Alpha Ratio 0 Min Investment 5,000 Min SIP Investment 500 Exit Load 0-3 Years (1%),3 Years and above(NIL) Growth of 10,000 investment over the years.
Date Value 30 Jun 21 ₹10,000 30 Jun 22 ₹7,878 30 Jun 23 ₹7,912 30 Jun 24 ₹8,612 30 Jun 25 ₹9,560 30 Jun 26 ₹14,112 Returns for Franklin Asian Equity Fund
absolute basis & more than 1 year are on CAGR (Compound Annual Growth Rate) basis. as on 29 Jul 26 Duration Returns 1 Month -7.4% 3 Month 4.1% 6 Month 8.6% 1 Year 31.9% 3 Year 16.6% 5 Year 7% 10 Year 15 Year Since launch 8% Historical performance (Yearly) on absolute basis
Year Returns 2025 23.7% 2024 14.4% 2023 0.7% 2022 -14.5% 2021 -5.9% 2020 25.8% 2019 28.2% 2018 -13.6% 2017 35.5% 2016 7.2% Fund Manager information for Franklin Asian Equity Fund
Name Since Tenure Sandeep Manam 18 Oct 21 4.7 Yr. Shyam Sriram 26 Sep 24 1.76 Yr. Data below for Franklin Asian Equity Fund as on 30 Jun 26
Equity Sector Allocation
Sector Value Technology 32.45% Consumer Cyclical 15.53% Financial Services 11.03% Industrials 10.11% Health Care 5.7% Real Estate 4.83% Energy 3.46% Basic Materials 3.42% Communication Services 2.83% Utility 2.24% Consumer Defensive 1.74% Asset Allocation
Asset Class Value Cash 6.65% Equity 93.35% Top Securities Holdings / Portfolio
Name Holding Value Quantity Taiwan Semiconductor Manufacturing Co Ltd (Technology)
Equity, Since 31 Mar 09 | 23309% ₹81 Cr 114,000
↑ 41,000 Samsung Electronics Co Ltd (Technology)
Equity, Since 31 Mar 08 | 0059307% ₹62 Cr 30,867
↑ 8,934 SK Hynix Inc (Technology)
Equity, Since 30 Jun 20 | 0006605% ₹47 Cr 3,222
↑ 655 MediaTek Inc (Technology)
Equity, Since 31 Aug 20 | 24543% ₹25 Cr 19,000 ICICI Bank Ltd (Financial Services)
Equity, Since 31 Dec 25 | ICICIBANK3% ₹24 Cr 191,115
↑ 43,880 Yageo Corp (Technology)
Equity, Since 30 Jun 25 | 23272% ₹19 Cr 86,000 Tencent Holdings Ltd (Communication Services)
Equity, Since 31 Jul 14 | NNND2% ₹18 Cr 34,400
↑ 5,200 HDFC Bank Ltd (Financial Services)
Equity, Since 31 Dec 25 | HDFCBANK2% ₹17 Cr 224,505
↑ 71,852 Larsen & Toubro Ltd (Industrials)
Equity, Since 31 Mar 24 | LT2% ₹16 Cr 39,999
↑ 5,662 Eternal Ltd (Consumer Cyclical)
Equity, Since 31 Jul 21 | ETERNAL2% ₹16 Cr 639,163
↑ 237,879
بین الاقوامی میوچل فنڈز کی اقسام
1. ابھرتی ہوئی مارکیٹ فنڈز
اس قسم کا میوچل فنڈ بھارت، چین، روس، برازیل وغیرہ جیسی ابھرتی ہوئی مارکیٹوں میں سرمایہ کاری کرتا ہے۔ چین امریکہ کو پیچھے چھوڑ کر دنیا کا سب سے بڑا کار ساز ادارہ بن گیا ہے۔ روس قدرتی گیس میں ایک بڑا کھلاڑی ہے۔ ہندوستان میں تیزی سے بڑھتی ہوئی سروس اکانومی کی بنیاد ہے۔ ان ممالک میں آنے والے سالوں میں زبردست ترقی کی توقع ہے جو انہیں سرمایہ کاروں کے لیے ایک گرم انتخاب بنائیں گے۔
کچھ بہترین بین الاقوامی میوچل فنڈ اسکیمیں جو ابھرتی ہوئی مارکیٹوں میں سرمایہ کاری کرتی ہیں وہ ہیں برلا سن لائف انٹرنیشنل ایکویٹی پلان اے، کوٹک گلوبل ایمرجنگ مارکیٹ فنڈ اور پرنسپل گلوبل مواقع فنڈ۔
Talk to our investment specialist
2. ترقی یافتہ مارکیٹ فنڈز
ترقی یافتہ مارکیٹ فنڈز ایک پرکشش آپشن ہیں کیونکہ عام طور پر دیکھا جاتا ہے کہ بالغ مارکیٹیں زیادہ مستحکم ہوتی ہیں۔ نیز، ان کے پاس ابھرتی ہوئی منڈیوں جیسے معیشت یا معیشت میں کرنسی کا خطرہ، سیاسی عدم استحکام وغیرہ سے وابستہ مسائل نہیں ہیں جو انہیں کم خطرہ بنا رہے ہیں۔ کچھ اسکیمیں جو ترقی یافتہ منڈیوں میں سرمایہ کاری کرتی ہیں وہ DWS Global Thematic ہیں۔سمندر کے کنارے فنڈ وغیرہ
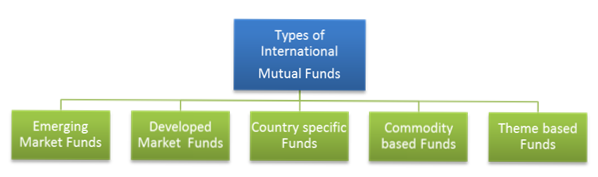
3. ملک کے مخصوص فنڈز
جیسا کہ نام سے پتہ چلتا ہے، یہ قسم صرف ایک مخصوص ملک یا دنیا کے کسی حصے میں سرمایہ کاری کرتی ہے۔ لیکن، ملک سے متعلق فنڈز پورٹ فولیو کو متنوع بنانے کے پورے مقصد کو ناکام بنا دیتے ہیں کیونکہ یہ تمام انڈے ایک ہی ٹوکری میں رکھتا ہے۔ تاہم، جب مختلف وجوہات کی بنا پر مخصوص ممالک میں مواقع ہوتے ہیں، تو یہ فنڈز ایک اچھا انتخاب بن جاتے ہیں۔
ریلائنس جاپانایکویٹی فنڈ، کوٹک یو ایس ایکویٹیز فنڈ اورمیرا اثاثہ چائنا ایڈوانٹیج فنڈ کچھ ملک سے متعلق اسکیمیں ہیں۔
4. کموڈٹی بیسڈ فنڈز
یہ فنڈز سونے، قیمتی دھاتیں، خام تیل، گندم وغیرہ جیسی اشیاء میں سرمایہ کاری کرتے ہیں۔مہنگائی ہیج، اس طرح سرمایہ کاروں کی حفاظت. نیز، یہ فنڈز ملٹی کموڈٹی ہو سکتے ہیں یا کسی ایک شے پر مرکوز ہو سکتے ہیں۔
کموڈٹی پر مبنی بہترین بین الاقوامی میوچل فنڈز ہیں DSP Black Rock World Gold Fund، ING OptiMix Global Commodities، Mirae Asset Global Commodity Stocks، Birla Sun Life Commodity Equities - Global Agri Fund، وغیرہ۔
5. تھیم پر مبنی فنڈز
تھیم پر مبنی فنڈز یا تھیمیٹک فنڈز کسی خاص تھیم میں سرمایہ کاری کرتے ہیں۔ مثال کے طور پر، اگر تھیم انفراسٹرکچر ہے، تو یہ انفراسٹرکچر کی تعمیراتی کمپنیوں کے ساتھ ساتھ سیمنٹ، سٹیل وغیرہ جیسے انفراسٹرکچر کے کاروبار سے متعلق کمپنیوں میں بھی سرمایہ کاری کرے گا۔
وہ اکثر سیکٹرل فنڈز کے ساتھ الجھ جاتے ہیں جو صرف ایک مخصوص صنعت پر فوکس کرتے ہیں۔ مثال کے طور پر، فارماسیوٹیکل سیکٹرل فنڈز صرف فارما کمپنیوں میں سرمایہ کاری کریں گے۔ اس کے مقابلےسیکٹر فنڈزتھیمیٹک فنڈز ایک وسیع تر تصور ہے۔ یہ زیادہ تنوع اور کم خطرہ پیش کرتا ہے کیونکہ سرمایہ کاری مختلف صنعتوں میں پھیلی ہوئی ہے۔
کچھ تھیم پر مبنی فنڈز DSPBR ورلڈ انرجی فنڈ، L&T گلوبل ریئل ایسٹس فنڈ وغیرہ ہیں۔
انٹرنیشنل میوچل فنڈز میں سرمایہ کاری کیوں کی جائے؟
1. تنوع
کا بنیادی مقصدسرمایہ کاری بین الاقوامی میوچل فنڈز میں تنوع ہے۔ تنوع منافع کو بہتر بنانے اور پورٹ فولیو کے مجموعی خطرات کو کم کرنے میں مدد کرتا ہے۔ سرمایہ کاری کے درمیان کم یا منفی ارتباط اس بات کو یقینی بناتے ہیں کہ منافع صرف ایک شعبے یا معیشت پر منحصر نہیں ہے۔ اس طرح، پورٹ فولیو کو متوازن کرنا اور سرمایہ کار کی حفاظت کرنا۔
2. سرمایہ کاری میں آسانی
آپ ایکویٹیز، کموڈٹیز، رئیل اسٹیٹ، اور ایکسچینج ٹریڈڈ فنڈز (ETFs) اس کے ساتھ ساتھ. بین الاقوامی میوچل فنڈ کے یونٹ خریدنا بہت آسان ہے اور وہ فنڈ مینیجر کی مہارت بھی فراہم کرتے ہیں جو سرمایہ کاری کے دیگر مواقع پر دستیاب نہیں ہے۔
3. بین الاقوامی نمائش
بین الاقوامی میوچل فنڈز سرمایہ کاروں کے افق کو ملکی حدود سے باہر بڑھانے میں مدد کرتے ہیں۔ نیز، بین الاقوامی سطح پر سرمایہ کاری کرنے سے کسی بھی نقصان کو ختم کرنے میں مدد ملتی ہے جو سرمایہ کار کو مقامی مارکیٹ میں اٹھانا پڑ سکتا ہے۔
4. کرنسی کے اتار چڑھاؤ
بین الاقوامی میوچل فنڈ اسکیمیں طے کرتی ہیں۔نہیں ہیں موجودہ شرح مبادلہ کا استعمال کرتے ہوئے فنڈ کی (نیٹ اثاثہ قیمت)۔ شرح مبادلہ ہر دن، یا اس سے بھی زیادہ، ہر منٹ میں اتار چڑھاؤ آتا ہے۔
اس کا مطلب ہے کہ امریکی ڈالر میں سرمایہ کاری کرنے والی اسکیم کے لیے، اسکیم کا NAV ڈالر-روپے کی نقل و حرکت کے مطابق متاثر ہوگا۔ یہ مشاہدہ کیا گیا ہے کہ روپے کی قدر میں جتنی زیادہ کمی ہوتی ہے، منافع اتنا ہی زیادہ ہوتا ہے۔ یہ بین الاقوامی میوچل فنڈز کو مزید پرکشش بناتا ہے کیونکہ روپیہ اب نیچے کی طرف جا رہا ہے۔
5. ملک کی مخصوص نمائش
اگر سرمایہ کار کسی دوسرے ملک کی ترقی کا مکمل فائدہ اٹھانا چاہتا ہے، تو بین الاقوامی میوچل فنڈز جانے کا راستہ ہے۔ لیکنپلٹائیں اس کا پہلو یہ ہوگا کہ پورٹ فولیو صرف ایک معیشت پر منحصر ہے۔ لہذا، خطرے میں اضافہعنصر.
بین الاقوامی میوچل فنڈز کا ٹیکس
ہندوستان میں بین الاقوامی میوچل فنڈز کا ٹیکس سلوک اسی طرح ہے۔قرض فنڈ. اگر سرمایہ کار کے پاس سرمایہ کاری قلیل مدتی ہے یعنی اس سے کم36 ماہ، وہ اس کے کل میں شامل ہوں گے۔آمدنی اور قابل اطلاق سلیب ریٹ کے مطابق ٹیکس لگایا جائے گا۔
اگر سرمایہ کاری 36 ماہ سے زیادہ کے لیے رکھی جاتی ہے، تو سرمایہ کار انڈیکسیشن فوائد کے لیے اہل ہو جاتا ہے۔ اسکیموں سے حاصل ہونے والے کسی بھی منافع پر ٹیکس عائد کیا جائے گا۔@ 10% بغیر اشاریہ کے یا20% اشاریہ سازی کے ساتھ۔
انٹرنیشنل میوچل فنڈ میں آن لائن سرمایہ کاری کیسے کی جائے؟
Fincash.com پر لائف ٹائم کے لیے مفت انویسٹمنٹ اکاؤنٹ کھولیں۔
اپنی رجسٹریشن اور KYC کا عمل مکمل کریں۔
دستاویزات اپ لوڈ کریں (PAN، آدھار، وغیرہ)۔اور، آپ سرمایہ کاری کے لیے تیار ہیں!
ماہرین کے مطابق، ایک سرمایہ کار کے پاس پورٹ فولیو کا تقریباً 10-12٪ بین الاقوامی میوچل فنڈز میں سرمایہ کاری ہونا چاہیے۔ لہذا اب بنیادی باتوں کا احاطہ کرتے ہوئے، آج ہی بین الاقوامی میوچل فنڈز کے ساتھ اس پورٹ فولیو کو بنانا شروع کریں۔
اکثر پوچھے گئے سوالات
1. بین الاقوامی میوچل فنڈز میں سرمایہ کاری کے کیا فوائد ہیں؟
A: یہ آپ کے سرمایہ کاری کے پورٹ فولیو کو متنوع بناتا ہے، جو آپ کو بہتر اور متنوع منافع دیتا ہے۔ یہ آپ کے پورٹ فولیو کو بھی متوازن رکھتا ہے۔ چونکہ ان کمپنیوں کے پاس غیر ملکی فنڈز ہیں، آپ اپنی سرمایہ کاری سے اچھے منافع کی توقع کر سکتے ہیں۔
2. کیا میں ان کمپنیوں میں سرمایہ کاری کر سکتا ہوں جو ہندوستان سے کم ترقی کرتی ہیں؟
A: ہاں، آپ کر سکتے ہیں، لیکن اس کا انحصار اس مالیاتی ادارے پر ہوگا جس میں آپ سرمایہ کاری کر رہے ہیں۔ آپ براہ راست کسی غیر ملکی کمپنی کی سیکیورٹیز میں سرمایہ کاری نہیں کر سکتے۔ خاص سیکورٹی میں سرمایہ کاری کرنے میں آپ کی مدد کے لیے آپ کو بروکر یا مالیاتی ادارے کی ضرورت ہوگی۔
3. فرینکلن انڈیا فیڈر کیا ہے؟
A: فرینکلن انڈیا فیڈر یا فرینکلن یو ایس اپرچیونٹیز فنڈ سب سے کامیاب بین الاقوامی میوچل فنڈز میں سے ایک ہے۔ یہ فنڈ آپ کو ریاستہائے متحدہ میں کمپنیوں کی متعدد سیکیورٹیز میں سرمایہ کاری کرنے کی اجازت دیتا ہے جو ٹیکنالوجی، صحت کی دیکھ بھال، کنزیومر سائکلیکل، مالیاتی خدمات، اور اس طرح کے بہت سے صنعتی شعبوں میں شامل ہیں۔ یہ میوچل فنڈز آپ کو اپنی سرمایہ کاری کے پورٹ فولیو کو متنوع بنانے کی اجازت دیتے ہیں، جس سے ایک ہی سرمایہ کاری کے ذریعے متعدد سیکیورٹیز میں سرمایہ کاری کرنا آسان ہوجاتا ہے۔ اپنے آغاز کے بعد سے، فرینکلن انڈیا فیڈر نے اس کی واپسی کی ہے۔19.9%
4. بلیک راک ورلڈ مائننگ فنڈ کیا ہے؟
A: یہ فرینکلن سے مختلف ہے کیونکہ اس میں صرف ضروری مواد اور مالیاتی خدمات میں ایکویٹی سیکٹر ہے۔ یہ ایک اعلی رسک میوچل فنڈ سمجھا جاتا ہے، لیکن یہ بہترین منافع پیدا کرنے کے لیے جانا جاتا ہے۔ دیڈی ایس پی بلیک راک عالمی کان کنی نے تقریباً منافع پیدا کیا ہے۔34.9% 3 سال کی سرمایہ کاری کی مدت کے لیے۔
5. کیا بین الاقوامی میوچل فنڈز سے حاصل ہونے والی آمدنی پر ٹیکس عائد ہوتا ہے؟
A: جی ہاں،کمائی بین الاقوامی میوچل فنڈز سے ٹیکس لگایا جاتا ہے۔ ان فنڈز سے آپ جو منافع کماتے ہیں وہ ماخذ پر کٹوتی ٹیکس یا ٹی ڈی ایس پر ذمہ دار ہے۔7.5% 31 مارچ 2021 تک، اور میوچل فنڈ ہاؤس اس کی کٹوتی کرتا ہے۔ اگر آپ نے 3 سال کے لیے سرمایہ کاری کی ہے، تو یہ قلیل مدتی سرمایہ کاری کے تحت آئے گی، اور اگر زیادہ کے لیے، تو آپ کو اسے طویل مدتی سرمایہ کاری کے تحت درجہ بندی کرنا ہوگی۔ ٹیکسیشن سلیب کا انحصار اس وقت پر بھی ہوگا جس کے لیے سرمایہ کاری کی گئی ہے۔
6. بین الاقوامی میوچل فنڈ کا بنیادی خطرہ کیا ہے؟
A: بین الاقوامی میوچل فنڈ کا بنیادی خطرہ غیر ملکی کرنسی کی شرح میں اتار چڑھاؤ ہے۔ اگر روپے کے مقابلے میں زرمبادلہ کی شرح میں اتار چڑھاؤ آتا ہے، تو یہ آپ کی سرمایہ کاری کو بری طرح متاثر کر سکتا ہے۔
7. غیر ملکی میوچل فنڈ میں کون سرمایہ کاری کرے؟
A: اگر آپ اپنے سرمایہ کاری کے پورٹ فولیو کو متنوع بنانا چاہتے ہیں اور جغرافیائی تنوع کو شامل کرنا چاہتے ہیں، تو آپ غیر ملکی میوچل فنڈ میں سرمایہ کاری کرنے پر غور کر سکتے ہیں۔
یہاں فراہم کردہ معلومات کے درست ہونے کو یقینی بنانے کے لیے تمام کوششیں کی گئی ہیں۔ تاہم، ڈیٹا کی درستگی کے حوالے سے کوئی ضمانت نہیں دی جاتی ہے۔ براہ کرم کوئی بھی سرمایہ کاری کرنے سے پہلے اسکیم کی معلومات کے دستاویز کے ساتھ تصدیق کریں۔


AMFI Registration No. 112358 | CIN: U74999MH2016PTC282153
Shepard Technologies Pvt. Ltd. (with ARN code 112358) makes no warranties or representations, express or implied, on products offered through the platform. It accepts no liability for any damages or losses, however caused, in connection with the use of, or on the reliance of its product or related services. Terms and conditions of the website are applicable.
©2026 Shepard Technologies Private Limited. All Rights Reserved
Very good article I got all the required information.