7 Best Arbitrage Mutual Funds 2026
Generally, people willing to invest in arbitrage funds look for the best arbitrage funds. But what are Arbitrage funds?
An arbitrage fund is a popular short-term financial investment in India. Arbitrage funds are Mutual Funds that leverage the differential price between the cash market and derivative market to generate mutual fund returns.

The returns generated by arbitrage funds are dependent on the Volatility of the stock market. Arbitrage mutual funds are hybrid in nature and in times of high or persistent volatility, these funds offer relatively risk-free returns to investors. Before Investing in these funds it is important to understand arbitrage funds taxation and know the best arbitrage funds.
Why Invest in Arbitrage Funds?
Here are some of the benefits of investing in arbitrage funds:
1. Negligible Risk
Arbitrage funds are not 100% risk-free but they do carry negligible risk. They Bank on the mispricing happening in the markets. This gives the investor a safer option compared to other short-term funds since these funds offer better returns during market volatility.
2. Returns
These funds generally give a return of about 7-9% of the amount invested. This is higher compared to Liquid Funds or short-term debt funds in low rate enviornment (When RBI is reducing rate).
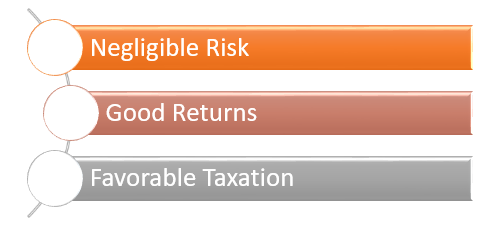
Thus, making arbitrage funds a lucrative investment option.
Talk to our investment specialist
3. Favourable Taxation
One of the biggest benefits of investing in these funds is the tax treatment. Equity Funds attract long term Capital Gains. If the gains are made up to INR 1 lakh then it counts under tax-free. Tax at 10% applies to gains above INR 1 lakh.
Arbitrage Funds Taxation
As mentioned above, these funds are taxed favourably. They are said to be a combination of good Debt fund returns and the tax treatment of equity mutual funds. Arbitrage schemes are taxed similar to equity funds making it an attractive investment for people in higher tax brackets. For example, if you belong to a 30% tax bracket, investing in equity arbitrage funds can lower your tax rates to 10% for LTCG and 15% for STCG.
Fund Selection Methodology used to find 7 funds
Top 7 Arbitrage Mutual Funds 2026 - 2027
Fund NAV Net Assets (Cr) 3 MO (%) 6 MO (%) 1 YR (%) 3 YR (%) 5 YR (%) 2025 (%) Invesco India Arbitrage Fund Growth ₹33.9714
↑ 0.02 ₹28,526 1.5 2.9 6 6.9 6.2 6.5 Kotak Equity Arbitrage Fund Growth ₹39.8815
↑ 0.02 ₹72,409 1.5 3 6 7 6.2 6.4 HDFC Arbitrage Fund Growth ₹32.6
↑ 0.02 ₹23,772 1.5 3 6 6.9 6 6.3 ICICI Prudential Equity Arbitrage Fund Growth ₹36.5099
↑ 0.02 ₹33,423 1.5 3 6 6.9 6 6.5 UTI Arbitrage Fund Growth ₹37.2961
↑ 0.02 ₹11,324 1.4 2.9 6 6.9 6 6.5 SBI Arbitrage Opportunities Fund Growth ₹35.9782
↑ 0.02 ₹45,923 1.4 2.9 5.9 6.9 6.2 6.5 Edelweiss Arbitrage Fund Growth ₹20.6106
↑ 0.01 ₹15,062 1.5 3 5.9 6.9 6.1 6.3 Note: Returns up to 1 year are on absolute basis & more than 1 year are on CAGR basis. as on 28 Jul 26 Research Highlights & Commentary of 7 Funds showcased
Commentary Invesco India Arbitrage Fund Kotak Equity Arbitrage Fund HDFC Arbitrage Fund ICICI Prudential Equity Arbitrage Fund UTI Arbitrage Fund SBI Arbitrage Opportunities Fund Edelweiss Arbitrage Fund Point 1 Lower mid AUM (₹28,526 Cr). Highest AUM (₹72,409 Cr). Lower mid AUM (₹23,772 Cr). Upper mid AUM (₹33,423 Cr). Bottom quartile AUM (₹11,324 Cr). Upper mid AUM (₹45,923 Cr). Bottom quartile AUM (₹15,062 Cr). Point 2 Established history (19+ yrs). Oldest track record among peers (20 yrs). Established history (18+ yrs). Established history (19+ yrs). Established history (20+ yrs). Established history (19+ yrs). Established history (12+ yrs). Point 3 Rating: 3★ (lower mid). Rating: 4★ (upper mid). Rating: 3★ (lower mid). Rating: 4★ (upper mid). Rating: 3★ (bottom quartile). Rating: 2★ (bottom quartile). Top rated. Point 4 Risk profile: Moderately Low. Risk profile: Moderately Low. Risk profile: Moderately Low. Risk profile: Moderate. Risk profile: Moderately Low. Risk profile: Moderately Low. Risk profile: Moderately Low. Point 5 5Y return: 6.24% (top quartile). 5Y return: 6.20% (upper mid). 5Y return: 6.01% (bottom quartile). 5Y return: 6.04% (lower mid). 5Y return: 6.04% (bottom quartile). 5Y return: 6.23% (upper mid). 5Y return: 6.07% (lower mid). Point 6 3Y return: 6.90% (upper mid). 3Y return: 6.99% (top quartile). 3Y return: 6.88% (bottom quartile). 3Y return: 6.89% (lower mid). 3Y return: 6.95% (upper mid). 3Y return: 6.88% (lower mid). 3Y return: 6.85% (bottom quartile). Point 7 1Y return: 6.02% (top quartile). 1Y return: 5.99% (upper mid). 1Y return: 5.98% (upper mid). 1Y return: 5.97% (lower mid). 1Y return: 5.97% (lower mid). 1Y return: 5.94% (bottom quartile). 1Y return: 5.91% (bottom quartile). Point 8 1M return: 0.52% (upper mid). 1M return: 0.51% (lower mid). 1M return: 0.50% (lower mid). 1M return: 0.52% (top quartile). 1M return: 0.48% (bottom quartile). 1M return: 0.48% (bottom quartile). 1M return: 0.52% (upper mid). Point 9 Alpha: 0.00 (top quartile). Alpha: 0.00 (upper mid). Alpha: 0.00 (upper mid). Alpha: 0.00 (lower mid). Alpha: 0.00 (lower mid). Alpha: 0.00 (bottom quartile). Alpha: -0.95 (bottom quartile). Point 10 Sharpe: 0.47 (top quartile). Sharpe: 0.31 (lower mid). Sharpe: 0.36 (upper mid). Sharpe: 0.29 (bottom quartile). Sharpe: 0.34 (upper mid). Sharpe: 0.33 (lower mid). Sharpe: 0.20 (bottom quartile). Invesco India Arbitrage Fund
Kotak Equity Arbitrage Fund
HDFC Arbitrage Fund
ICICI Prudential Equity Arbitrage Fund
UTI Arbitrage Fund
SBI Arbitrage Opportunities Fund
Edelweiss Arbitrage Fund
*Below is the list of Arbitrage funds sorted on last 1 year return and having AUM > 100 Crore.
The primary investment objective of the scheme is to generate income through arbitrage opportunities emerging out of mis-pricing between the cash market and the derivatives market and through deployment of surplus cash in fixed income instruments. Below is the key information for Invesco India Arbitrage Fund Returns up to 1 year are on The investment objective of the scheme is to generate capital appreciation and income by predominantly investing in arbitrage opportunities in the cash and derivatives segment of the equity market, and by investing the balance in debt and money market instruments. However, there is no assurance that the objective of the scheme will be realized Research Highlights for Kotak Equity Arbitrage Fund Below is the key information for Kotak Equity Arbitrage Fund Returns up to 1 year are on "To generate income through arbitrage opportunities between cash and derivative market and arbitrage opportunities within the derivative segment and by deployment of surplus cash in debt securities and money market instruments." Research Highlights for HDFC Arbitrage Fund Below is the key information for HDFC Arbitrage Fund Returns up to 1 year are on The investment objective of Income Optimiser Plan under the scheme is to seek to generate low volatility returns by using arbitrage and other derivative strategies in equity markets and investments in short-term debt portfolio. Research Highlights for ICICI Prudential Equity Arbitrage Fund Below is the key information for ICICI Prudential Equity Arbitrage Fund Returns up to 1 year are on (Erstwhile UTI SPREAD Fund) The investment objective of the scheme is to provide capital appreciation and dividend distribution through arbitrage opportunities arising out of price differences between the cash and derivative market by investing predominantly in equity and equity-related securities, derivatives and the balance portion in debt securities. However, there can be no assurance that the investment objective of the scheme will be realised. Research Highlights for UTI Arbitrage Fund Below is the key information for UTI Arbitrage Fund Returns up to 1 year are on To provide capital appreciation and regular income for unitholders by identifying profitable arbitrage opportunities between the spot and derivative market segments as also through investment of surplus cash in debt and money market instruments. Research Highlights for SBI Arbitrage Opportunities Fund Below is the key information for SBI Arbitrage Opportunities Fund Returns up to 1 year are on The investment objective of the Scheme is to generate income by predominantly investing in arbitrage opportunities in the cash and the derivative segments of the equity markets and the arbitrage opportunities available within the derivative segment and by investing the balance in debt and money market instruments. However, there is no assurance that the investment objective of the scheme will be realized. Research Highlights for Edelweiss Arbitrage Fund Below is the key information for Edelweiss Arbitrage Fund Returns up to 1 year are on 1. Invesco India Arbitrage Fund
Invesco India Arbitrage Fund
Growth Launch Date 30 Apr 07 NAV (28 Jul 26) ₹33.9714 ↑ 0.02 (0.05 %) Net Assets (Cr) ₹28,526 on 30 Jun 26 Category Hybrid - Arbitrage AMC Invesco Asset Management (India) Private Ltd Rating ☆☆☆ Risk Moderately Low Expense Ratio 1.06 Sharpe Ratio 0.47 Information Ratio 0 Alpha Ratio 0 Min Investment 5,000 Min SIP Investment 500 Exit Load 0-15 Days (0.5%),15 Days and above(NIL) Growth of 10,000 investment over the years.
Date Value 30 Jun 21 ₹10,000 30 Jun 22 ₹10,398 30 Jun 23 ₹11,056 30 Jun 24 ₹11,915 30 Jun 25 ₹12,748 30 Jun 26 ₹13,505 Returns for Invesco India Arbitrage Fund
absolute basis & more than 1 year are on CAGR (Compound Annual Growth Rate) basis. as on 28 Jul 26 Duration Returns 1 Month 0.5% 3 Month 1.5% 6 Month 2.9% 1 Year 6% 3 Year 6.9% 5 Year 6.2% 10 Year 15 Year Since launch 6.6% Historical performance (Yearly) on absolute basis
Year Returns 2025 6.5% 2024 7.6% 2023 7.4% 2022 5.1% 2021 3.5% 2020 4.3% 2019 5.9% 2018 5.9% 2017 5.5% 2016 6.5% Fund Manager information for Invesco India Arbitrage Fund
Name Since Tenure Deepak Gupta 11 Nov 21 4.64 Yr. Pradeep Sukte 25 Jun 26 0.01 Yr. Data below for Invesco India Arbitrage Fund as on 30 Jun 26
Asset Allocation
Asset Class Value Cash 97.74% Debt 2.79% Equity Sector Allocation
Sector Value Financial Services 29.67% Basic Materials 6.63% Consumer Cyclical 5.89% Industrials 5.55% Energy 5.47% Health Care 4.85% Consumer Defensive 3.25% Communication Services 3.2% Utility 2.3% Real Estate 0.73% Technology 0.54% Debt Sector Allocation
Sector Value Cash Equivalent 81.55% Corporate 17.35% Government 2.28% Credit Quality
Rating Value AA 1.84% AAA 98.16% Top Securities Holdings / Portfolio
Name Holding Value Quantity Future on BANK Index
- | -18% -₹4,993 Cr 233,489,475
↑ 135,632,150 Invesco India Liquid Dir Gr
Investment Fund | -7% ₹1,886 Cr 4,932,898
↓ -1,205,000 HDFC Bank Ltd (Financial Services)
Equity, Since 31 Jan 23 | HDFCBANK6% ₹1,767 Cr 23,732,950
↑ 14,076,050 ICICI Bank Ltd (Financial Services)
Equity, Since 31 Oct 24 | ICICIBANK6% ₹1,583 Cr 12,601,400
↑ 5,239,500 Invesco India Money Market Dir Gr
Investment Fund | -5% ₹1,467 Cr 4,415,910 Future on Reliance Industries Ltd
Derivatives | -3% -₹711 Cr 5,343,000
↑ 5,343,000 Reliance Industries Ltd (Energy)
Equity, Since 31 Dec 22 | RELIANCE3% ₹706 Cr 5,343,000
↑ 1,528,500 Future on Bharat Heavy Electricals Ltd
Derivatives | -2% -₹655 Cr 15,584,625
↑ 15,584,625 Bharat Heavy Electricals Ltd (Industrials)
Equity, Since 31 Mar 23 | BHEL2% ₹649 Cr 15,584,625
↓ -2,000,250 State Bank of India (Financial Services)
Equity, Since 31 Jan 23 | SBIN2% ₹641 Cr 6,649,500
↓ -2,771,250 2. Kotak Equity Arbitrage Fund
Kotak Equity Arbitrage Fund
Growth Launch Date 29 Sep 05 NAV (28 Jul 26) ₹39.8815 ↑ 0.02 (0.06 %) Net Assets (Cr) ₹72,409 on 30 Jun 26 Category Hybrid - Arbitrage AMC Kotak Mahindra Asset Management Co Ltd Rating ☆☆☆☆ Risk Moderately Low Expense Ratio 0.97 Sharpe Ratio 0.31 Information Ratio 0 Alpha Ratio 0 Min Investment 5,000 Min SIP Investment 500 Exit Load 0-30 Days (0.25%),30 Days and above(NIL) Growth of 10,000 investment over the years.
Date Value 30 Jun 21 ₹10,000 30 Jun 22 ₹10,389 30 Jun 23 ₹11,016 30 Jun 24 ₹11,896 30 Jun 25 ₹12,743 30 Jun 26 ₹13,489 Returns for Kotak Equity Arbitrage Fund
absolute basis & more than 1 year are on CAGR (Compound Annual Growth Rate) basis. as on 28 Jul 26 Duration Returns 1 Month 0.5% 3 Month 1.5% 6 Month 3% 1 Year 6% 3 Year 7% 5 Year 6.2% 10 Year 15 Year Since launch 6.9% Historical performance (Yearly) on absolute basis
Year Returns 2025 6.4% 2024 7.8% 2023 7.4% 2022 4.5% 2021 4% 2020 4.3% 2019 6.1% 2018 6.3% 2017 5.8% 2016 6.7% Fund Manager information for Kotak Equity Arbitrage Fund
Name Since Tenure Hiten Shah 3 Oct 19 6.75 Yr. Data below for Kotak Equity Arbitrage Fund as on 30 Jun 26
Asset Allocation
Asset Class Value Cash 92.61% Debt 8% Other 0.06% Equity Sector Allocation
Sector Value Financial Services 26.85% Consumer Cyclical 7.94% Basic Materials 7.71% Energy 6.55% Industrials 6.48% Utility 4.97% Health Care 4.21% Communication Services 3.84% Consumer Defensive 3.45% Technology 0.96% Debt Sector Allocation
Sector Value Cash Equivalent 79.27% Corporate 16.25% Government 5.08% Credit Quality
Rating Value AAA 100% Top Securities Holdings / Portfolio
Name Holding Value Quantity Kotak Money Market Dir Gr
Investment Fund | -11% ₹8,159 Cr 17,061,028 Kotak Savings Fund Dir Gr
Investment Fund | -5% ₹3,915 Cr 826,303,438
↓ -31,700,680 ICICI Bank Ltd (Financial Services)
Equity, Since 31 Dec 19 | ICICIBANK5% ₹3,562 Cr 28,349,300
↑ 12,098,800 ICICI Bank Ltd.-JUN2026
Derivatives | -5% -₹3,407 Cr 26,824,000
↑ 23,160,900 HDFC Bank Ltd (Financial Services)
Equity, Since 30 Apr 22 | HDFCBANK4% ₹3,219 Cr 43,231,450
↑ 7,065,700 HDFC Bank Ltd.-JUN2026
Derivatives | -4% -₹2,898 Cr 39,114,350
↑ 25,024,450 Reliance Industries Ltd (Energy)
Equity, Since 31 May 18 | RELIANCE3% ₹2,405 Cr 18,201,500
↑ 11,245,500 RELIANCE INDUSTRIES LTD.-JUN2026
Derivatives | -3% -₹2,319 Cr 17,438,500
↑ 13,632,000 Kotak Low Duration Dir Gr
Investment Fund | -3% ₹2,050 Cr 5,338,100
↑ 377,270 Axis Bank Ltd (Financial Services)
Equity, Since 30 Jun 18 | AXISBANK2% ₹1,474 Cr 11,455,000
↓ -410,625 3. HDFC Arbitrage Fund
HDFC Arbitrage Fund
Growth Launch Date 23 Oct 07 NAV (28 Jul 26) ₹32.6 ↑ 0.02 (0.05 %) Net Assets (Cr) ₹23,772 on 30 Jun 26 Category Hybrid - Arbitrage AMC HDFC Asset Management Company Limited Rating ☆☆☆ Risk Moderately Low Expense Ratio 0.97 Sharpe Ratio 0.36 Information Ratio 0 Alpha Ratio 0 Min Investment 100,000 Min SIP Investment 300 Exit Load 0-1 Months (0.25%),1 Months and above(NIL) Growth of 10,000 investment over the years.
Date Value 30 Jun 21 ₹10,000 30 Jun 22 ₹10,342 30 Jun 23 ₹10,948 30 Jun 24 ₹11,793 30 Jun 25 ₹12,620 30 Jun 26 ₹13,363 Returns for HDFC Arbitrage Fund
absolute basis & more than 1 year are on CAGR (Compound Annual Growth Rate) basis. as on 28 Jul 26 Duration Returns 1 Month 0.5% 3 Month 1.5% 6 Month 3% 1 Year 6% 3 Year 6.9% 5 Year 6% 10 Year 15 Year Since launch 6.5% Historical performance (Yearly) on absolute basis
Year Returns 2025 6.3% 2024 7.7% 2023 7.2% 2022 4.2% 2021 3.6% 2020 3.7% 2019 6% 2018 5.7% 2017 5.3% 2016 6.6% Fund Manager information for HDFC Arbitrage Fund
Name Since Tenure Anil Bamboli 1 Feb 22 4.41 Yr. Arun Agarwal 24 Aug 20 5.85 Yr. Dhruv Muchhal 22 Jun 23 3.02 Yr. Nandita Menezes 29 Mar 25 1.25 Yr. Data below for HDFC Arbitrage Fund as on 30 Jun 26
Asset Allocation
Asset Class Value Cash 92.8% Debt 7.74% Other 0.05% Equity Sector Allocation
Sector Value Financial Services 23.93% Basic Materials 9.82% Consumer Cyclical 7.47% Energy 6.54% Industrials 6.04% Consumer Defensive 4.02% Communication Services 3.36% Health Care 3.21% Utility 3.01% Real Estate 0.7% Technology 0.68% Debt Sector Allocation
Sector Value Cash Equivalent 78.24% Corporate 18.35% Government 3.94% Credit Quality
Rating Value AAA 100% Top Securities Holdings / Portfolio
Name Holding Value Quantity HDFC Money Market Dir Gr
Investment Fund | -8% ₹2,064 Cr 3,354,179 HDFC Bank Ltd (Financial Services)
Equity, Since 31 Jan 23 | HDFCBANK6% ₹1,553 Cr 20,863,200
↑ 143,600 Hdfc Bank Ltd.
Derivatives | -6% -₹1,547 Cr 20,863,200
↑ 20,863,200 Reliance Industries Ltd.
Derivatives | -4% -₹1,111 Cr 8,355,000
↑ 8,355,000 Reliance Industries Ltd (Energy)
Equity, Since 31 Oct 21 | RELIANCE4% ₹1,104 Cr 8,355,000
↑ 522,000 Icici Bank Ltd.
Derivatives | -4% -₹1,004 Cr 7,896,700
↑ 7,896,700 ICICI Bank Ltd (Financial Services)
Equity, Since 30 Jun 24 | ICICIBANK4% ₹992 Cr 7,896,700
↑ 1,415,400 HDFC Liquid Dir Gr
Investment Fund | -4% ₹933 Cr 1,704,922 Bharti Airtel Ltd.
Derivatives | -2% -₹616 Cr 3,339,250
↑ 3,339,250 Jsw Steel Ltd.
Derivatives | -2% -₹613 Cr 4,739,175
↑ 4,739,175 4. ICICI Prudential Equity Arbitrage Fund
ICICI Prudential Equity Arbitrage Fund
Growth Launch Date 30 Dec 06 NAV (28 Jul 26) ₹36.5099 ↑ 0.02 (0.06 %) Net Assets (Cr) ₹33,423 on 30 Jun 26 Category Hybrid - Arbitrage AMC ICICI Prudential Asset Management Company Limited Rating ☆☆☆☆ Risk Moderate Expense Ratio 0.9 Sharpe Ratio 0.29 Information Ratio 0 Alpha Ratio 0 Min Investment 5,000 Min SIP Investment 1,000 Exit Load 0-1 Months (0.25%),1 Months and above(NIL) Growth of 10,000 investment over the years.
Date Value 30 Jun 21 ₹10,000 30 Jun 22 ₹10,357 30 Jun 23 ₹10,964 30 Jun 24 ₹11,801 30 Jun 25 ₹12,641 30 Jun 26 ₹13,380 Returns for ICICI Prudential Equity Arbitrage Fund
absolute basis & more than 1 year are on CAGR (Compound Annual Growth Rate) basis. as on 28 Jul 26 Duration Returns 1 Month 0.5% 3 Month 1.5% 6 Month 3% 1 Year 6% 3 Year 6.9% 5 Year 6% 10 Year 15 Year Since launch 6.8% Historical performance (Yearly) on absolute basis
Year Returns 2025 6.5% 2024 7.6% 2023 7.1% 2022 4.2% 2021 3.9% 2020 4.3% 2019 5.9% 2018 6.2% 2017 5.5% 2016 6.8% Fund Manager information for ICICI Prudential Equity Arbitrage Fund
Name Since Tenure Nikhil Kabra 29 Dec 20 5.51 Yr. Sharmila D'Silva 31 Jul 22 3.92 Yr. Darshil Dedhia 13 Sep 24 1.8 Yr. Ajaykumar Solanki 23 Aug 24 1.85 Yr. Archana Nair 1 Feb 24 2.41 Yr. Data below for ICICI Prudential Equity Arbitrage Fund as on 30 Jun 26
Asset Allocation
Asset Class Value Cash 94.91% Debt 5.69% Other 0.05% Equity Sector Allocation
Sector Value Financial Services 22.67% Communication Services 9.35% Basic Materials 7.56% Consumer Cyclical 6.61% Industrials 6.02% Health Care 5.39% Energy 5.07% Utility 3.51% Consumer Defensive 2.98% Real Estate 1.44% Technology 0.45% Debt Sector Allocation
Sector Value Cash Equivalent 77.8% Corporate 17.69% Government 5.12% Credit Quality
Rating Value AAA 100% Top Securities Holdings / Portfolio
Name Holding Value Quantity ICICI Pru Money Market Dir Gr
Investment Fund | -16% ₹5,182 Cr 127,933,512 Future on Bharti Airtel Ltd
Derivatives | -5% -₹1,675 Cr 9,081,050
↑ 9,081,050 Bharti Airtel Ltd (Communication Services)
Equity, Since 31 Dec 23 | BHARTIARTL5% ₹1,661 Cr 9,081,050
↓ -931,950 HDFC Bank Ltd (Financial Services)
Equity, Since 30 Nov 21 | HDFCBANK4% ₹1,259 Cr 16,903,300
↑ 2,274,400 Future on HDFC Bank Ltd
Derivatives | -4% -₹1,254 Cr 16,903,300
↑ 16,903,300 Future on Vodafone Idea Ltd
Derivatives | -4% -₹1,206 Cr 853,197,075
↑ 853,197,075 Vodafone Idea Ltd (Communication Services)
Equity, Since 30 Sep 23 | 5328224% ₹1,194 Cr 853,197,075
↓ -1,929,825 Future on Reliance Industries Ltd
Derivatives | -4% -₹1,137 Cr 8,541,500
↑ 8,541,500 Reliance Industries Ltd (Energy)
Equity, Since 31 Aug 18 | RELIANCE3% ₹1,129 Cr 8,541,500
↑ 2,788,000 Future on State Bank of India
Derivatives | -3% -₹961 Cr 9,864,000
↑ 9,864,000 5. UTI Arbitrage Fund
UTI Arbitrage Fund
Growth Launch Date 22 Jun 06 NAV (28 Jul 26) ₹37.2961 ↑ 0.02 (0.06 %) Net Assets (Cr) ₹11,324 on 30 Jun 26 Category Hybrid - Arbitrage AMC UTI Asset Management Company Ltd Rating ☆☆☆ Risk Moderately Low Expense Ratio 0.78 Sharpe Ratio 0.34 Information Ratio 0 Alpha Ratio 0 Min Investment 5,000 Min SIP Investment 500 Exit Load 0-30 Days (0.5%),30 Days and above(NIL) Growth of 10,000 investment over the years.
Date Value 30 Jun 21 ₹10,000 30 Jun 22 ₹10,355 30 Jun 23 ₹10,942 30 Jun 24 ₹11,793 30 Jun 25 ₹12,638 30 Jun 26 ₹13,381 Returns for UTI Arbitrage Fund
absolute basis & more than 1 year are on CAGR (Compound Annual Growth Rate) basis. as on 28 Jul 26 Duration Returns 1 Month 0.5% 3 Month 1.4% 6 Month 2.9% 1 Year 6% 3 Year 6.9% 5 Year 6% 10 Year 15 Year Since launch 6.8% Historical performance (Yearly) on absolute basis
Year Returns 2025 6.5% 2024 7.7% 2023 7.2% 2022 4% 2021 3.9% 2020 4.4% 2019 6.2% 2018 6.2% 2017 5.7% 2016 6.5% Fund Manager information for UTI Arbitrage Fund
Name Since Tenure Amit Sharma 2 Jul 18 8 Yr. Sharwan Kumar Goyal 1 Jan 21 5.5 Yr. Data below for UTI Arbitrage Fund as on 30 Jun 26
Asset Allocation
Asset Class Value Cash 96.72% Debt 3.81% Other 0.06% Equity Sector Allocation
Sector Value Financial Services 30.95% Basic Materials 8.08% Consumer Cyclical 6.66% Health Care 5.43% Communication Services 5.25% Industrials 4.66% Energy 3.41% Consumer Defensive 3.2% Real Estate 1.2% Technology 0.76% Utility 0.71% Debt Sector Allocation
Sector Value Cash Equivalent 79.24% Corporate 17.66% Government 3.64% Credit Quality
Rating Value AAA 99.96% Top Securities Holdings / Portfolio
Name Holding Value Quantity UTI Money Market Dir Gr
Investment Fund | -15% ₹1,660 Cr 5,038,839
↑ 608,752 Future on ICICI Bank Ltd
Derivatives | -5% -₹590 Cr 4,645,900
↑ 4,645,900 ICICI Bank Ltd (Financial Services)
Equity, Since 30 Sep 24 | ICICIBANK5% ₹584 Cr 4,645,900
↑ 1,540,700 HDFC Bank Ltd (Financial Services)
Equity, Since 30 Apr 22 | HDFCBANK5% ₹541 Cr 7,260,650
↓ -371,150 Future on HDFC Bank Ltd
Derivatives | -5% -₹539 Cr 7,260,650
↑ 7,260,650 Future on Reliance Industries Ltd
Derivatives | -3% -₹336 Cr 2,522,500
↑ 2,522,500 Reliance Industries Ltd (Energy)
Equity, Since 31 Aug 23 | RELIANCE3% ₹333 Cr 2,522,500
↑ 343,500 Future on Steel Authority Of India Ltd
Derivatives | -3% -₹295 Cr 14,273,900
↑ 14,273,900 Steel Authority Of India Ltd (Basic Materials)
Equity, Since 31 May 23 | SAIL3% ₹292 Cr 14,273,900
↑ 1,057,500 Future on Bharti Airtel Ltd
Derivatives | -3% -₹287 Cr 1,557,050
↑ 1,557,050 6. SBI Arbitrage Opportunities Fund
SBI Arbitrage Opportunities Fund
Growth Launch Date 3 Nov 06 NAV (28 Jul 26) ₹35.9782 ↑ 0.02 (0.06 %) Net Assets (Cr) ₹45,923 on 30 Jun 26 Category Hybrid - Arbitrage AMC SBI Funds Management Private Limited Rating ☆☆ Risk Moderately Low Expense Ratio 0.95 Sharpe Ratio 0.33 Information Ratio 0 Alpha Ratio 0 Min Investment 5,000 Min SIP Investment 500 Exit Load 0-1 Months (0.5%),1 Months and above(NIL) Growth of 10,000 investment over the years.
Date Value 30 Jun 21 ₹10,000 30 Jun 22 ₹10,407 30 Jun 23 ₹11,063 30 Jun 24 ₹11,910 30 Jun 25 ₹12,753 30 Jun 26 ₹13,499 Returns for SBI Arbitrage Opportunities Fund
absolute basis & more than 1 year are on CAGR (Compound Annual Growth Rate) basis. as on 28 Jul 26 Duration Returns 1 Month 0.5% 3 Month 1.4% 6 Month 2.9% 1 Year 5.9% 3 Year 6.9% 5 Year 6.2% 10 Year 15 Year Since launch 6.7% Historical performance (Yearly) on absolute basis
Year Returns 2025 6.5% 2024 7.5% 2023 7.4% 2022 4.6% 2021 4% 2020 3.5% 2019 6% 2018 6.2% 2017 5.3% 2016 6.4% Fund Manager information for SBI Arbitrage Opportunities Fund
Name Since Tenure Neeraj Kumar 5 Oct 12 13.74 Yr. Ardhendu Bhattacharya 27 Dec 24 1.51 Yr. Data below for SBI Arbitrage Opportunities Fund as on 30 Jun 26
Asset Allocation
Asset Class Value Cash 98.64% Debt 1.84% Other 0.05% Equity Sector Allocation
Sector Value Financial Services 30.08% Basic Materials 8.13% Industrials 7.69% Consumer Cyclical 5.81% Energy 5.26% Communication Services 4.2% Utility 3.85% Consumer Defensive 3.81% Health Care 3.65% Real Estate 1.67% Technology 0.79% Debt Sector Allocation
Sector Value Cash Equivalent 87.8% Corporate 10.39% Government 2.29% Credit Quality
Rating Value AA 1.87% AAA 98.13% Top Securities Holdings / Portfolio
Name Holding Value Quantity SBI Liquid Dir Gr
Investment Fund | -8% ₹3,665 Cr 8,413,178
↑ 2,746,616 SBI Savings Dir Gr
Investment Fund | -8% ₹3,407 Cr 726,722,883 HDFC Bank Ltd (Financial Services)
Equity, Since 30 Apr 22 | HDFCBANK6% ₹2,463 Cr 33,079,600
↑ 3,964,250 Future on HDFC Bank Ltd
Derivatives | -6% -₹2,454 Cr 33,079,600
↑ 33,079,600 Future on ICICI Bank Ltd
Derivatives | -5% -₹2,372 Cr 18,673,900
↑ 18,673,900 ICICI Bank Ltd (Financial Services)
Equity, Since 30 Jun 21 | ICICIBANK5% ₹2,346 Cr 18,673,900
↑ 5,756,100 Future on State Bank of India
Derivatives | -3% -₹1,368 Cr 14,047,500
↑ 14,047,500 State Bank of India (Financial Services)
Equity, Since 31 May 23 | SBIN3% ₹1,355 Cr 14,047,500
↑ 650,250 Future on Reliance Industries Ltd
Derivatives | -3% -₹1,090 Cr 8,193,000
↑ 8,193,000 Reliance Industries Ltd (Energy)
Equity, Since 30 Nov 21 | RELIANCE3% ₹1,082 Cr 8,193,000
↑ 2,581,000 7. Edelweiss Arbitrage Fund
Edelweiss Arbitrage Fund
Growth Launch Date 27 Jun 14 NAV (28 Jul 26) ₹20.6106 ↑ 0.01 (0.05 %) Net Assets (Cr) ₹15,062 on 30 Jun 26 Category Hybrid - Arbitrage AMC Edelweiss Asset Management Limited Rating ☆☆☆☆☆ Risk Moderately Low Expense Ratio 1.07 Sharpe Ratio 0.2 Information Ratio -1.73 Alpha Ratio -0.95 Min Investment 5,000 Min SIP Investment 500 Exit Load 0-30 Days (0.25%),30 Days and above(NIL) Growth of 10,000 investment over the years.
Date Value 30 Jun 21 ₹10,000 30 Jun 22 ₹10,380 30 Jun 23 ₹10,987 30 Jun 24 ₹11,838 30 Jun 25 ₹12,669 30 Jun 26 ₹13,399 Returns for Edelweiss Arbitrage Fund
absolute basis & more than 1 year are on CAGR (Compound Annual Growth Rate) basis. as on 28 Jul 26 Duration Returns 1 Month 0.5% 3 Month 1.5% 6 Month 3% 1 Year 5.9% 3 Year 6.9% 5 Year 6.1% 10 Year 15 Year Since launch 6.2% Historical performance (Yearly) on absolute basis
Year Returns 2025 6.3% 2024 7.7% 2023 7.1% 2022 4.4% 2021 3.8% 2020 4.5% 2019 6.2% 2018 6.1% 2017 5.8% 2016 6.7% Fund Manager information for Edelweiss Arbitrage Fund
Name Since Tenure Bhavesh Jain 27 Jun 14 12.02 Yr. Rahul Dedhia 15 Jan 26 0.46 Yr. Amit Vora 6 Nov 24 1.65 Yr. Hetul Raval 22 Sep 25 0.77 Yr. Data below for Edelweiss Arbitrage Fund as on 30 Jun 26
Asset Allocation
Asset Class Value Cash 93.93% Debt 6.61% Other 0.03% Equity Sector Allocation
Sector Value Financial Services 25.49% Basic Materials 8.42% Industrials 6.65% Consumer Cyclical 5.56% Energy 5.3% Communication Services 5.05% Utility 4.85% Health Care 4.09% Consumer Defensive 2.95% Real Estate 1.89% Technology 0.48% Debt Sector Allocation
Sector Value Cash Equivalent 79.01% Corporate 15.46% Government 6.05% Credit Quality
Rating Value AAA 100% Top Securities Holdings / Portfolio
Name Holding Value Quantity Edelweiss Liquid Dir Gr
Investment Fund | -7% ₹1,101 Cr 3,055,629
↓ -218,214 HDFC Bank Ltd (Financial Services)
Equity, Since 31 Mar 21 | HDFCBANK5% ₹796 Cr 10,686,900
↑ 1,949,050 Hdfc Bank Ltd.30/06/2026
Derivatives | -5% -₹759 Cr 10,248,150
↑ 8,409,500 Edelweiss Money Market Dir Gr
Investment Fund | -4% ₹566 Cr 171,039,989 ICICI Bank Ltd (Financial Services)
Equity, Since 30 Apr 20 | ICICIBANK3% ₹430 Cr 3,420,200
↑ 735,700 Icici Bank Ltd.30/06/2026
Derivatives | -3% -₹414 Cr 3,257,100
↑ 2,751,000 Reliance Industries Ltd (Energy)
Equity, Since 30 Apr 18 | RELIANCE2% ₹357 Cr 2,699,500
↑ 1,114,500 Nmdc Ltd.30/06/2026
Derivatives | -2% -₹343 Cr 38,475,000
↑ 38,475,000 NMDC Ltd (Basic Materials)
Equity, Since 30 Nov 22 | NMDC2% ₹339 Cr 38,583,000
↓ -951,750 Vodafone Idea Ltd.30/06/2026
Derivatives | -2% -₹309 Cr 218,713,500
↑ 218,713,500
Things to Consider as an Investor
1. Risk
As trades are carried out on the stock exchange, there’s no counter party risk involved in these funds. Even though the fund manager is buying and selling shares in cash and futures market, there is no risk exposure to equities as is the case with other diversified equity mutual funds. Though the ride looks smooth, do not get too comfortable with these funds. As more people start trading into arbitrage funds, there will be not many arbitrage opportunities available. The spread between cash and future market prices will erode, leaving little for the arbitrage focused investors.
2. Return
Arbitrage Funds may be a good opportunity to make reasonable returns for those who can understand it and then make the most of it. The fund manager tries to generate an Alpha using price differentials in markets. Historically, arbitrage funds have been found to give returns in the range of 7%-8% over a period of 5-10 years. If you are looking to earn moderate returns via a Portfolio which has a perfect blend of debt and equity in a volatile market, arbitrage funds may be your thing. However, you need to keep one thing in mind that there are no guaranteed returns in arbitrage funds.
3. Cost
Cost becomes an important consideration while evaluating arbitrage funds. These funds charge an annual fee called expense ratio which is expressed as a percentage of the fund’s assets. It includes fund manager’s fee and fund management charges. Due to frequent trading, arbitrage funds would incur huge transaction costs and has a high turnover ratio. Additionally, the fund may levy exit loads for a period of 30 to 60 days to discourage investors from exiting early. All these costs may lead to increase in the expense ratio of the fund. A high expense ratio puts a downward pressure on your take-home returns.
4. Investment Horizon
Arbitrage funds may be suitable for investors having a short to medium term horizon of 3 to 5 years. As these funds charge exit loads, you may consider them only when you are ready to stay invested for a period of at least 3-6 months. At the same time, you need to understand that fund returns are highly dependent on the existence of high volatility. So, choosing a lump sum investment would make sense over Systematic investment plan (SIPs). In absence of volatility, liquid funds may give better returns than arbitrage funds over the same investment horizon. Hence, you need to keep the overall market scenario in mind while choosing arbitrage funds.
5. Financial Goals
If you have short to medium term Financial goals, then arbitrage funds are your thing. Instead of a regular savings bank account, you may use these funds to park excess funds in order to create an emergency fund and earn higher returns on them. In case you were already invested in riskier havens equity funds, then you may begin a Systematic Transfer Plan (STP) from the equity funds to a less risky haven like arbitrage funds as you approach completion of the financial goal. This would reduce your portfolio’s overall risk profile but at the same time reduce the returns also. You cannot expect to earn double-digit returns in arbitrage funds.
How to Invest in Arbitrage Funds Online?
Open Free Investment Account for Lifetime at Fincash.com.
Complete your Registration and KYC Process
Upload Documents (PAN, Aadhaar, etc.). And, You are Ready to Invest!
All efforts have been made to ensure the information provided here is accurate. However, no guarantees are made regarding correctness of data. Please verify with scheme information document before making any investment.
You Might Also Like


AMFI Registration No. 112358 | CIN: U74999MH2016PTC282153
Shepard Technologies Pvt. Ltd. (with ARN code 112358) makes no warranties or representations, express or implied, on products offered through the platform. It accepts no liability for any damages or losses, however caused, in connection with the use of, or on the reliance of its product or related services. Terms and conditions of the website are applicable.
©2026 Shepard Technologies Private Limited. All Rights Reserved
Research Highlights for Invesco India Arbitrage Fund