
 +91-22-48913909
Direct Vs Regular Mutual Fund Investment Plans
While most of the investors invest in Mutual Funds through regular plans, but the rising popularity of direct plans amongst the new investors has led to an increase in demand. Regular plans have been available to the investors for a much longer time than direct Investment plan. The first direct mutual fund plan got introduced in January 1, 2013.
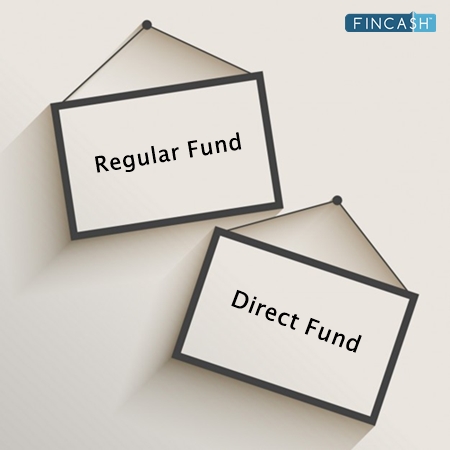
So, for a fair understanding between regular vs direct Mutual Funds, here’s a comparative article that would guide you in choosing the right plan, as per your investment needs.
Regular Vs Direct : Know the Difference
The regular plans and direct plans are not two different schemes, but in fact, they are variants of the same principal scheme offered by AMCs. Both the plans- direct and regular, prominently differs in some parameters that are:
a. Distribution
An investor can buy a mutual fund with a regular plan through various routes like brokers, RTAs such as CAMS, Karvy, third-party securities market intermediaries, directly through the AMC as well as through various representative offices of the fund house. While, direct plans can be bought through limited platforms - a very few third-party securities intermediaries, RTAs such as CAMS/Karvy, and authorized local representatives of the fund house. But, since many prefer to consider buying Mutual Fund Online, both direct and regular plans are available via the online mode as well as the physical/paper-based mode.
b. Expense Ratio
One of the main reasons why direct plans look attractive is due to its lower expense ratio. Mutual funds with regular plans have higher expense ratios compared to direct plans. The lower expense ratio results from the fact that direct plans don’t incur any agent commissions or distributor fees that are payable to brokers or distribution agents of the regular mutual fund schemes. Due to which, the potential returns offered by the direct mutual fund schemes are higher than that of mutual funds with regular plans. The lower expense ratio of direct plans is gaining attraction of the investors, especially amongst new investors.
c. NAV
In mutual fund investment, the value of the investment is expressed as the fund’s Asset Under Management (AUM). As direct mutual plans have a lower expense ratio, the saving in commissions is added to the return of the scheme in for of a higher NAV (Net Asset Value) each day.
Talk to our investment specialist
Therefore, the NAV of a direct plan is relatively higher as compared to regular plans.
| Parameters | Regular Plans | Direct Plans |
|---|---|---|
| Convenience | More | Less |
| NAV | Lower | Higher |
| Expense ratio | Higher (commission to the intermediary) | Lower |
| Returns | Less as the AMC fee is more | More as the expense ratio is lesser |
Fund Selection Methodology used to find 10 funds
Best Direct Mutual Fund Plans
Investors who want to invest in mutual funds with direct plans, here are some of the best performing direct mutual funds as per highest AUM.
Fund NAV Net Assets (Cr) 3 MO (%) 6 MO (%) 1 YR (%) 3 YR (%) 5 YR (%) 2025 (%) Franklin India Feeder - Franklin U S Opportunities Fund - Direct Growth ₹103.251
↑ 0.98 ₹6,185 0.1 6.2 14.8 23.3 9.3 12.4 Franklin Asian Equity Fund - Direct Growth ₹45.8537
↓ -0.31 ₹981 -5.8 3.4 21 21.8 6.7 24.7 Franklin India Opportunities Fund - Direct Growth ₹280.075
↓ -3.75 ₹9,577 -3.1 0.6 -2.6 18 15.6 4.4 IDBI Small Cap Fund - Direct Growth ₹37.3982
↓ -0.95 ₹841 -1.2 9.3 9.5 15.3 15.6 -12.1 DSP Micro Cap Fund - Direct Growth ₹241.59
↓ -5.10 ₹21,467 -2.2 8.7 13.4 15.1 15.9 -1.9 Sundaram SMILE Fund - Direct Growth ₹311.272
↓ -6.46 ₹4,107 -3.8 5 6.3 13.7 14.4 1.5 Edelweiss Economic Resurgence Fund - Direct Growth ₹43.191
↓ -0.37 ₹3,509 -5.4 -4.2 -5.3 13.3 11.1 7 Franklin India Prima Fund - Direct Growth ₹2,952.33
↓ -39.99 ₹12,156 -8 -3.3 -5.5 13.2 11.5 2.4 Franklin Build India Fund - Direct Growth ₹153.196
↓ -1.99 ₹3,024 -9.3 -11.1 -8 13.1 16 4.8 UTI Banking Sector Fund - Direct Growth ₹214.336
↓ -2.89 ₹1,339 -5.7 -4.6 -4.6 11.5 9.3 17.5 Note: Returns up to 1 year are on absolute basis & more than 1 year are on CAGR basis. as on 19 Oct 26 Research Highlights & Commentary of 10 Funds showcased
Commentary Franklin India Feeder - Franklin U S Opportunities Fund - Direct Franklin Asian Equity Fund - Direct Franklin India Opportunities Fund - Direct IDBI Small Cap Fund - Direct DSP Micro Cap Fund - Direct Sundaram SMILE Fund - Direct Edelweiss Economic Resurgence Fund - Direct Franklin India Prima Fund - Direct Franklin Build India Fund - Direct UTI Banking Sector Fund - Direct Point 1 Upper mid AUM (₹6,185 Cr). Bottom quartile AUM (₹981 Cr). Upper mid AUM (₹9,577 Cr). Bottom quartile AUM (₹841 Cr). Highest AUM (₹21,467 Cr). Upper mid AUM (₹4,107 Cr). Lower mid AUM (₹3,509 Cr). Top quartile AUM (₹12,156 Cr). Lower mid AUM (₹3,024 Cr). Bottom quartile AUM (₹1,339 Cr). Point 2 Oldest track record among peers (13 yrs). Established history (13+ yrs). Established history (13+ yrs). Established history (9+ yrs). Established history (13+ yrs). Established history (13+ yrs). Established history (11+ yrs). Established history (13+ yrs). Established history (13+ yrs). Established history (13+ yrs). Point 3 Not Rated. Not Rated. Not Rated. Not Rated. Not Rated. Not Rated. Not Rated. Not Rated. Not Rated. Not Rated. Point 4 Risk profile: High. Risk profile: High. Risk profile: Moderately High. Risk profile: Moderately High. Risk profile: Moderately High. Risk profile: Moderately High. Risk profile: High. Risk profile: Moderately High. Risk profile: High. Risk profile: High. Point 5 5Y return: 9.28% (bottom quartile). 5Y return: 6.71% (bottom quartile). 5Y return: 15.61% (upper mid). 5Y return: 15.56% (upper mid). 5Y return: 15.94% (top quartile). 5Y return: 14.37% (upper mid). 5Y return: 11.10% (lower mid). 5Y return: 11.53% (lower mid). 5Y return: 15.97% (top quartile). 5Y return: 9.35% (bottom quartile). Point 6 3Y return: 23.29% (top quartile). 3Y return: 21.82% (top quartile). 3Y return: 18.00% (upper mid). 3Y return: 15.30% (upper mid). 3Y return: 15.15% (upper mid). 3Y return: 13.68% (lower mid). 3Y return: 13.29% (lower mid). 3Y return: 13.19% (bottom quartile). 3Y return: 13.15% (bottom quartile). 3Y return: 11.49% (bottom quartile). Point 7 1Y return: 14.85% (top quartile). 1Y return: 21.05% (top quartile). 1Y return: -2.60% (lower mid). 1Y return: 9.45% (upper mid). 1Y return: 13.45% (upper mid). 1Y return: 6.30% (upper mid). 1Y return: -5.32% (bottom quartile). 1Y return: -5.52% (bottom quartile). 1Y return: -8.04% (bottom quartile). 1Y return: -4.63% (lower mid). Point 8 Alpha: 0.49 (lower mid). Alpha: 0.00 (bottom quartile). Alpha: 5.54 (upper mid). Alpha: 9.72 (top quartile). Alpha: 13.45 (top quartile). Alpha: 7.94 (upper mid). Alpha: 1.50 (lower mid). Alpha: -3.75 (bottom quartile). Alpha: 0.00 (bottom quartile). Alpha: 6.02 (upper mid). Point 9 Sharpe: 0.64 (upper mid). Sharpe: 1.08 (top quartile). Sharpe: 0.00 (lower mid). Sharpe: 0.57 (upper mid). Sharpe: 0.69 (top quartile). Sharpe: 0.50 (upper mid). Sharpe: -0.23 (bottom quartile). Sharpe: -0.14 (bottom quartile). Sharpe: -0.30 (bottom quartile). Sharpe: -0.07 (lower mid). Point 10 Information ratio: -1.01 (bottom quartile). Information ratio: 0.00 (bottom quartile). Information ratio: 1.49 (top quartile). Information ratio: 0.62 (upper mid). Information ratio: 0.78 (upper mid). Information ratio: 0.35 (lower mid). Information ratio: 1.21 (top quartile). Information ratio: 0.12 (lower mid). Information ratio: 0.00 (bottom quartile). Information ratio: 0.59 (upper mid). Franklin India Feeder - Franklin U S Opportunities Fund - Direct
Franklin Asian Equity Fund - Direct
Franklin India Opportunities Fund - Direct
IDBI Small Cap Fund - Direct
DSP Micro Cap Fund - Direct
Sundaram SMILE Fund - Direct
Edelweiss Economic Resurgence Fund - Direct
Franklin India Prima Fund - Direct
Franklin Build India Fund - Direct
UTI Banking Sector Fund - Direct
Best Regular Mutual Fund Plans
Investors who want to invest in mutual funds with regular plans, here are some of the best performing regular plans to invest in.
Fund NAV Net Assets (Cr) 3 MO (%) 6 MO (%) 1 YR (%) 3 YR (%) 5 YR (%) 2025 (%) DSP World Gold Fund Growth ₹56.879
↓ -0.84 ₹1,665 19.8 -10.9 21.5 51.2 26.2 167.1 DSP US Flexible Equity Fund Growth ₹91.9393
↓ -0.64 ₹1,280 0.3 8 31.5 27.2 17.3 33.8 Kotak Global Emerging Market Fund Growth ₹36.956
↓ -0.23 ₹1,733 -2.5 2.5 26.5 24.5 9.4 39.1 Franklin India Feeder - Franklin U S Opportunities Fund Growth ₹90.3189
↑ 0.85 ₹6,185 -0.2 5.7 13.8 22.1 8.2 11.4 IDBI India Top 100 Equity Fund Growth ₹44.16
↑ 0.05 ₹655 9.2 12.5 15.4 21.9 12.6 Franklin Asian Equity Fund Growth ₹41.4645
↓ -0.29 ₹981 -6 2.9 19.9 20.8 5.8 23.7 HDFC Long Term Advantage Fund Growth ₹595.168
↑ 0.28 ₹1,318 1.2 15.4 35.5 20.6 17.4 SBI Healthcare Opportunities Fund Growth ₹477.031
↓ -5.20 ₹5,870 -6.3 10.8 8.2 20.3 16.1 -3.5 UTI Healthcare Fund Growth ₹314.537
↓ -1.65 ₹1,430 -5.8 10.4 7 19.8 13.6 -3.1 Nippon India US Equity Opportunites Fund Growth ₹42.3268
↑ 0.09 ₹803 3.7 11 16 19.4 10.2 12.1 Note: Returns up to 1 year are on absolute basis & more than 1 year are on CAGR basis. as on 19 Oct 26 Research Highlights & Commentary of 10 Funds showcased
Commentary DSP World Gold Fund DSP US Flexible Equity Fund Kotak Global Emerging Market Fund Franklin India Feeder - Franklin U S Opportunities Fund IDBI India Top 100 Equity Fund Franklin Asian Equity Fund HDFC Long Term Advantage Fund SBI Healthcare Opportunities Fund UTI Healthcare Fund Nippon India US Equity Opportunites Fund Point 1 Upper mid AUM (₹1,665 Cr). Lower mid AUM (₹1,280 Cr). Upper mid AUM (₹1,733 Cr). Highest AUM (₹6,185 Cr). Bottom quartile AUM (₹655 Cr). Bottom quartile AUM (₹981 Cr). Lower mid AUM (₹1,318 Cr). Top quartile AUM (₹5,870 Cr). Upper mid AUM (₹1,430 Cr). Bottom quartile AUM (₹803 Cr). Point 2 Established history (19+ yrs). Established history (14+ yrs). Established history (19+ yrs). Established history (14+ yrs). Established history (14+ yrs). Established history (18+ yrs). Established history (25+ yrs). Established history (21+ yrs). Oldest track record among peers (27 yrs). Established history (11+ yrs). Point 3 Rating: 3★ (upper mid). Top rated. Rating: 3★ (upper mid). Rating: 4★ (upper mid). Rating: 3★ (lower mid). Rating: 5★ (top quartile). Rating: 3★ (lower mid). Rating: 2★ (bottom quartile). Rating: 1★ (bottom quartile). Not Rated. Point 4 Risk profile: High. Risk profile: High. Risk profile: High. Risk profile: High. Risk profile: Moderately High. Risk profile: High. Risk profile: Moderately High. Risk profile: High. Risk profile: High. Risk profile: High. Point 5 5Y return: 26.18% (top quartile). 5Y return: 17.30% (upper mid). 5Y return: 9.40% (bottom quartile). 5Y return: 8.23% (bottom quartile). 5Y return: 12.61% (lower mid). 5Y return: 5.77% (bottom quartile). 5Y return: 17.39% (top quartile). 5Y return: 16.05% (upper mid). 5Y return: 13.62% (upper mid). 5Y return: 10.17% (lower mid). Point 6 3Y return: 51.25% (top quartile). 3Y return: 27.19% (top quartile). 3Y return: 24.50% (upper mid). 3Y return: 22.14% (upper mid). 3Y return: 21.88% (upper mid). 3Y return: 20.75% (lower mid). 3Y return: 20.64% (lower mid). 3Y return: 20.26% (bottom quartile). 3Y return: 19.80% (bottom quartile). 3Y return: 19.43% (bottom quartile). Point 7 1Y return: 21.54% (upper mid). 1Y return: 31.45% (top quartile). 1Y return: 26.46% (upper mid). 1Y return: 13.79% (bottom quartile). 1Y return: 15.39% (lower mid). 1Y return: 19.94% (upper mid). 1Y return: 35.51% (top quartile). 1Y return: 8.24% (bottom quartile). 1Y return: 6.95% (bottom quartile). 1Y return: 16.03% (lower mid). Point 8 Alpha: 4.06 (top quartile). Alpha: -4.45 (bottom quartile). Alpha: -5.87 (bottom quartile). Alpha: -0.43 (lower mid). Alpha: 2.11 (upper mid). Alpha: 0.00 (lower mid). Alpha: 1.75 (upper mid). Alpha: 3.63 (top quartile). Alpha: 0.86 (upper mid). Alpha: -8.32 (bottom quartile). Point 9 Sharpe: 0.67 (bottom quartile). Sharpe: 1.20 (top quartile). Sharpe: 1.09 (upper mid). Sharpe: 0.59 (bottom quartile). Sharpe: 1.09 (upper mid). Sharpe: 1.04 (upper mid). Sharpe: 2.27 (top quartile). Sharpe: 0.95 (lower mid). Sharpe: 0.78 (lower mid). Sharpe: 0.71 (bottom quartile). Point 10 Information ratio: -0.80 (lower mid). Information ratio: -0.08 (upper mid). Information ratio: -0.81 (bottom quartile). Information ratio: -1.25 (bottom quartile). Information ratio: 0.14 (top quartile). Information ratio: 0.00 (upper mid). Information ratio: -0.15 (lower mid). Information ratio: 0.10 (top quartile). Information ratio: 0.06 (upper mid). Information ratio: -1.58 (bottom quartile). DSP World Gold Fund
DSP US Flexible Equity Fund
Kotak Global Emerging Market Fund
Franklin India Feeder - Franklin U S Opportunities Fund
IDBI India Top 100 Equity Fund
Franklin Asian Equity Fund
HDFC Long Term Advantage Fund
SBI Healthcare Opportunities Fund
UTI Healthcare Fund
Nippon India US Equity Opportunites Fund
How to Invest in Mutual Funds Online?
Open Free Investment Account for Lifetime at Fincash.com.
Complete your Registration and KYC Process
Upload Documents (PAN, Aadhaar, etc.). And, You are Ready to Invest!
All efforts have been made to ensure the information provided here is accurate. However, no guarantees are made regarding correctness of data. Please verify with scheme information document before making any investment.









AMFI Registration No. 112358 | CIN: U74999MH2016PTC282153
Shepard Technologies Pvt. Ltd. (with ARN code 112358) makes no warranties or representations, express or implied, on products offered through the platform. It accepts no liability for any damages or losses, however caused, in connection with the use of, or on the reliance of its product or related services. Terms and conditions of the website are applicable.
©2026 Shepard Technologies Private Limited. All Rights Reserved