7 શ્રેષ્ઠ આર્બિટ્રેજ મ્યુચ્યુઅલ ફંડ્સ 2022
સામાન્ય રીતે, આર્બિટ્રેજ ફંડમાં રોકાણ કરવા ઇચ્છુક લોકો શ્રેષ્ઠ આર્બિટ્રેજ ફંડ્સ શોધે છે. પરંતુ આર્બિટ્રેજ ફંડ્સ શું છે?
આર્બિટ્રેજ ફંડ એ ભારતમાં લોકપ્રિય ટૂંકા ગાળાના નાણાકીય રોકાણ છે. આર્બિટ્રેજ ફંડ્સ છેમ્યુચ્યુઅલ ફંડ જે રોકડ વચ્ચેના તફાવતની કિંમતનો લાભ લે છેબજાર અને મ્યુચ્યુઅલ ફંડ રિટર્ન જનરેટ કરવા માટે ડેરિવેટિવ માર્કેટ.

આર્બિટ્રેજ ફંડ્સ દ્વારા જનરેટ થતું વળતર શેરબજારની અસ્થિરતા પર આધારિત છે. આર્બિટ્રેજ મ્યુચ્યુઅલ ફંડ સ્વભાવમાં વર્ણસંકર હોય છે અને ઉચ્ચ અથવા સતત અસ્થિરતાના સમયમાં, આ ફંડ્સ રોકાણકારોને પ્રમાણમાં જોખમ મુક્ત વળતર આપે છે. પહેલાંરોકાણ આ ફંડ્સમાં આર્બિટ્રેજ ફંડ ટેક્સેશનને સમજવું અને શ્રેષ્ઠ આર્બિટ્રેજ ફંડ્સને જાણવું મહત્વપૂર્ણ છે.
આર્બિટ્રેજ ફંડમાં શા માટે રોકાણ કરવું?
અહીં કેટલાક છેરોકાણના ફાયદા આર્બિટ્રેજ ફંડમાં:
1. નગણ્ય જોખમ
આર્બિટ્રેજ ફંડ 100% જોખમ-મુક્ત નથી પરંતુ તે નજીવું જોખમ વહન કરે છે. તેઓબેંક બજારોમાં થઈ રહેલી ખોટી કિંમત પર. આ આપે છેરોકાણકાર અન્યની તુલનામાં સલામત વિકલ્પટૂંકા ગાળાના ભંડોળ કારણ કે આ ફંડ્સ બજારની અસ્થિરતા દરમિયાન વધુ સારું વળતર આપે છે.
2. વળતર
આ ફંડ્સ સામાન્ય રીતે રોકાણ કરેલી રકમના લગભગ 7-9% વળતર આપે છે. ની સરખામણીમાં આ વધારે છેલિક્વિડ ફંડ્સ અથવા ઓછા દરના વાતાવરણમાં ટૂંકા ગાળાના ડેટ ફંડ્સ (જ્યારે આરબીઆઈ દર ઘટાડી રહી છે).
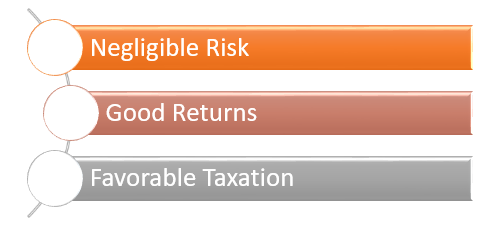
આમ, આર્બિટ્રેજ ફંડ્સને રોકાણનો આકર્ષક વિકલ્પ બનાવવો.
3. અનુકૂળ કરવેરા
આ ફંડ્સમાં રોકાણ કરવાનો સૌથી મોટો ફાયદો ટેક્સ ટ્રીટમેન્ટ છે.ઇક્વિટી ફંડ્સ લાંબા ગાળા માટે આકર્ષિત કરોપાટનગર લાભ જો નફો INR 1 લાખ સુધી થાય છે, તો તે કરમુક્ત હેઠળ ગણવામાં આવે છે. INR 1 લાખથી વધુના નફા પર 10% ટેક્સ લાગુ થાય છે.
આર્બિટ્રેજ ફંડ ટેક્સેશન
ઉપર જણાવ્યા મુજબ, આ ભંડોળ પર અનુકૂળ કર લાદવામાં આવે છે. તેઓ સારાનું સંયોજન હોવાનું કહેવાય છેડેટ ફંડ વળતર અને ઇક્વિટી મ્યુચ્યુઅલ ફંડની કર સારવાર. જો ફંડના 65% થી વધુનું રોકાણ ઇક્વિટીમાં કરવામાં આવે તો તેને કરવેરા માટે ઇક્વિટી ફંડ તરીકે ગણવામાં આવશે. બજેટ 2018 મુજબ, ઇક્વિટી ફંડ્સ લોંગ ટર્મ કેપિટલ ગેઇન્સ (LTCG) આકર્ષશે. રોકાણકારો પર લાંબા ગાળા માટે 10% (કોઈ ઇન્ડેક્સેશન વિના) ટેક્સ લાગશેમૂડી લાભ કર INR 1 લાખ સુધીના લાભો કરમુક્ત છે. INR 1 લાખથી વધુના નફા પર 10% ટેક્સ લાગુ થાય છે. ઇક્વિટીમાંથી ટૂંકા ગાળાના મૂડી લાભો 15% રાહત દરને આકર્ષે છે.
તેથી, જો તમે ટૂંકા ગાળાના રોકાણ અને તેની સાથે કર લાભો મેળવવાનું આયોજન કરી રહ્યાં હોવ, તો આર્બિટ્રેજ ફંડમાં રોકાણ કરવાનું વિચારો.
Talk to our investment specialist
ટોચના 7 આર્બિટ્રેજ મ્યુચ્યુઅલ ફંડ્સ 2022 - 2023
Fund NAV Net Assets (Cr) 3 MO (%) 6 MO (%) 1 YR (%) 3 YR (%) 5 YR (%) 2024 (%) Invesco India Arbitrage Fund Growth ₹34.0037
↑ 0.00 ₹28,526 1.6 2.9 6 6.9 6.3 6.5 Kotak Equity Arbitrage Fund Growth ₹39.9223
↑ 0.01 ₹72,409 1.6 3 6 7 6.2 6.4 ICICI Prudential Equity Arbitrage Fund Growth ₹36.5476
↑ 0.01 ₹33,423 1.6 2.9 6 6.9 6.1 6.5 HDFC Arbitrage Fund Growth ₹32.626
↑ 0.00 ₹23,772 1.6 2.9 6 6.9 6 6.3 UTI Arbitrage Fund Growth ₹37.3256
↑ 0.01 ₹11,324 1.5 2.9 6 7 6 6.5 SBI Arbitrage Opportunities Fund Growth ₹36.0104
↑ 0.00 ₹45,923 1.5 2.9 5.9 6.9 6.2 6.5 Nippon India Arbitrage Fund Growth ₹28.2414
↑ 0.01 ₹16,638 1.6 2.9 5.9 6.8 5.9 6.2 Note: Returns up to 1 year are on absolute basis & more than 1 year are on CAGR basis. as on 31 Jul 26 Research Highlights & Commentary of 7 Funds showcased
Commentary Invesco India Arbitrage Fund Kotak Equity Arbitrage Fund ICICI Prudential Equity Arbitrage Fund HDFC Arbitrage Fund UTI Arbitrage Fund SBI Arbitrage Opportunities Fund Nippon India Arbitrage Fund Point 1 Lower mid AUM (₹28,526 Cr). Highest AUM (₹72,409 Cr). Upper mid AUM (₹33,423 Cr). Lower mid AUM (₹23,772 Cr). Bottom quartile AUM (₹11,324 Cr). Upper mid AUM (₹45,923 Cr). Bottom quartile AUM (₹16,638 Cr). Point 2 Established history (19+ yrs). Oldest track record among peers (20 yrs). Established history (19+ yrs). Established history (18+ yrs). Established history (20+ yrs). Established history (19+ yrs). Established history (15+ yrs). Point 3 Rating: 3★ (lower mid). Top rated. Rating: 4★ (upper mid). Rating: 3★ (lower mid). Rating: 3★ (bottom quartile). Rating: 2★ (bottom quartile). Rating: 4★ (upper mid). Point 4 Risk profile: Moderately Low. Risk profile: Moderately Low. Risk profile: Moderate. Risk profile: Moderately Low. Risk profile: Moderately Low. Risk profile: Moderately Low. Risk profile: Moderately Low. Point 5 5Y return: 6.26% (top quartile). 5Y return: 6.23% (upper mid). 5Y return: 6.06% (lower mid). 5Y return: 6.02% (bottom quartile). 5Y return: 6.05% (lower mid). 5Y return: 6.25% (upper mid). 5Y return: 5.95% (bottom quartile). Point 6 3Y return: 6.93% (upper mid). 3Y return: 7.02% (top quartile). 3Y return: 6.91% (lower mid). 3Y return: 6.90% (bottom quartile). 3Y return: 6.96% (upper mid). 3Y return: 6.91% (lower mid). 3Y return: 6.75% (bottom quartile). Point 7 1Y return: 6.03% (top quartile). 1Y return: 5.99% (upper mid). 1Y return: 5.99% (upper mid). 1Y return: 5.97% (lower mid). 1Y return: 5.97% (lower mid). 1Y return: 5.93% (bottom quartile). 1Y return: 5.90% (bottom quartile). Point 8 1M return: 0.62% (upper mid). 1M return: 0.62% (upper mid). 1M return: 0.64% (top quartile). 1M return: 0.58% (bottom quartile). 1M return: 0.60% (lower mid). 1M return: 0.61% (lower mid). 1M return: 0.59% (bottom quartile). Point 9 Alpha: 0.00 (top quartile). Alpha: 0.00 (upper mid). Alpha: 0.00 (upper mid). Alpha: 0.00 (lower mid). Alpha: 0.00 (lower mid). Alpha: 0.00 (bottom quartile). Alpha: 0.00 (bottom quartile). Point 10 Sharpe: 0.47 (top quartile). Sharpe: 0.31 (lower mid). Sharpe: 0.29 (bottom quartile). Sharpe: 0.36 (upper mid). Sharpe: 0.34 (upper mid). Sharpe: 0.33 (lower mid). Sharpe: 0.22 (bottom quartile). Invesco India Arbitrage Fund
Kotak Equity Arbitrage Fund
ICICI Prudential Equity Arbitrage Fund
HDFC Arbitrage Fund
UTI Arbitrage Fund
SBI Arbitrage Opportunities Fund
Nippon India Arbitrage Fund
*નીચે સૉર્ટ કરેલ આર્બિટ્રેજ ફંડ્સની યાદી છેછેલ્લું 1 વર્ષનું વળતર અને AUM > 100 કરોડ ધરાવતું.
The primary investment objective of the scheme is to generate income through arbitrage opportunities emerging out of mis-pricing between the cash market and the derivatives market and through deployment of surplus cash in fixed income instruments. Below is the key information for Invesco India Arbitrage Fund Returns up to 1 year are on The investment objective of the scheme is to generate capital appreciation and income by predominantly investing in arbitrage opportunities in the cash and derivatives segment of the equity market, and by investing the balance in debt and money market instruments. However, there is no assurance that the objective of the scheme will be realized Research Highlights for Kotak Equity Arbitrage Fund Below is the key information for Kotak Equity Arbitrage Fund Returns up to 1 year are on The investment objective of Income Optimiser Plan under the scheme is to seek to generate low volatility returns by using arbitrage and other derivative strategies in equity markets and investments in short-term debt portfolio. Research Highlights for ICICI Prudential Equity Arbitrage Fund Below is the key information for ICICI Prudential Equity Arbitrage Fund Returns up to 1 year are on "To generate income through arbitrage opportunities between cash and derivative market and arbitrage opportunities within the derivative segment and by deployment of surplus cash in debt securities and money market instruments." Research Highlights for HDFC Arbitrage Fund Below is the key information for HDFC Arbitrage Fund Returns up to 1 year are on (Erstwhile UTI SPREAD Fund) The investment objective of the scheme is to provide capital appreciation and dividend distribution through arbitrage opportunities arising out of price differences between the cash and derivative market by investing predominantly in equity and equity-related securities, derivatives and the balance portion in debt securities. However, there can be no assurance that the investment objective of the scheme will be realised. Research Highlights for UTI Arbitrage Fund Below is the key information for UTI Arbitrage Fund Returns up to 1 year are on To provide capital appreciation and regular income for unitholders by identifying profitable arbitrage opportunities between the spot and derivative market segments as also through investment of surplus cash in debt and money market instruments. Research Highlights for SBI Arbitrage Opportunities Fund Below is the key information for SBI Arbitrage Opportunities Fund Returns up to 1 year are on (Erstwhile Reliance Arbitrage Advantage Fund) The investment objective of the scheme is to generate income by taking advantage of the arbitrage opportunities that potentially exists between cash and derivative market and within the derivative segment along with investments in debt securities & money market instruments. Research Highlights for Nippon India Arbitrage Fund Below is the key information for Nippon India Arbitrage Fund Returns up to 1 year are on 1. Invesco India Arbitrage Fund
Invesco India Arbitrage Fund
Growth Launch Date 30 Apr 07 NAV (31 Jul 26) ₹34.0037 ↑ 0.00 (0.01 %) Net Assets (Cr) ₹28,526 on 30 Jun 26 Category Hybrid - Arbitrage AMC Invesco Asset Management (India) Private Ltd Rating ☆☆☆ Risk Moderately Low Expense Ratio 1.06 Sharpe Ratio 0.47 Information Ratio 0 Alpha Ratio 0 Min Investment 5,000 Min SIP Investment 500 Exit Load 0-15 Days (0.5%),15 Days and above(NIL) Growth of 10,000 investment over the years.
Date Value 31 Jul 21 ₹10,000 31 Jul 22 ₹10,368 31 Jul 23 ₹11,077 31 Jul 24 ₹11,946 31 Jul 25 ₹12,775 31 Jul 26 ₹13,545 Returns for Invesco India Arbitrage Fund
absolute basis & more than 1 year are on CAGR (Compound Annual Growth Rate) basis. as on 31 Jul 26 Duration Returns 1 Month 0.6% 3 Month 1.6% 6 Month 2.9% 1 Year 6% 3 Year 6.9% 5 Year 6.3% 10 Year 15 Year Since launch 6.6% Historical performance (Yearly) on absolute basis
Year Returns 2024 6.5% 2023 7.6% 2022 7.4% 2021 5.1% 2020 3.5% 2019 4.3% 2018 5.9% 2017 5.9% 2016 5.5% 2015 6.5% Fund Manager information for Invesco India Arbitrage Fund
Name Since Tenure Deepak Gupta 11 Nov 21 4.64 Yr. Pradeep Sukte 25 Jun 26 0.01 Yr. Data below for Invesco India Arbitrage Fund as on 30 Jun 26
Asset Allocation
Asset Class Value Cash 97.74% Debt 2.79% Equity Sector Allocation
Sector Value Financial Services 29.67% Basic Materials 6.63% Consumer Cyclical 5.89% Industrials 5.55% Energy 5.47% Health Care 4.85% Consumer Defensive 3.25% Communication Services 3.2% Utility 2.3% Real Estate 0.73% Technology 0.54% Debt Sector Allocation
Sector Value Cash Equivalent 81.55% Corporate 17.35% Government 2.28% Credit Quality
Rating Value AA 1.84% AAA 98.16% Top Securities Holdings / Portfolio
Name Holding Value Quantity Future on BANK Index
- | -18% -₹4,993 Cr 233,489,475
↑ 135,632,150 Invesco India Liquid Dir Gr
Investment Fund | -7% ₹1,886 Cr 4,932,898
↓ -1,205,000 HDFC Bank Ltd (Financial Services)
Equity, Since 31 Jan 23 | HDFCBANK6% ₹1,767 Cr 23,732,950
↑ 14,076,050 ICICI Bank Ltd (Financial Services)
Equity, Since 31 Oct 24 | ICICIBANK6% ₹1,583 Cr 12,601,400
↑ 5,239,500 Invesco India Money Market Dir Gr
Investment Fund | -5% ₹1,467 Cr 4,415,910 Future on Reliance Industries Ltd
Derivatives | -3% -₹711 Cr 5,343,000
↑ 5,343,000 Reliance Industries Ltd (Energy)
Equity, Since 31 Dec 22 | RELIANCE3% ₹706 Cr 5,343,000
↑ 1,528,500 Future on Bharat Heavy Electricals Ltd
Derivatives | -2% -₹655 Cr 15,584,625
↑ 15,584,625 Bharat Heavy Electricals Ltd (Industrials)
Equity, Since 31 Mar 23 | BHEL2% ₹649 Cr 15,584,625
↓ -2,000,250 State Bank of India (Financial Services)
Equity, Since 31 Jan 23 | SBIN2% ₹641 Cr 6,649,500
↓ -2,771,250 2. Kotak Equity Arbitrage Fund
Kotak Equity Arbitrage Fund
Growth Launch Date 29 Sep 05 NAV (31 Jul 26) ₹39.9223 ↑ 0.01 (0.02 %) Net Assets (Cr) ₹72,409 on 30 Jun 26 Category Hybrid - Arbitrage AMC Kotak Mahindra Asset Management Co Ltd Rating ☆☆☆☆ Risk Moderately Low Expense Ratio 0.97 Sharpe Ratio 0.31 Information Ratio 0 Alpha Ratio 0 Min Investment 5,000 Min SIP Investment 500 Exit Load 0-30 Days (0.25%),30 Days and above(NIL) Growth of 10,000 investment over the years.
Date Value 31 Jul 21 ₹10,000 31 Jul 22 ₹10,349 31 Jul 23 ₹11,034 31 Jul 24 ₹11,925 31 Jul 25 ₹12,761 31 Jul 26 ₹13,525 Returns for Kotak Equity Arbitrage Fund
absolute basis & more than 1 year are on CAGR (Compound Annual Growth Rate) basis. as on 31 Jul 26 Duration Returns 1 Month 0.6% 3 Month 1.6% 6 Month 3% 1 Year 6% 3 Year 7% 5 Year 6.2% 10 Year 15 Year Since launch 6.9% Historical performance (Yearly) on absolute basis
Year Returns 2024 6.4% 2023 7.8% 2022 7.4% 2021 4.5% 2020 4% 2019 4.3% 2018 6.1% 2017 6.3% 2016 5.8% 2015 6.7% Fund Manager information for Kotak Equity Arbitrage Fund
Name Since Tenure Hiten Shah 3 Oct 19 6.75 Yr. Data below for Kotak Equity Arbitrage Fund as on 30 Jun 26
Asset Allocation
Asset Class Value Cash 92.61% Debt 8% Other 0.06% Equity Sector Allocation
Sector Value Financial Services 26.85% Consumer Cyclical 7.94% Basic Materials 7.71% Energy 6.55% Industrials 6.48% Utility 4.97% Health Care 4.21% Communication Services 3.84% Consumer Defensive 3.45% Technology 0.96% Debt Sector Allocation
Sector Value Cash Equivalent 79.27% Corporate 16.25% Government 5.08% Credit Quality
Rating Value AAA 100% Top Securities Holdings / Portfolio
Name Holding Value Quantity Kotak Money Market Dir Gr
Investment Fund | -11% ₹8,159 Cr 17,061,028 Kotak Savings Fund Dir Gr
Investment Fund | -5% ₹3,915 Cr 826,303,438
↓ -31,700,680 ICICI Bank Ltd (Financial Services)
Equity, Since 31 Dec 19 | ICICIBANK5% ₹3,562 Cr 28,349,300
↑ 12,098,800 ICICI Bank Ltd.-JUN2026
Derivatives | -5% -₹3,407 Cr 26,824,000
↑ 23,160,900 HDFC Bank Ltd (Financial Services)
Equity, Since 30 Apr 22 | HDFCBANK4% ₹3,219 Cr 43,231,450
↑ 7,065,700 HDFC Bank Ltd.-JUN2026
Derivatives | -4% -₹2,898 Cr 39,114,350
↑ 25,024,450 Reliance Industries Ltd (Energy)
Equity, Since 31 May 18 | RELIANCE3% ₹2,405 Cr 18,201,500
↑ 11,245,500 RELIANCE INDUSTRIES LTD.-JUN2026
Derivatives | -3% -₹2,319 Cr 17,438,500
↑ 13,632,000 Kotak Low Duration Dir Gr
Investment Fund | -3% ₹2,050 Cr 5,338,100
↑ 377,270 Axis Bank Ltd (Financial Services)
Equity, Since 30 Jun 18 | AXISBANK2% ₹1,474 Cr 11,455,000
↓ -410,625 3. ICICI Prudential Equity Arbitrage Fund
ICICI Prudential Equity Arbitrage Fund
Growth Launch Date 30 Dec 06 NAV (31 Jul 26) ₹36.5476 ↑ 0.01 (0.02 %) Net Assets (Cr) ₹33,423 on 30 Jun 26 Category Hybrid - Arbitrage AMC ICICI Prudential Asset Management Company Limited Rating ☆☆☆☆ Risk Moderate Expense Ratio 0.9 Sharpe Ratio 0.29 Information Ratio 0 Alpha Ratio 0 Min Investment 5,000 Min SIP Investment 1,000 Exit Load 0-1 Months (0.25%),1 Months and above(NIL) Growth of 10,000 investment over the years.
Date Value 31 Jul 21 ₹10,000 31 Jul 22 ₹10,319 31 Jul 23 ₹10,981 31 Jul 24 ₹11,831 31 Jul 25 ₹12,660 31 Jul 26 ₹13,419 Returns for ICICI Prudential Equity Arbitrage Fund
absolute basis & more than 1 year are on CAGR (Compound Annual Growth Rate) basis. as on 31 Jul 26 Duration Returns 1 Month 0.6% 3 Month 1.6% 6 Month 2.9% 1 Year 6% 3 Year 6.9% 5 Year 6.1% 10 Year 15 Year Since launch 6.8% Historical performance (Yearly) on absolute basis
Year Returns 2024 6.5% 2023 7.6% 2022 7.1% 2021 4.2% 2020 3.9% 2019 4.3% 2018 5.9% 2017 6.2% 2016 5.5% 2015 6.8% Fund Manager information for ICICI Prudential Equity Arbitrage Fund
Name Since Tenure Nikhil Kabra 29 Dec 20 5.51 Yr. Sharmila D'Silva 31 Jul 22 3.92 Yr. Darshil Dedhia 13 Sep 24 1.8 Yr. Ajaykumar Solanki 23 Aug 24 1.85 Yr. Archana Nair 1 Feb 24 2.41 Yr. Data below for ICICI Prudential Equity Arbitrage Fund as on 30 Jun 26
Asset Allocation
Asset Class Value Cash 94.91% Debt 5.69% Other 0.05% Equity Sector Allocation
Sector Value Financial Services 22.67% Communication Services 9.35% Basic Materials 7.56% Consumer Cyclical 6.61% Industrials 6.02% Health Care 5.39% Energy 5.07% Utility 3.51% Consumer Defensive 2.98% Real Estate 1.44% Technology 0.45% Debt Sector Allocation
Sector Value Cash Equivalent 77.8% Corporate 17.69% Government 5.12% Credit Quality
Rating Value AAA 100% Top Securities Holdings / Portfolio
Name Holding Value Quantity ICICI Pru Money Market Dir Gr
Investment Fund | -16% ₹5,182 Cr 127,933,512 Future on Bharti Airtel Ltd
Derivatives | -5% -₹1,675 Cr 9,081,050
↑ 9,081,050 Bharti Airtel Ltd (Communication Services)
Equity, Since 31 Dec 23 | BHARTIARTL5% ₹1,661 Cr 9,081,050
↓ -931,950 HDFC Bank Ltd (Financial Services)
Equity, Since 30 Nov 21 | HDFCBANK4% ₹1,259 Cr 16,903,300
↑ 2,274,400 Future on HDFC Bank Ltd
Derivatives | -4% -₹1,254 Cr 16,903,300
↑ 16,903,300 Future on Vodafone Idea Ltd
Derivatives | -4% -₹1,206 Cr 853,197,075
↑ 853,197,075 Vodafone Idea Ltd (Communication Services)
Equity, Since 30 Sep 23 | 5328224% ₹1,194 Cr 853,197,075
↓ -1,929,825 Future on Reliance Industries Ltd
Derivatives | -4% -₹1,137 Cr 8,541,500
↑ 8,541,500 Reliance Industries Ltd (Energy)
Equity, Since 31 Aug 18 | RELIANCE3% ₹1,129 Cr 8,541,500
↑ 2,788,000 Future on State Bank of India
Derivatives | -3% -₹961 Cr 9,864,000
↑ 9,864,000 4. HDFC Arbitrage Fund
HDFC Arbitrage Fund
Growth Launch Date 23 Oct 07 NAV (31 Jul 26) ₹32.626 ↑ 0.00 (0.01 %) Net Assets (Cr) ₹23,772 on 30 Jun 26 Category Hybrid - Arbitrage AMC HDFC Asset Management Company Limited Rating ☆☆☆ Risk Moderately Low Expense Ratio 0.97 Sharpe Ratio 0.36 Information Ratio 0 Alpha Ratio 0 Min Investment 100,000 Min SIP Investment 300 Exit Load 0-1 Months (0.25%),1 Months and above(NIL) Growth of 10,000 investment over the years.
Date Value 31 Jul 21 ₹10,000 31 Jul 22 ₹10,301 31 Jul 23 ₹10,964 31 Jul 24 ₹11,823 31 Jul 25 ₹12,639 31 Jul 26 ₹13,394 Returns for HDFC Arbitrage Fund
absolute basis & more than 1 year are on CAGR (Compound Annual Growth Rate) basis. as on 31 Jul 26 Duration Returns 1 Month 0.6% 3 Month 1.6% 6 Month 2.9% 1 Year 6% 3 Year 6.9% 5 Year 6% 10 Year 15 Year Since launch 6.5% Historical performance (Yearly) on absolute basis
Year Returns 2024 6.3% 2023 7.7% 2022 7.2% 2021 4.2% 2020 3.6% 2019 3.7% 2018 6% 2017 5.7% 2016 5.3% 2015 6.6% Fund Manager information for HDFC Arbitrage Fund
Name Since Tenure Anil Bamboli 1 Feb 22 4.41 Yr. Arun Agarwal 24 Aug 20 5.85 Yr. Dhruv Muchhal 22 Jun 23 3.02 Yr. Nandita Menezes 29 Mar 25 1.25 Yr. Data below for HDFC Arbitrage Fund as on 30 Jun 26
Asset Allocation
Asset Class Value Cash 92.8% Debt 7.74% Other 0.05% Equity Sector Allocation
Sector Value Financial Services 23.93% Basic Materials 9.82% Consumer Cyclical 7.47% Energy 6.54% Industrials 6.04% Consumer Defensive 4.02% Communication Services 3.36% Health Care 3.21% Utility 3.01% Real Estate 0.7% Technology 0.68% Debt Sector Allocation
Sector Value Cash Equivalent 78.24% Corporate 18.35% Government 3.94% Credit Quality
Rating Value AAA 100% Top Securities Holdings / Portfolio
Name Holding Value Quantity HDFC Money Market Dir Gr
Investment Fund | -8% ₹2,064 Cr 3,354,179 HDFC Bank Ltd (Financial Services)
Equity, Since 31 Jan 23 | HDFCBANK6% ₹1,553 Cr 20,863,200
↑ 143,600 Hdfc Bank Ltd.
Derivatives | -6% -₹1,547 Cr 20,863,200
↑ 20,863,200 Reliance Industries Ltd.
Derivatives | -4% -₹1,111 Cr 8,355,000
↑ 8,355,000 Reliance Industries Ltd (Energy)
Equity, Since 31 Oct 21 | RELIANCE4% ₹1,104 Cr 8,355,000
↑ 522,000 Icici Bank Ltd.
Derivatives | -4% -₹1,004 Cr 7,896,700
↑ 7,896,700 ICICI Bank Ltd (Financial Services)
Equity, Since 30 Jun 24 | ICICIBANK4% ₹992 Cr 7,896,700
↑ 1,415,400 HDFC Liquid Dir Gr
Investment Fund | -4% ₹933 Cr 1,704,922 Bharti Airtel Ltd.
Derivatives | -2% -₹616 Cr 3,339,250
↑ 3,339,250 Jsw Steel Ltd.
Derivatives | -2% -₹613 Cr 4,739,175
↑ 4,739,175 5. UTI Arbitrage Fund
UTI Arbitrage Fund
Growth Launch Date 22 Jun 06 NAV (31 Jul 26) ₹37.3256 ↑ 0.01 (0.02 %) Net Assets (Cr) ₹11,324 on 30 Jun 26 Category Hybrid - Arbitrage AMC UTI Asset Management Company Ltd Rating ☆☆☆ Risk Moderately Low Expense Ratio 0.78 Sharpe Ratio 0.34 Information Ratio 0 Alpha Ratio 0 Min Investment 5,000 Min SIP Investment 500 Exit Load 0-30 Days (0.5%),30 Days and above(NIL) Growth of 10,000 investment over the years.
Date Value 31 Jul 21 ₹10,000 31 Jul 22 ₹10,313 31 Jul 23 ₹10,961 31 Jul 24 ₹11,822 31 Jul 25 ₹12,658 31 Jul 26 ₹13,414 Returns for UTI Arbitrage Fund
absolute basis & more than 1 year are on CAGR (Compound Annual Growth Rate) basis. as on 31 Jul 26 Duration Returns 1 Month 0.6% 3 Month 1.5% 6 Month 2.9% 1 Year 6% 3 Year 7% 5 Year 6% 10 Year 15 Year Since launch 6.8% Historical performance (Yearly) on absolute basis
Year Returns 2024 6.5% 2023 7.7% 2022 7.2% 2021 4% 2020 3.9% 2019 4.4% 2018 6.2% 2017 6.2% 2016 5.7% 2015 6.5% Fund Manager information for UTI Arbitrage Fund
Name Since Tenure Amit Sharma 2 Jul 18 8 Yr. Sharwan Kumar Goyal 1 Jan 21 5.5 Yr. Data below for UTI Arbitrage Fund as on 30 Jun 26
Asset Allocation
Asset Class Value Cash 96.72% Debt 3.81% Other 0.06% Equity Sector Allocation
Sector Value Financial Services 30.95% Basic Materials 8.08% Consumer Cyclical 6.66% Health Care 5.43% Communication Services 5.25% Industrials 4.66% Energy 3.41% Consumer Defensive 3.2% Real Estate 1.2% Technology 0.76% Utility 0.71% Debt Sector Allocation
Sector Value Cash Equivalent 79.24% Corporate 17.66% Government 3.64% Credit Quality
Rating Value AAA 99.96% Top Securities Holdings / Portfolio
Name Holding Value Quantity UTI Money Market Dir Gr
Investment Fund | -15% ₹1,660 Cr 5,038,839
↑ 608,752 Future on ICICI Bank Ltd
Derivatives | -5% -₹590 Cr 4,645,900
↑ 4,645,900 ICICI Bank Ltd (Financial Services)
Equity, Since 30 Sep 24 | ICICIBANK5% ₹584 Cr 4,645,900
↑ 1,540,700 HDFC Bank Ltd (Financial Services)
Equity, Since 30 Apr 22 | HDFCBANK5% ₹541 Cr 7,260,650
↓ -371,150 Future on HDFC Bank Ltd
Derivatives | -5% -₹539 Cr 7,260,650
↑ 7,260,650 Future on Reliance Industries Ltd
Derivatives | -3% -₹336 Cr 2,522,500
↑ 2,522,500 Reliance Industries Ltd (Energy)
Equity, Since 31 Aug 23 | RELIANCE3% ₹333 Cr 2,522,500
↑ 343,500 Future on Steel Authority Of India Ltd
Derivatives | -3% -₹295 Cr 14,273,900
↑ 14,273,900 Steel Authority Of India Ltd (Basic Materials)
Equity, Since 31 May 23 | SAIL3% ₹292 Cr 14,273,900
↑ 1,057,500 Future on Bharti Airtel Ltd
Derivatives | -3% -₹287 Cr 1,557,050
↑ 1,557,050 6. SBI Arbitrage Opportunities Fund
SBI Arbitrage Opportunities Fund
Growth Launch Date 3 Nov 06 NAV (31 Jul 26) ₹36.0104 ↑ 0.00 (0.01 %) Net Assets (Cr) ₹45,923 on 30 Jun 26 Category Hybrid - Arbitrage AMC SBI Funds Management Private Limited Rating ☆☆ Risk Moderately Low Expense Ratio 0.95 Sharpe Ratio 0.33 Information Ratio 0 Alpha Ratio 0 Min Investment 5,000 Min SIP Investment 500 Exit Load 0-1 Months (0.5%),1 Months and above(NIL) Growth of 10,000 investment over the years.
Date Value 31 Jul 21 ₹10,000 31 Jul 22 ₹10,371 31 Jul 23 ₹11,080 31 Jul 24 ₹11,942 31 Jul 25 ₹12,781 31 Jul 26 ₹13,539 Returns for SBI Arbitrage Opportunities Fund
absolute basis & more than 1 year are on CAGR (Compound Annual Growth Rate) basis. as on 31 Jul 26 Duration Returns 1 Month 0.6% 3 Month 1.5% 6 Month 2.9% 1 Year 5.9% 3 Year 6.9% 5 Year 6.2% 10 Year 15 Year Since launch 6.7% Historical performance (Yearly) on absolute basis
Year Returns 2024 6.5% 2023 7.5% 2022 7.4% 2021 4.6% 2020 4% 2019 3.5% 2018 6% 2017 6.2% 2016 5.3% 2015 6.4% Fund Manager information for SBI Arbitrage Opportunities Fund
Name Since Tenure Neeraj Kumar 5 Oct 12 13.74 Yr. Ardhendu Bhattacharya 27 Dec 24 1.51 Yr. Data below for SBI Arbitrage Opportunities Fund as on 30 Jun 26
Asset Allocation
Asset Class Value Cash 98.64% Debt 1.84% Other 0.05% Equity Sector Allocation
Sector Value Financial Services 30.08% Basic Materials 8.13% Industrials 7.69% Consumer Cyclical 5.81% Energy 5.26% Communication Services 4.2% Utility 3.85% Consumer Defensive 3.81% Health Care 3.65% Real Estate 1.67% Technology 0.79% Debt Sector Allocation
Sector Value Cash Equivalent 87.8% Corporate 10.39% Government 2.29% Credit Quality
Rating Value AA 1.87% AAA 98.13% Top Securities Holdings / Portfolio
Name Holding Value Quantity SBI Liquid Dir Gr
Investment Fund | -8% ₹3,665 Cr 8,413,178
↑ 2,746,616 SBI Savings Dir Gr
Investment Fund | -8% ₹3,407 Cr 726,722,883 HDFC Bank Ltd (Financial Services)
Equity, Since 30 Apr 22 | HDFCBANK6% ₹2,463 Cr 33,079,600
↑ 3,964,250 Future on HDFC Bank Ltd
Derivatives | -6% -₹2,454 Cr 33,079,600
↑ 33,079,600 Future on ICICI Bank Ltd
Derivatives | -5% -₹2,372 Cr 18,673,900
↑ 18,673,900 ICICI Bank Ltd (Financial Services)
Equity, Since 30 Jun 21 | ICICIBANK5% ₹2,346 Cr 18,673,900
↑ 5,756,100 Future on State Bank of India
Derivatives | -3% -₹1,368 Cr 14,047,500
↑ 14,047,500 State Bank of India (Financial Services)
Equity, Since 31 May 23 | SBIN3% ₹1,355 Cr 14,047,500
↑ 650,250 Future on Reliance Industries Ltd
Derivatives | -3% -₹1,090 Cr 8,193,000
↑ 8,193,000 Reliance Industries Ltd (Energy)
Equity, Since 30 Nov 21 | RELIANCE3% ₹1,082 Cr 8,193,000
↑ 2,581,000 7. Nippon India Arbitrage Fund
Nippon India Arbitrage Fund
Growth Launch Date 14 Oct 10 NAV (31 Jul 26) ₹28.2414 ↑ 0.01 (0.02 %) Net Assets (Cr) ₹16,638 on 30 Jun 26 Category Hybrid - Arbitrage AMC Nippon Life Asset Management Ltd. Rating ☆☆☆☆ Risk Moderately Low Expense Ratio 1.07 Sharpe Ratio 0.22 Information Ratio 0 Alpha Ratio 0 Min Investment 5,000 Min SIP Investment 100 Exit Load 0-1 Months (0.25%),1 Months and above(NIL) Growth of 10,000 investment over the years.
Date Value 31 Jul 21 ₹10,000 31 Jul 22 ₹10,327 31 Jul 23 ₹10,974 31 Jul 24 ₹11,817 31 Jul 25 ₹12,607 31 Jul 26 ₹13,350 Returns for Nippon India Arbitrage Fund
absolute basis & more than 1 year are on CAGR (Compound Annual Growth Rate) basis. as on 31 Jul 26 Duration Returns 1 Month 0.6% 3 Month 1.6% 6 Month 2.9% 1 Year 5.9% 3 Year 6.8% 5 Year 5.9% 10 Year 15 Year Since launch 6.8% Historical performance (Yearly) on absolute basis
Year Returns 2024 6.2% 2023 7.5% 2022 7% 2021 4.2% 2020 3.8% 2019 4.3% 2018 6.2% 2017 6.8% 2016 5.5% 2015 6.6% Fund Manager information for Nippon India Arbitrage Fund
Name Since Tenure Kinjal Desai 25 May 18 8.1 Yr. Vikash Agarwal 14 Sep 24 1.79 Yr. Nemish Sheth 21 Mar 25 1.28 Yr. Rohit Shah 8 Apr 24 2.23 Yr. Amber Singhania 11 Mar 26 0.3 Yr. Data below for Nippon India Arbitrage Fund as on 30 Jun 26
Asset Allocation
Asset Class Value Equity 140.95% Debt 8.25% Other 0.06% Equity Sector Allocation
Sector Value Financial Services 25.75% Basic Materials 9.28% Consumer Cyclical 7.98% Energy 7.13% Industrials 5.49% Communication Services 4.01% Health Care 3.8% Utility 3.11% Consumer Defensive 2.7% Real Estate 0.79% Technology 0.57% Debt Sector Allocation
Sector Value Corporate 16.46% Government 3.66% Credit Quality
Rating Value AA 36.68% AAA 63.32% Top Securities Holdings / Portfolio
Name Holding Value Quantity Nippon India Money Market Dir Gr
Investment Fund | -15% ₹2,441 Cr 5,504,465
↑ 451,140 Nippon India U/ST Duration Dir Gr
Investment Fund | -7% ₹1,193 Cr 2,533,969
↑ 425,422 HDFC Bank Ltd (Financial Services)
Equity, Since 31 Jan 23 | HDFCBANK6% ₹952 Cr 12,786,150
↑ 1,419,400 Future on HDFC Bank Ltd Cedear
Derivatives, Since 31 May 26 | -6% ₹948 Cr 12,786,150
↑ 12,786,150 Future on Reliance Industries Ltd
Derivatives, Since 31 May 26 | -5% ₹754 Cr 5,666,000
↑ 5,666,000 Reliance Industries Ltd (Energy)
Equity, Since 31 Dec 17 | RELIANCE5% ₹749 Cr 5,666,000
↑ 2,751,500 Future on ICICI Bank Ltd
Derivatives, Since 31 May 26 | -4% ₹581 Cr 4,571,700
↑ 4,571,700 ICICI Bank Ltd (Financial Services)
Equity, Since 31 Oct 24 | ICICIBANK4% ₹574 Cr 4,571,700
↑ 1,042,300 Future on Axis Bank Ltd
Derivatives, Since 31 May 26 | -2% ₹394 Cr 3,031,875
↑ 3,031,875 Axis Bank Ltd (Financial Services)
Equity, Since 31 Jul 23 | AXISBANK2% ₹390 Cr 3,031,875
↑ 262,500
રોકાણકાર તરીકે ધ્યાનમાં રાખવા જેવી બાબતો
1. જોખમ
જેમ કે સ્ટોક એક્સચેન્જ પર સોદા કરવામાં આવે છે, આ ફંડ્સમાં કોઈ કાઉન્ટર પાર્ટી રિસ્ક નથી. ફંડ મેનેજર રોકડ અને ફ્યુચર્સ માર્કેટમાં શેર ખરીદતા અને વેચતા હોવા છતાં, અન્ય ડાઇવર્સિફાઇડ ઇક્વિટી મ્યુચ્યુઅલ ફંડની જેમ ઇક્વિટીમાં કોઈ જોખમ નથી. જો કે સવારી સરળ લાગે છે, આ ભંડોળ સાથે વધુ આરામદાયક ન થાઓ. જેમ જેમ વધુ લોકો આર્બિટ્રેજ ફંડ્સમાં ટ્રેડિંગ કરવાનું શરૂ કરે છે, ત્યાં ઘણી આર્બિટ્રેજ તકો ઉપલબ્ધ રહેશે નહીં. રોકડ અને ભાવિ બજાર કિંમતો વચ્ચેનો ફેલાવો ઘટશે, આર્બિટ્રેજ કેન્દ્રિત રોકાણકારો માટે થોડું બાકી રહેશે.
2. પરત
આર્બિટ્રેજ ફંડ્સ એ લોકો માટે વાજબી વળતર આપવાની સારી તક હોઈ શકે છે જેઓ તેને સમજી શકે છે અને પછી તેનો મહત્તમ લાભ લઈ શકે છે. ફંડ મેનેજર જનરેટ કરવાનો પ્રયાસ કરે છેઆલ્ફા બજારોમાં ભાવ તફાવતનો ઉપયોગ કરીને. ઐતિહાસિક રીતે, આર્બિટ્રેજ ફંડ્સ રિટર્ન આપે છેશ્રેણી 5-10 વર્ષના સમયગાળામાં 7%-8%. જો તમે એવા પોર્ટફોલિયો દ્વારા મધ્યમ વળતર મેળવવા માંગતા હોવ જેમાં અસ્થિર બજારમાં દેવું અને ઇક્વિટીનું સંપૂર્ણ મિશ્રણ હોય, તો આર્બિટ્રેજ ફંડ્સ તમારી વસ્તુ બની શકે છે. જો કે, તમારે એક વાત ધ્યાનમાં રાખવાની જરૂર છે કે આર્બિટ્રેજ ફંડમાં કોઈ ગેરેંટી વળતર મળતું નથી.
3. કિંમત
આર્બિટ્રેજ ફંડ્સનું મૂલ્યાંકન કરતી વખતે કિંમત એક મહત્વપૂર્ણ વિચારણા બની જાય છે. આ ફંડ્સ વાર્ષિક ફી લે છે જેને એક્સપેન્સ રેશિયો કહેવાય છે જે ફંડની અસ્કયામતોની ટકાવારી તરીકે દર્શાવવામાં આવે છે. તેમાં ફંડ મેનેજરની ફી અને ફંડ મેનેજમેન્ટ ચાર્જનો સમાવેશ થાય છે. વારંવારના ટ્રેડિંગને કારણે, આર્બિટ્રેજ ફંડને ટ્રાન્ઝેક્શનનો મોટો ખર્ચ થાય છે અને તેનો ટર્નઓવર રેશિયો ઊંચો હોય છે. વધુમાં, રોકાણકારોને વહેલા બહાર નીકળવાથી નિરાશ કરવા માટે ફંડ 30 થી 60 દિવસના સમયગાળા માટે એક્ઝિટ લોડ લાવી શકે છે. આ તમામ ખર્ચ ફંડના ખર્ચ ગુણોત્તરમાં વધારો કરી શકે છે. ઉચ્ચ ખર્ચ ગુણોત્તર તમારા ટેક-હોમ વળતર પર નીચેનું દબાણ લાવે છે.
4. ઇન્વેસ્ટમેન્ટ હોરાઇઝન
આર્બિટ્રેજ ફંડ એવા રોકાણકારો માટે યોગ્ય હોઈ શકે છે જેમની પાસે 3 થી 5 વર્ષની ટૂંકા અને મધ્યમ ગાળાની ક્ષિતિજ હોય છે. જેમ કે આ ફંડ્સ એક્ઝિટ લોડ ચાર્જ કરે છે, ત્યારે તમે ઓછામાં ઓછા 3-6 મહિનાના સમયગાળા માટે રોકાણ કરવા માટે તૈયાર હોવ ત્યારે જ તમે તેનો વિચાર કરી શકો છો. તે જ સમયે, તમારે એ સમજવાની જરૂર છે કે ભંડોળનું વળતર ઉચ્ચ અસ્થિરતાના અસ્તિત્વ પર ખૂબ નિર્ભર છે. તેથી, એકસાથે રોકાણ પસંદ કરવાનું અર્થપૂર્ણ રહેશેવ્યવસ્થિત રોકાણ યોજના (SIPs). અસ્થિરતાની ગેરહાજરીમાં, લિક્વિડ ફંડ સમાન રોકાણ ક્ષિતિજ પર આર્બિટ્રેજ ફંડ્સ કરતાં વધુ સારું વળતર આપી શકે છે. આથી, આર્બિટ્રેજ ફંડ્સ પસંદ કરતી વખતે તમારે બજારની એકંદર સ્થિતિને ધ્યાનમાં રાખવાની જરૂર છે.
5. નાણાકીય લક્ષ્યો
જો તમારી પાસે ટૂંકાથી મધ્યમ ગાળાની છેનાણાકીય લક્ષ્યો, તો પછી આર્બિટ્રેજ ફંડ તમારી વસ્તુ છે. નિયમિત બચત બેંક ખાતાને બદલે, તમે આ ભંડોળનો ઉપયોગ ઈમરજન્સી ફંડ બનાવવા અને તેના પર વધુ વળતર મેળવવા માટે વધારાના ભંડોળ પાર્ક કરવા માટે કરી શકો છો. જો તમે પહેલાથી જ જોખમી હેવન ઇક્વિટી ફંડ્સમાં રોકાણ કર્યું હોય, તો પછી તમે શરૂ કરી શકો છોવ્યવસ્થિત ટ્રાન્સફર પ્લાન (STP) ઇક્વિટી ફંડ્સમાંથી આર્બિટ્રેજ ફંડ્સ જેવા ઓછા જોખમી આશ્રયસ્થાન સુધી જેમ જેમ તમે નાણાકીય ધ્યેય પૂર્ણ કરવાની નજીક પહોંચો છો. આ તમારા પોર્ટફોલિયોના એકંદરમાં ઘટાડો કરશેજોખમ પ્રોફાઇલ પરંતુ તે જ સમયે વળતર પણ ઘટાડે છે. તમે આર્બિટ્રેજ ફંડમાં બે આંકડામાં વળતર મેળવવાની અપેક્ષા રાખી શકતા નથી.
આર્બિટ્રેજ ફંડમાં ઓનલાઈન કેવી રીતે રોકાણ કરવું?
Fincash.com પર આજીવન માટે મફત રોકાણ ખાતું ખોલો.
તમારી નોંધણી અને KYC પ્રક્રિયા પૂર્ણ કરો
દસ્તાવેજો અપલોડ કરો (PAN, આધાર, વગેરે).અને, તમે રોકાણ કરવા માટે તૈયાર છો!
અહીં આપેલી માહિતી સચોટ છે તેની ખાતરી કરવા માટેના તમામ પ્રયાસો કરવામાં આવ્યા છે. જો કે, ડેટાની શુદ્ધતા અંગે કોઈ ગેરંટી આપવામાં આવતી નથી. કોઈપણ રોકાણ કરતા પહેલા કૃપા કરીને સ્કીમ માહિતી દસ્તાવેજ સાથે ચકાસો.
You Might Also Like


AMFI Registration No. 112358 | CIN: U74999MH2016PTC282153
Shepard Technologies Pvt. Ltd. (with ARN code 112358) makes no warranties or representations, express or implied, on products offered through the platform. It accepts no liability for any damages or losses, however caused, in connection with the use of, or on the reliance of its product or related services. Terms and conditions of the website are applicable.
©2026 Shepard Technologies Private Limited. All Rights Reserved
Research Highlights for Invesco India Arbitrage Fund