11 बेस्ट लार्ज कैप इक्विटी फंड्स 2022
आदर्श रूप से, जब कोई सोचता हैनिवेश, पहला विचार जो किसी के दिमाग में आता है वह ज्यादातर इक्विटी होगा। जब आप आगे की खोज करते हैंइक्विटी फ़ंड, आप लार्ज-कैप फंड करेंगे।
बड़ी टोपीम्यूचुअल फंड्स इक्विटी में सबसे सुरक्षित निवेशों में से एक माना जाता है क्योंकि उनके पास अच्छा रिटर्न है और वे कम अस्थिर हैंमंडी अन्य इक्विटी फंडों की तुलना में उतार-चढ़ाव अर्थात मध्य औरस्मॉल कैप फंड. ये फंड बड़ी कंपनियों के शेयर में निवेश करते हैं। ब्लू-चिप कंपनियों के शेयर की कीमत अधिक होने के बावजूद निवेशक अपना पैसा लार्ज-कैप में निवेश करने के इच्छुक हैं।
सर्वश्रेष्ठ लार्ज कैप म्यूचुअल फंड चुनना एक महत्वपूर्ण कार्य है जिसे उचित महत्व दिया जाना चाहिए। आइए नीचे देखेंनिवेश के लाभ लार्ज कैप म्यूचुअल फंड में, सर्वश्रेष्ठ का चयन कैसे करेंलार्ज कैप फंड और अंत में, 2022 में निवेश करने के लिए शीर्ष 10 सर्वश्रेष्ठ लार्ज कैप फंडों की सूची।
लार्ज कैप फंड कैसे चुनें?
सही लार्ज-कैप म्यूचुअल फंड चुनना कभी आसान नहीं होता है। कुछ फंड अच्छा प्रदर्शन करते हैं, जबकि अन्य फंड कमजोर पड़ते हैं। लेकिन, कुछ पैरामीटर हैं जिन्हें निवेशकों को सही फंड चुनते समय देखना होता है। किसी फंड पर निर्णय लेने से पहले कई मात्रात्मक और साथ ही गुणात्मक कारकों को देखने की जरूरत है।
मात्रात्मक कारक
आपसीफंड रेटिंग एक अच्छा प्रारंभिक बिंदु हो सकता है। इसे अन्य डेटा जैसे फंड की उम्र, प्रबंधन के तहत संपत्ति (एयूएम), पिछले रिटर्न, व्यय अनुपात इत्यादि के साथ पूरक करने की आवश्यकता है। इसके अलावा, निवेशकों को सलाह दी जाती है कि वे फंड के पिछले तीन वर्षों के प्रदर्शन की जांच करें। एक फंड की शुद्ध संपत्ति INR 1000 करोड़ से अधिक होनी चाहिए और पिछले एक वर्ष में लार्ज कैप शेयरों में न्यूनतम औसत आवंटन 65 प्रतिशत होना चाहिए।
Talk to our investment specialist
गुणात्मक कारक
इसे आगे फंड हाउस प्रतिष्ठा, फंड मैनेजर ट्रैक रिकॉर्ड और निवेश प्रक्रिया जैसे गुणात्मक कारकों के साथ फ़िल्टर करने की आवश्यकता है। आपको उस फंड हाउस का चयन करना चाहिए जिस पर आपको अपना पैसा निवेश करने का विश्वास हो। ऐसे फंड हाउस की पहचान करना जिनकी बाजार में मजबूत उपस्थिति है और विभिन्न प्रकार के फंड प्रदान करते हैं जिनका लंबा और सुसंगत ट्रैक रिकॉर्ड है। यह भी देखना चाहिए कि कितने फंड टॉप परफॉर्मर हैं। एक अच्छे ट्रैक रिकॉर्ड वाले फंड मैनेजर का होना जरूरी है। एकएसेट मैनेजमेंट कंपनी एक निर्धारित संस्थागत निवेश प्रक्रिया के साथ भी महत्वपूर्ण है क्योंकि यह सुनिश्चित करता है कि यह एक ऐसी प्रक्रिया है जो आपको केवल एक फंड मैनेजर (व्यक्ति - और इसलिए कीमैन जोखिम) के बजाय पैसा कमाने के लिए प्रेरित करती है। उपरोक्त कार्य करके, कोई भी सर्वश्रेष्ठ लार्ज कैप फंड का चयन करने का प्रयास कर सकता है या चुनने के लिए शीर्ष 10 सर्वश्रेष्ठ लार्ज कैप फंडों की सूची भी बना सकता है।
शीर्ष 11 सर्वश्रेष्ठ प्रदर्शन करने वाले लार्ज कैप म्यूचुअल फंड वित्त वर्ष 22 - 23
Fund NAV Net Assets (Cr) 3 MO (%) 6 MO (%) 1 YR (%) 3 YR (%) 5 YR (%) 2025 (%) IDBI India Top 100 Equity Fund Growth ₹44.16
↑ 0.05 ₹655 9.2 12.5 15.4 21.9 12.6 Invesco India Largecap Fund Growth ₹71.54
↑ 0.69 ₹1,749 5.8 2.3 1.9 13.9 12.8 5.5 Nippon India Large Cap Fund Growth ₹90.1145
↑ 0.90 ₹51,660 2.3 -2.5 -1.3 13.1 15.2 9.2 ICICI Prudential Bluechip Fund Growth ₹109.1
↑ 1.11 ₹76,297 1.6 -4.1 -1.9 13.1 13.5 11.3 Bandhan Large Cap Fund Growth ₹78.237
↑ 0.91 ₹2,001 4.2 -1.2 1.4 12.9 12 8.2 DSP TOP 100 Equity Growth ₹461.24
↑ 5.38 ₹7,175 1.5 -3.8 -3.5 12.8 10.7 8.4 BNP Paribas Large Cap Fund Growth ₹218.533
↑ 1.85 ₹2,550 2.3 -2.1 -2.1 12 11.5 4.4 TATA Large Cap Fund Growth ₹510.31
↑ 5.91 ₹2,682 4 -1.2 0.7 11.6 11.3 9.2 Kotak Bluechip Fund Growth ₹567.748
↑ 6.34 ₹10,516 2.2 -3.1 -1.8 11.3 10.7 8.7 HDFC Top 100 Fund Growth ₹1,136.98
↑ 8.45 ₹37,808 3.5 -2.9 -0.8 11.2 12.8 7.9 Aditya Birla Sun Life Frontline Equity Fund Growth ₹517.71
↑ 5.47 ₹28,640 2.5 -4.3 -3 10.8 11.1 9.4 Note: Returns up to 1 year are on absolute basis & more than 1 year are on CAGR basis. as on 28 Jul 23 Research Highlights & Commentary of 11 Funds showcased
Commentary IDBI India Top 100 Equity Fund Invesco India Largecap Fund Nippon India Large Cap Fund ICICI Prudential Bluechip Fund Bandhan Large Cap Fund DSP TOP 100 Equity BNP Paribas Large Cap Fund TATA Large Cap Fund Kotak Bluechip Fund HDFC Top 100 Fund Aditya Birla Sun Life Frontline Equity Fund Point 1 Bottom quartile AUM (₹655 Cr). Bottom quartile AUM (₹1,749 Cr). Top quartile AUM (₹51,660 Cr). Highest AUM (₹76,297 Cr). Bottom quartile AUM (₹2,001 Cr). Lower mid AUM (₹7,175 Cr). Lower mid AUM (₹2,550 Cr). Lower mid AUM (₹2,682 Cr). Upper mid AUM (₹10,516 Cr). Upper mid AUM (₹37,808 Cr). Upper mid AUM (₹28,640 Cr). Point 2 Established history (14+ yrs). Established history (16+ yrs). Established history (18+ yrs). Established history (18+ yrs). Established history (20+ yrs). Established history (23+ yrs). Established history (21+ yrs). Established history (28+ yrs). Established history (27+ yrs). Oldest track record among peers (29 yrs). Established history (23+ yrs). Point 3 Rating: 3★ (upper mid). Rating: 3★ (lower mid). Rating: 4★ (top quartile). Rating: 4★ (upper mid). Rating: 2★ (bottom quartile). Rating: 2★ (bottom quartile). Rating: 3★ (lower mid). Rating: 3★ (lower mid). Rating: 3★ (bottom quartile). Rating: 3★ (upper mid). Top rated. Point 4 Risk profile: Moderately High. Risk profile: Moderately High. Risk profile: Moderately High. Risk profile: Moderately High. Risk profile: Moderately High. Risk profile: Moderately High. Risk profile: Moderately High. Risk profile: Moderately High. Risk profile: Moderately High. Risk profile: Moderately High. Risk profile: Moderately High. Point 5 5Y return: 12.61% (upper mid). 5Y return: 12.75% (upper mid). 5Y return: 15.24% (top quartile). 5Y return: 13.52% (top quartile). 5Y return: 12.03% (lower mid). 5Y return: 10.74% (bottom quartile). 5Y return: 11.52% (lower mid). 5Y return: 11.28% (lower mid). 5Y return: 10.69% (bottom quartile). 5Y return: 12.82% (upper mid). 5Y return: 11.09% (bottom quartile). Point 6 3Y return: 21.88% (top quartile). 3Y return: 13.87% (top quartile). 3Y return: 13.13% (upper mid). 3Y return: 13.12% (upper mid). 3Y return: 12.87% (upper mid). 3Y return: 12.76% (lower mid). 3Y return: 11.96% (lower mid). 3Y return: 11.55% (lower mid). 3Y return: 11.25% (bottom quartile). 3Y return: 11.21% (bottom quartile). 3Y return: 10.78% (bottom quartile). Point 7 1Y return: 15.39% (top quartile). 1Y return: 1.88% (top quartile). 1Y return: -1.27% (lower mid). 1Y return: -1.91% (lower mid). 1Y return: 1.41% (upper mid). 1Y return: -3.52% (bottom quartile). 1Y return: -2.11% (bottom quartile). 1Y return: 0.67% (upper mid). 1Y return: -1.83% (lower mid). 1Y return: -0.79% (upper mid). 1Y return: -3.00% (bottom quartile). Point 8 Alpha: 2.11 (top quartile). Alpha: 1.94 (upper mid). Alpha: 0.46 (lower mid). Alpha: -1.97 (lower mid). Alpha: 1.95 (upper mid). Alpha: -4.25 (bottom quartile). Alpha: 0.60 (upper mid). Alpha: 2.18 (top quartile). Alpha: -1.40 (lower mid). Alpha: -2.19 (bottom quartile). Alpha: -2.06 (bottom quartile). Point 9 Sharpe: 1.09 (top quartile). Sharpe: -0.24 (upper mid). Sharpe: -0.35 (lower mid). Sharpe: -0.48 (bottom quartile). Sharpe: -0.26 (upper mid). Sharpe: -0.67 (bottom quartile). Sharpe: -0.31 (upper mid). Sharpe: -0.23 (top quartile). Sharpe: -0.44 (lower mid). Sharpe: -0.48 (bottom quartile). Sharpe: -0.48 (lower mid). Point 10 Information ratio: 0.14 (lower mid). Information ratio: 0.75 (upper mid). Information ratio: 1.03 (top quartile). Information ratio: 0.90 (top quartile). Information ratio: 0.66 (upper mid). Information ratio: 0.56 (lower mid). Information ratio: 0.68 (upper mid). Information ratio: 0.32 (lower mid). Information ratio: 0.04 (bottom quartile). Information ratio: -0.05 (bottom quartile). Information ratio: 0.04 (bottom quartile). IDBI India Top 100 Equity Fund
Invesco India Largecap Fund
Nippon India Large Cap Fund
ICICI Prudential Bluechip Fund
Bandhan Large Cap Fund
DSP TOP 100 Equity
BNP Paribas Large Cap Fund
TATA Large Cap Fund
Kotak Bluechip Fund
HDFC Top 100 Fund
Aditya Birla Sun Life Frontline Equity Fund
*एयूएम/नेट एसेट्स वाले 11 सर्वश्रेष्ठ लार्ज कैप म्यूचुअल फंडों की सूची>500 करोड़. होनाफंड की उम्र>=3 पर छाँटा गया3 सालसीएजीआर रिटर्न.
The Investment objective of the Scheme is to provide investors with the opportunities for long-term capital appreciation by investing predominantly in Equity and Equity related Instruments of Large Cap companies. However
there can be no assurance that the investment objective under the Scheme will be realized. Research Highlights for IDBI India Top 100 Equity Fund Below is the key information for IDBI India Top 100 Equity Fund Returns up to 1 year are on (Erstwhile Invesco India Business Leaders Fund) To generate long term capital appreciation by investing in equity and equity related instruments including equity derivatives of companies which in our opinion are leaders in their respective industry or industry segment. However, there is no assurance or guarantee that the investment objective of the Scheme will be achieved. The Scheme does not assure or guarantee any returns. Research Highlights for Invesco India Largecap Fund Below is the key information for Invesco India Largecap Fund Returns up to 1 year are on (Erstwhile Reliance Top 200 Fund) The primary investment objective of the scheme is to seek to generate long term capital appreciation by investing in equity and equity related instruments of companies whose market capitalization is within the range of highest & lowest market capitalization of S&P BSE 200 Index. The secondary objective is to generate consistent returns by investing in debt and money market securities. Research Highlights for Nippon India Large Cap Fund Below is the key information for Nippon India Large Cap Fund Returns up to 1 year are on (Erstwhile ICICI Prudential Focused Bluechip Equity Fund) To generate long-term capital appreciation and income distribution to unit holders from a portfolio that is invested in equity and equity related securities of about 20 companies belonging to the large cap domain and the balance in debt securities and money market instruments. The Fund Manager will always select stocks for investment from among Top 200 stocks in terms of market capitalization on the National Stock Exchange of India Ltd. If the total assets under management under this scheme goes above Rs. 1,000 crores the Fund
Manager reserves the right to increase the number of companies to more than 20. Research Highlights for ICICI Prudential Bluechip Fund Below is the key information for ICICI Prudential Bluechip Fund Returns up to 1 year are on (Erstwhile IDFC Equity Fund) The investment objective of the scheme is to seek to generate
capital growth from a portfolio of predominantly equity and equity
related instruments (including Equity Derivatives). The scheme
may also invest in debt & money market instruments to generate
reasonable income. However there is no assurance or guarantee that the objectives of the scheme will be realized. Research Highlights for Bandhan Large Cap Fund Below is the key information for Bandhan Large Cap Fund Returns up to 1 year are on The Fund is seeking to generate capital appreciation, from a portfolio that is substantially constituted of equity and equity related securities of the 100 largest corporates, by market capitalisation, listed in India. Research Highlights for DSP TOP 100 Equity Below is the key information for DSP TOP 100 Equity Returns up to 1 year are on (Erstwhile BNP Paribas Equity Fund) The investment objective of the Scheme is to generate long-term capital growth from a diversifi ed and actively managed portfolio of equity and equity related securities. The Scheme will invest in a range of companies, with a bias towards large & medium market capitalisation companies. However, there can be no
assurance that the investment objective of the Scheme will be achieved. The Scheme does not guarantee / indicate any returns. Research Highlights for BNP Paribas Large Cap Fund Below is the key information for BNP Paribas Large Cap Fund Returns up to 1 year are on To provide income distribution and / or medium to long term capital gains while at all times emphasising the importance of capital appreciation. Research Highlights for TATA Large Cap Fund Below is the key information for TATA Large Cap Fund Returns up to 1 year are on (Erstwhile Kotak 50 Fund) To generate capital appreciation from a portfolio of predominantly equity and
equity related securities. The portfolio will generally comprise of equity and equity
related instruments of around 50 companies which may go up to 59 companies but will not exceed 59 at any point in time. However, there is no assurance that the objective of the scheme
will be realized Research Highlights for Kotak Bluechip Fund Below is the key information for Kotak Bluechip Fund Returns up to 1 year are on (Erstwhile HDFC Top 200) To generate long term capital appreciation from a portfolio of equity and equity linked instruments. The investment portfolio for equity and equity linked instruments will be primarily drawn from the companies in the BSE 200 Index.
Further, the Scheme may also invest in listed companies that would qualify to be in the top 200 by market capitalisation on the BSE even though they may not be listed on the BSE. This includes participation in large Ipos where in the market
capitalisation of the company based on issue price would make the company a part of the top 200 companies listed on the BSE based on market capitalisation. Research Highlights for HDFC Top 100 Fund Below is the key information for HDFC Top 100 Fund Returns up to 1 year are on An Open-ended growth scheme with the objective of long term growth of capital, through a portfolio with a target allocation of 100% equity by aiming at being as diversified across various industries and or sectors as its chosen benchmark index, S&P BSE 200. Research Highlights for Aditya Birla Sun Life Frontline Equity Fund Below is the key information for Aditya Birla Sun Life Frontline Equity Fund Returns up to 1 year are on 1. IDBI India Top 100 Equity Fund
IDBI India Top 100 Equity Fund
Growth Launch Date 15 May 12 NAV (28 Jul 23) ₹44.16 ↑ 0.05 (0.11 %) Net Assets (Cr) ₹655 on 30 Jun 23 Category Equity - Large Cap AMC IDBI Asset Management Limited Rating ☆☆☆ Risk Moderately High Expense Ratio 2.47 Sharpe Ratio 1.09 Information Ratio 0.14 Alpha Ratio 2.11 Min Investment 5,000 Min SIP Investment 500 Exit Load 0-1 Years (1%),1 Years and above(NIL) Growth of 10,000 investment over the years.
Date Value 30 Jun 21 ₹10,000 30 Jun 22 ₹10,040 30 Jun 23 ₹12,362 Returns for IDBI India Top 100 Equity Fund
absolute basis & more than 1 year are on CAGR (Compound Annual Growth Rate) basis. as on 28 Jul 23 Duration Returns 1 Month 3% 3 Month 9.2% 6 Month 12.5% 1 Year 15.4% 3 Year 21.9% 5 Year 12.6% 10 Year 15 Year Since launch 14.2% Historical performance (Yearly) on absolute basis
Year Returns 2025 2024 2023 2022 2021 2020 2019 2018 2017 2016 Fund Manager information for IDBI India Top 100 Equity Fund
Name Since Tenure Data below for IDBI India Top 100 Equity Fund as on 30 Jun 23
Equity Sector Allocation
Sector Value Asset Allocation
Asset Class Value Top Securities Holdings / Portfolio
Name Holding Value Quantity 2. Invesco India Largecap Fund
Invesco India Largecap Fund
Growth Launch Date 21 Aug 09 NAV (10 Jul 26) ₹71.54 ↑ 0.69 (0.97 %) Net Assets (Cr) ₹1,749 on 31 May 26 Category Equity - Large Cap AMC Invesco Asset Management (India) Private Ltd Rating ☆☆☆ Risk Moderately High Expense Ratio 2.1 Sharpe Ratio -0.24 Information Ratio 0.75 Alpha Ratio 1.94 Min Investment 5,000 Min SIP Investment 100 Exit Load 0-1 Years (1%),1 Years and above(NIL) Growth of 10,000 investment over the years.
Date Value 30 Jun 21 ₹10,000 30 Jun 22 ₹10,005 30 Jun 23 ₹12,373 30 Jun 24 ₹16,924 30 Jun 25 ₹18,181 30 Jun 26 ₹18,122 Returns for Invesco India Largecap Fund
absolute basis & more than 1 year are on CAGR (Compound Annual Growth Rate) basis. as on 28 Jul 23 Duration Returns 1 Month 6.4% 3 Month 5.8% 6 Month 2.3% 1 Year 1.9% 3 Year 13.9% 5 Year 12.8% 10 Year 15 Year Since launch 12.4% Historical performance (Yearly) on absolute basis
Year Returns 2025 5.5% 2024 20% 2023 27.8% 2022 -3% 2021 32.5% 2020 14.1% 2019 10.5% 2018 -0.4% 2017 28.3% 2016 2.8% Fund Manager information for Invesco India Largecap Fund
Name Since Tenure Hiten Jain 1 Dec 23 2.58 Yr. Data below for Invesco India Largecap Fund as on 31 May 26
Equity Sector Allocation
Sector Value Financial Services 32.99% Industrials 20.35% Consumer Cyclical 14.78% Technology 10.22% Health Care 8.14% Basic Materials 6.02% Communication Services 3.35% Real Estate 2.12% Consumer Defensive 1.19% Utility 0.59% Asset Allocation
Asset Class Value Cash 0.25% Equity 99.75% Top Securities Holdings / Portfolio
Name Holding Value Quantity ICICI Bank Ltd (Financial Services)
Equity, Since 30 Sep 19 | ICICIBANK7% ₹122 Cr 969,443 ICICI Prudential Asset Management Co Ltd (Financial Services)
Equity, Since 31 Dec 25 | ICICIAMC6% ₹105 Cr 296,370 HDFC Bank Ltd (Financial Services)
Equity, Since 30 Sep 09 | HDFCBANK6% ₹103 Cr 1,384,844 Infosys Ltd (Technology)
Equity, Since 30 Apr 18 | INFY4% ₹75 Cr 646,679 Larsen & Toubro Ltd (Industrials)
Equity, Since 31 Oct 25 | LT4% ₹71 Cr 173,437 Bajaj Finance Ltd (Financial Services)
Equity, Since 28 Feb 25 | BAJFINANCE3% ₹61 Cr 671,135 Bharti Airtel Ltd (Communication Services)
Equity, Since 31 Dec 19 | BHARTIARTL3% ₹59 Cr 320,404 Eternal Ltd (Consumer Cyclical)
Equity, Since 31 Aug 23 | ETERNAL3% ₹58 Cr 2,302,684 Tech Mahindra Ltd (Technology)
Equity, Since 31 May 23 | TECHM3% ₹55 Cr 370,579 Axis Bank Ltd (Financial Services)
Equity, Since 31 Jan 26 | AXISBANK3% ₹52 Cr 406,975 3. Nippon India Large Cap Fund
Nippon India Large Cap Fund
Growth Launch Date 8 Aug 07 NAV (10 Jul 26) ₹90.1145 ↑ 0.90 (1.01 %) Net Assets (Cr) ₹51,660 on 31 May 26 Category Equity - Large Cap AMC Nippon Life Asset Management Ltd. Rating ☆☆☆☆ Risk Moderately High Expense Ratio 1.58 Sharpe Ratio -0.35 Information Ratio 1.03 Alpha Ratio 0.46 Min Investment 5,000 Min SIP Investment 100 Exit Load 0-1 Years (1%),1 Years and above(NIL) Growth of 10,000 investment over the years.
Date Value 30 Jun 21 ₹10,000 30 Jun 22 ₹10,578 30 Jun 23 ₹13,946 30 Jun 24 ₹19,434 30 Jun 25 ₹20,766 30 Jun 26 ₹20,223 Returns for Nippon India Large Cap Fund
absolute basis & more than 1 year are on CAGR (Compound Annual Growth Rate) basis. as on 28 Jul 23 Duration Returns 1 Month 4.8% 3 Month 2.3% 6 Month -2.5% 1 Year -1.3% 3 Year 13.1% 5 Year 15.2% 10 Year 15 Year Since launch 12.3% Historical performance (Yearly) on absolute basis
Year Returns 2025 9.2% 2024 18.2% 2023 32.1% 2022 11.3% 2021 32.4% 2020 4.9% 2019 7.3% 2018 -0.2% 2017 38.4% 2016 2.2% Fund Manager information for Nippon India Large Cap Fund
Name Since Tenure Sailesh Raj Bhan 8 Aug 07 18.91 Yr. Kinjal Desai 25 May 18 8.11 Yr. Bhavik Dave 19 Aug 24 1.87 Yr. Amber Singhania 11 Mar 26 0.31 Yr. Data below for Nippon India Large Cap Fund as on 31 May 26
Equity Sector Allocation
Sector Value Financial Services 34.93% Consumer Cyclical 15.3% Consumer Defensive 11.37% Industrials 8.63% Health Care 8.21% Technology 7.23% Utility 5.65% Energy 4.2% Basic Materials 2.34% Communication Services 0.69% Real Estate 0.68% Asset Allocation
Asset Class Value Cash 0.25% Equity 99.75% Top Securities Holdings / Portfolio
Name Holding Value Quantity HDFC Bank Ltd (Financial Services)
Equity, Since 31 Dec 08 | HDFCBANK9% ₹4,808 Cr 64,580,734
↑ 2,700,000 ICICI Bank Ltd (Financial Services)
Equity, Since 31 Oct 09 | ICICIBANK8% ₹4,231 Cr 33,677,945
↑ 1,000,000 Reliance Industries Ltd (Energy)
Equity, Since 31 Aug 19 | RELIANCE4% ₹2,172 Cr 16,441,139
↑ 903,600 Axis Bank Ltd (Financial Services)
Equity, Since 31 Mar 15 | AXISBANK4% ₹2,099 Cr 16,315,542
↑ 700,000 Bajaj Finance Ltd (Financial Services)
Equity, Since 31 Dec 21 | BAJFINANCE4% ₹1,820 Cr 20,034,184 Larsen & Toubro Ltd (Industrials)
Equity, Since 30 Sep 07 | LT3% ₹1,793 Cr 4,397,774 GE Vernova T&D India Ltd (Industrials)
Equity, Since 30 Jun 12 | GVT&D3% ₹1,452 Cr 2,819,557
↓ -533,863 Sun Pharmaceuticals Industries Ltd (Healthcare)
Equity, Since 30 Sep 25 | SUNPHARMA3% ₹1,447 Cr 8,040,635
↑ 1,955,755 Infosys Ltd (Technology)
Equity, Since 30 Sep 07 | INFY3% ₹1,408 Cr 12,126,097 Hindustan Unilever Ltd (Consumer Defensive)
Equity, Since 30 Sep 20 | HINDUNILVR3% ₹1,400 Cr 6,498,878
↑ 500,000 4. ICICI Prudential Bluechip Fund
ICICI Prudential Bluechip Fund
Growth Launch Date 23 May 08 NAV (10 Jul 26) ₹109.1 ↑ 1.11 (1.03 %) Net Assets (Cr) ₹76,297 on 31 May 26 Category Equity - Large Cap AMC ICICI Prudential Asset Management Company Limited Rating ☆☆☆☆ Risk Moderately High Expense Ratio 1.46 Sharpe Ratio -0.48 Information Ratio 0.9 Alpha Ratio -1.97 Min Investment 5,000 Min SIP Investment 100 Exit Load 0-1 Years (1%),1 Years and above(NIL) Growth of 10,000 investment over the years.
Date Value 30 Jun 21 ₹10,000 30 Jun 22 ₹10,446 30 Jun 23 ₹12,920 30 Jun 24 ₹17,880 30 Jun 25 ₹19,286 30 Jun 26 ₹18,583 Returns for ICICI Prudential Bluechip Fund
absolute basis & more than 1 year are on CAGR (Compound Annual Growth Rate) basis. as on 28 Jul 23 Duration Returns 1 Month 5% 3 Month 1.6% 6 Month -4.1% 1 Year -1.9% 3 Year 13.1% 5 Year 13.5% 10 Year 15 Year Since launch 14.1% Historical performance (Yearly) on absolute basis
Year Returns 2025 11.3% 2024 16.9% 2023 27.4% 2022 6.9% 2021 29.2% 2020 13.5% 2019 9.8% 2018 -0.8% 2017 32.7% 2016 7.7% Fund Manager information for ICICI Prudential Bluechip Fund
Name Since Tenure Sankaran Naren 5 Feb 26 0.4 Yr. Vaibhav Dusad 18 Jan 21 5.45 Yr. Sharmila D'Silva 31 Jul 22 3.92 Yr. Data below for ICICI Prudential Bluechip Fund as on 31 May 26
Equity Sector Allocation
Sector Value Financial Services 28.98% Consumer Cyclical 13.83% Industrials 11.11% Energy 7.43% Basic Materials 6.68% Consumer Defensive 5.84% Health Care 5.11% Communication Services 4.85% Technology 4.81% Utility 4.4% Real Estate 1.32% Asset Allocation
Asset Class Value Cash 5.23% Equity 94.77% Top Securities Holdings / Portfolio
Name Holding Value Quantity ICICI Bank Ltd (Financial Services)
Equity, Since 30 Jun 08 | ICICIBANK9% ₹6,650 Cr 52,926,976 HDFC Bank Ltd (Financial Services)
Equity, Since 31 Dec 10 | HDFCBANK8% ₹6,458 Cr 86,741,473 Reliance Industries Ltd (Energy)
Equity, Since 30 Jun 08 | RELIANCE5% ₹4,125 Cr 31,220,500
↑ 1,500,000 Larsen & Toubro Ltd (Industrials)
Equity, Since 31 Jan 12 | LT5% ₹4,107 Cr 10,075,656
↓ -594,718 Axis Bank Ltd (Financial Services)
Equity, Since 31 Mar 14 | AXISBANK5% ₹3,562 Cr 27,689,059
↑ 100,000 Bharti Airtel Ltd (Communication Services)
Equity, Since 31 Aug 09 | BHARTIARTL4% ₹3,311 Cr 18,104,129
↑ 337,869 Infosys Ltd (Technology)
Equity, Since 30 Nov 10 | INFY4% ₹2,747 Cr 23,662,450
↓ -1,575,000 Maruti Suzuki India Ltd (Consumer Cyclical)
Equity, Since 30 Apr 16 | MARUTI4% ₹2,712 Cr 2,065,675
↓ -79,950 UltraTech Cement Ltd (Basic Materials)
Equity, Since 30 Sep 17 | ULTRACEMCO3% ₹2,050 Cr 1,785,267
↓ -50,000 Sun Pharmaceuticals Industries Ltd (Healthcare)
Equity, Since 31 Jul 15 | SUNPHARMA3% ₹2,024 Cr 11,249,940 5. Bandhan Large Cap Fund
Bandhan Large Cap Fund
Growth Launch Date 9 Jun 06 NAV (10 Jul 26) ₹78.237 ↑ 0.91 (1.18 %) Net Assets (Cr) ₹2,001 on 31 May 26 Category Equity - Large Cap AMC IDFC Asset Management Company Limited Rating ☆☆ Risk Moderately High Expense Ratio 2.07 Sharpe Ratio -0.26 Information Ratio 0.66 Alpha Ratio 1.95 Min Investment 5,000 Min SIP Investment 100 Exit Load 0-365 Days (1%),365 Days and above(NIL) Growth of 10,000 investment over the years.
Date Value 30 Jun 21 ₹10,000 30 Jun 22 ₹9,921 30 Jun 23 ₹12,185 30 Jun 24 ₹16,500 30 Jun 25 ₹17,486 30 Jun 26 ₹17,236 Returns for Bandhan Large Cap Fund
absolute basis & more than 1 year are on CAGR (Compound Annual Growth Rate) basis. as on 28 Jul 23 Duration Returns 1 Month 6.1% 3 Month 4.2% 6 Month -1.2% 1 Year 1.4% 3 Year 12.9% 5 Year 12% 10 Year 15 Year Since launch 10.8% Historical performance (Yearly) on absolute basis
Year Returns 2025 8.2% 2024 18.7% 2023 26.8% 2022 -2.3% 2021 26.8% 2020 17.4% 2019 10.6% 2018 -4.2% 2017 34.2% 2016 5.3% Fund Manager information for Bandhan Large Cap Fund
Name Since Tenure Manish Gunwani 2 Dec 24 1.58 Yr. Prateek Poddar 2 Dec 24 1.58 Yr. Ritika Behera 7 Oct 23 2.73 Yr. Gaurav Satra 7 Jun 24 2.07 Yr. Data below for Bandhan Large Cap Fund as on 31 May 26
Equity Sector Allocation
Sector Value Financial Services 31.37% Consumer Cyclical 14.89% Technology 8.69% Basic Materials 7.9% Industrials 7.81% Health Care 7.05% Energy 6.25% Consumer Defensive 5.02% Utility 4.61% Communication Services 3.01% Real Estate 1.8% Asset Allocation
Asset Class Value Cash 0.43% Equity 99.57% Top Securities Holdings / Portfolio
Name Holding Value Quantity ICICI Bank Ltd (Financial Services)
Equity, Since 31 Oct 18 | ICICIBANK8% ₹168 Cr 1,338,506
↑ 83,326 HDFC Bank Ltd (Financial Services)
Equity, Since 28 Feb 07 | HDFCBANK7% ₹147 Cr 1,978,408
↑ 6,494 Reliance Industries Ltd (Energy)
Equity, Since 28 Feb 07 | RELIANCE6% ₹118 Cr 890,095
↓ -8,990 Infosys Ltd (Technology)
Equity, Since 31 Aug 11 | INFY4% ₹84 Cr 721,653
↓ -7,289 NTPC Ltd (Utilities)
Equity, Since 31 Dec 24 | NTPC4% ₹84 Cr 2,162,368
↑ 28,879 State Bank of India (Financial Services)
Equity, Since 31 Dec 24 | SBIN4% ₹74 Cr 768,824
↑ 29,946 Larsen & Toubro Ltd (Industrials)
Equity, Since 31 Jan 19 | LT3% ₹67 Cr 163,216
↓ -1,648 Bharti Airtel Ltd (Communication Services)
Equity, Since 30 Apr 24 | BHARTIARTL3% ₹60 Cr 329,763
↓ -3,330 Mahindra & Mahindra Ltd (Consumer Cyclical)
Equity, Since 30 Apr 24 | M&M3% ₹59 Cr 193,611
↑ 7,133 Sun Pharmaceuticals Industries Ltd (Healthcare)
Equity, Since 31 Aug 24 | SUNPHARMA3% ₹57 Cr 314,202
↓ -3,173 6. DSP TOP 100 Equity
DSP TOP 100 Equity
Growth Launch Date 10 Mar 03 NAV (10 Jul 26) ₹461.24 ↑ 5.38 (1.18 %) Net Assets (Cr) ₹7,175 on 31 May 26 Category Equity - Large Cap AMC DSP BlackRock Invmt Managers Pvt. Ltd. Rating ☆☆ Risk Moderately High Expense Ratio 1.94 Sharpe Ratio -0.67 Information Ratio 0.56 Alpha Ratio -4.25 Min Investment 1,000 Min SIP Investment 500 Exit Load 0-12 Months (1%),12 Months and above(NIL) Growth of 10,000 investment over the years.
Date Value 30 Jun 21 ₹10,000 30 Jun 22 ₹9,310 30 Jun 23 ₹11,681 30 Jun 24 ₹15,849 30 Jun 25 ₹17,488 30 Jun 26 ₹16,563 Returns for DSP TOP 100 Equity
absolute basis & more than 1 year are on CAGR (Compound Annual Growth Rate) basis. as on 28 Jul 23 Duration Returns 1 Month 4.9% 3 Month 1.5% 6 Month -3.8% 1 Year -3.5% 3 Year 12.8% 5 Year 10.7% 10 Year 15 Year Since launch 17.8% Historical performance (Yearly) on absolute basis
Year Returns 2025 8.4% 2024 20.5% 2023 26.6% 2022 1.4% 2021 19.5% 2020 7.5% 2019 14.8% 2018 -2.7% 2017 26.5% 2016 4.9% Fund Manager information for DSP TOP 100 Equity
Name Since Tenure Anish Tawakley 16 May 26 0.13 Yr. Data below for DSP TOP 100 Equity as on 31 May 26
Equity Sector Allocation
Sector Value Financial Services 36.89% Consumer Cyclical 11.99% Communication Services 7.37% Energy 7.36% Consumer Defensive 6.64% Industrials 5.59% Technology 5% Utility 4.57% Health Care 4.43% Basic Materials 4.05% Real Estate 1.78% Asset Allocation
Asset Class Value Cash 3.91% Equity 96.09% Top Securities Holdings / Portfolio
Name Holding Value Quantity ICICI Bank Ltd (Financial Services)
Equity, Since 31 Jul 16 | ICICIBANK9% ₹679 Cr 5,402,080
↑ 718,418 HDFC Bank Ltd (Financial Services)
Equity, Since 30 Sep 14 | HDFCBANK9% ₹660 Cr 8,859,088
↑ 204,478 Axis Bank Ltd (Financial Services)
Equity, Since 31 Oct 21 | AXISBANK6% ₹412 Cr 3,199,327 ITC Ltd (Consumer Defensive)
Equity, Since 31 Mar 21 | ITC6% ₹404 Cr 14,073,512
↓ -2,324,803 Infosys Ltd (Technology)
Equity, Since 30 Sep 19 | INFY5% ₹359 Cr 3,089,541 Bharti Airtel Ltd (Communication Services)
Equity, Since 31 Mar 26 | BHARTIARTL5% ₹358 Cr 1,958,496
↑ 392,336 Mahindra & Mahindra Ltd (Consumer Cyclical)
Equity, Since 28 Feb 22 | M&M5% ₹357 Cr 1,172,124 Larsen & Toubro Ltd (Industrials)
Equity, Since 31 May 26 | LT4% ₹304 Cr 745,456
↑ 745,456 Reliance Industries Ltd (Energy)
Equity, Since 31 May 26 | RELIANCE4% ₹300 Cr 2,269,483
↑ 2,269,483 NTPC Ltd (Utilities)
Equity, Since 30 Nov 23 | NTPC3% ₹245 Cr 6,330,986
↓ -82,234 7. BNP Paribas Large Cap Fund
BNP Paribas Large Cap Fund
Growth Launch Date 23 Sep 04 NAV (10 Jul 26) ₹218.533 ↑ 1.85 (0.85 %) Net Assets (Cr) ₹2,550 on 31 May 26 Category Equity - Large Cap AMC BNP Paribas Asset Mgmt India Pvt. Ltd Rating ☆☆☆ Risk Moderately High Expense Ratio 2.02 Sharpe Ratio -0.31 Information Ratio 0.68 Alpha Ratio 0.6 Min Investment 5,000 Min SIP Investment 300 Exit Load 0-12 Months (1%),12 Months and above(NIL) Growth of 10,000 investment over the years.
Date Value 30 Jun 21 ₹10,000 30 Jun 22 ₹10,069 30 Jun 23 ₹12,228 30 Jun 24 ₹17,289 30 Jun 25 ₹17,763 30 Jun 26 ₹17,138 Returns for BNP Paribas Large Cap Fund
absolute basis & more than 1 year are on CAGR (Compound Annual Growth Rate) basis. as on 28 Jul 23 Duration Returns 1 Month 4.2% 3 Month 2.3% 6 Month -2.1% 1 Year -2.1% 3 Year 12% 5 Year 11.5% 10 Year 15 Year Since launch 15.2% Historical performance (Yearly) on absolute basis
Year Returns 2025 4.4% 2024 20.1% 2023 24.8% 2022 4.2% 2021 22.1% 2020 16.8% 2019 17.2% 2018 -4% 2017 37% 2016 -5.5% Fund Manager information for BNP Paribas Large Cap Fund
Name Since Tenure Jitendra Sriram 16 Jun 22 4.04 Yr. Kushant Arora 21 Oct 24 1.69 Yr. Data below for BNP Paribas Large Cap Fund as on 31 May 26
Equity Sector Allocation
Sector Value Financial Services 26.39% Industrials 14.5% Consumer Cyclical 10.07% Technology 9.09% Energy 7.84% Consumer Defensive 6.98% Utility 5.97% Basic Materials 5.97% Health Care 5.24% Communication Services 3.94% Asset Allocation
Asset Class Value Cash 2.29% Equity 97.26% Debt 0.45% Top Securities Holdings / Portfolio
Name Holding Value Quantity Hitachi Energy India Ltd Ordinary Shares (Industrials)
Equity, Since 31 Aug 23 | POWERINDIA6% ₹154 Cr 40,050
↓ -1,710 Reliance Industries Ltd (Energy)
Equity, Since 30 Sep 17 | RELIANCE6% ₹149 Cr 1,125,000 HDFC Bank Ltd (Financial Services)
Equity, Since 31 Jul 08 | HDFCBANK6% ₹147 Cr 1,980,000 ICICI Bank Ltd (Financial Services)
Equity, Since 30 Jun 12 | ICICIBANK6% ₹144 Cr 1,143,000 Larsen & Toubro Ltd (Industrials)
Equity, Since 30 Apr 20 | LT4% ₹110 Cr 270,000 Bharti Airtel Ltd (Communication Services)
Equity, Since 29 Feb 08 | BHARTIARTL4% ₹100 Cr 549,000 State Bank of India (Financial Services)
Equity, Since 31 Jul 20 | SBIN3% ₹75 Cr 774,000 Kotak Mahindra Bank Ltd (Financial Services)
Equity, Since 28 Feb 15 | KOTAKBANK3% ₹69 Cr 1,800,000 Infosys Ltd (Technology)
Equity, Since 31 Mar 09 | INFY2% ₹63 Cr 540,000 Eternal Ltd (Consumer Cyclical)
Equity, Since 31 Aug 23 | ETERNAL2% ₹61 Cr 2,430,000 8. TATA Large Cap Fund
TATA Large Cap Fund
Growth Launch Date 7 May 98 NAV (10 Jul 26) ₹510.31 ↑ 5.91 (1.17 %) Net Assets (Cr) ₹2,682 on 31 May 26 Category Equity - Large Cap AMC Tata Asset Management Limited Rating ☆☆☆ Risk Moderately High Expense Ratio 2.05 Sharpe Ratio -0.23 Information Ratio 0.32 Alpha Ratio 2.18 Min Investment 5,000 Min SIP Investment 150 Exit Load 0-365 Days (1%),365 Days and above(NIL) Growth of 10,000 investment over the years.
Date Value 30 Jun 21 ₹10,000 30 Jun 22 ₹9,948 30 Jun 23 ₹12,285 30 Jun 24 ₹16,504 30 Jun 25 ₹17,026 30 Jun 26 ₹16,814 Returns for TATA Large Cap Fund
absolute basis & more than 1 year are on CAGR (Compound Annual Growth Rate) basis. as on 28 Jul 23 Duration Returns 1 Month 5% 3 Month 4% 6 Month -1.2% 1 Year 0.7% 3 Year 11.6% 5 Year 11.3% 10 Year 15 Year Since launch 18.2% Historical performance (Yearly) on absolute basis
Year Returns 2025 9.2% 2024 12.9% 2023 24.5% 2022 3.3% 2021 32.7% 2020 8.3% 2019 12.1% 2018 -3.6% 2017 29.5% 2016 2.9% Fund Manager information for TATA Large Cap Fund
Name Since Tenure Abhinav Sharma 5 Apr 23 3.24 Yr. Hasmukh Vishariya 1 Mar 25 1.33 Yr. Data below for TATA Large Cap Fund as on 31 May 26
Equity Sector Allocation
Sector Value Financial Services 32.19% Industrials 11.35% Consumer Cyclical 9.47% Technology 7.93% Basic Materials 7.36% Communication Services 7.25% Utility 6.31% Energy 6.28% Health Care 4.82% Consumer Defensive 4.66% Asset Allocation
Asset Class Value Cash 2.38% Equity 97.62% Top Securities Holdings / Portfolio
Name Holding Value Quantity ICICI Bank Ltd (Financial Services)
Equity, Since 31 Mar 11 | ICICIBANK8% ₹221 Cr 1,760,300
↓ -80,000 HDFC Bank Ltd (Financial Services)
Equity, Since 30 Apr 07 | HDFCBANK6% ₹162 Cr 2,171,900 Bharti Airtel Ltd (Communication Services)
Equity, Since 31 Jan 25 | BHARTIARTL6% ₹155 Cr 845,000 Reliance Industries Ltd (Energy)
Equity, Since 30 Apr 05 | RELIANCE5% ₹139 Cr 1,050,000 Kotak Mahindra Bank Ltd (Financial Services)
Equity, Since 31 Oct 16 | KOTAKBANK4% ₹96 Cr 2,495,000 Larsen & Toubro Ltd (Industrials)
Equity, Since 31 Dec 20 | LT4% ₹95 Cr 232,784 Infosys Ltd (Technology)
Equity, Since 31 Jan 09 | INFY3% ₹88 Cr 758,248 Adani Energy Solutions Ltd (Utilities)
Equity, Since 31 May 24 | ADANIENSOL3% ₹80 Cr 528,193
↑ 70,000 Axis Bank Ltd (Financial Services)
Equity, Since 31 Aug 18 | AXISBANK3% ₹80 Cr 620,000
↓ -200,000 State Bank of India (Financial Services)
Equity, Since 30 Apr 14 | SBIN3% ₹79 Cr 821,000 9. Kotak Bluechip Fund
Kotak Bluechip Fund
Growth Launch Date 29 Dec 98 NAV (10 Jul 26) ₹567.748 ↑ 6.34 (1.13 %) Net Assets (Cr) ₹10,516 on 31 May 26 Category Equity - Large Cap AMC Kotak Mahindra Asset Management Co Ltd Rating ☆☆☆ Risk Moderately High Expense Ratio 1.75 Sharpe Ratio -0.44 Information Ratio 0.04 Alpha Ratio -1.4 Min Investment 5,000 Min SIP Investment 100 Exit Load 0-18 Months (1%),18 Months and above(NIL) Growth of 10,000 investment over the years.
Date Value 30 Jun 21 ₹10,000 30 Jun 22 ₹9,862 30 Jun 23 ₹12,005 30 Jun 24 ₹16,025 30 Jun 25 ₹17,030 30 Jun 26 ₹16,375 Returns for Kotak Bluechip Fund
absolute basis & more than 1 year are on CAGR (Compound Annual Growth Rate) basis. as on 28 Jul 23 Duration Returns 1 Month 5.2% 3 Month 2.2% 6 Month -3.1% 1 Year -1.8% 3 Year 11.3% 5 Year 10.7% 10 Year 15 Year Since launch 17.1% Historical performance (Yearly) on absolute basis
Year Returns 2025 8.7% 2024 16.2% 2023 22.9% 2022 2% 2021 27.7% 2020 16.4% 2019 14.2% 2018 -2.1% 2017 29.2% 2016 2.9% Fund Manager information for Kotak Bluechip Fund
Name Since Tenure Rohit Tandon 22 Jan 24 2.44 Yr. Data below for Kotak Bluechip Fund as on 31 May 26
Equity Sector Allocation
Sector Value Financial Services 29.13% Consumer Cyclical 12.13% Industrials 9.55% Basic Materials 9.37% Technology 8.34% Energy 7.6% Consumer Defensive 5.59% Health Care 5.48% Utility 4.05% Communication Services 3.97% Real Estate 0.88% Asset Allocation
Asset Class Value Cash 2.84% Equity 97.15% Other 0% Top Securities Holdings / Portfolio
Name Holding Value Quantity ICICI Bank Ltd (Financial Services)
Equity, Since 31 Oct 09 | ICICIBANK7% ₹734 Cr 5,845,718
↑ 12,600 Reliance Industries Ltd (Energy)
Equity, Since 30 Apr 06 | RELIANCE6% ₹673 Cr 5,094,835 HDFC Bank Ltd (Financial Services)
Equity, Since 31 Jul 23 | HDFCBANK6% ₹658 Cr 8,831,297
↑ 200,000 Larsen & Toubro Ltd (Industrials)
Equity, Since 31 Mar 12 | LT4% ₹449 Cr 1,101,821
↓ -350 State Bank of India (Financial Services)
Equity, Since 30 Jun 21 | SBIN4% ₹441 Cr 4,575,911
↑ 102,553 Bharti Airtel Ltd (Communication Services)
Equity, Since 31 Oct 19 | BHARTIARTL4% ₹418 Cr 2,282,909 Axis Bank Ltd (Financial Services)
Equity, Since 28 Feb 13 | AXISBANK3% ₹342 Cr 2,655,625
↑ 10,000 NTPC Ltd (Utilities)
Equity, Since 31 Oct 23 | NTPC3% ₹335 Cr 8,648,083 Infosys Ltd (Technology)
Equity, Since 31 Oct 04 | INFY3% ₹329 Cr 2,835,817 Bajaj Finance Ltd (Financial Services)
Equity, Since 30 Nov 19 | BAJFINANCE3% ₹313 Cr 3,447,863 10. HDFC Top 100 Fund
HDFC Top 100 Fund
Growth Launch Date 11 Oct 96 NAV (10 Jul 26) ₹1,136.98 ↑ 8.45 (0.75 %) Net Assets (Cr) ₹37,808 on 31 May 26 Category Equity - Large Cap AMC HDFC Asset Management Company Limited Rating ☆☆☆ Risk Moderately High Expense Ratio 1.61 Sharpe Ratio -0.49 Information Ratio -0.05 Alpha Ratio -2.19 Min Investment 5,000 Min SIP Investment 300 Exit Load 0-1 Years (1%),1 Years and above(NIL) Growth of 10,000 investment over the years.
Date Value 30 Jun 21 ₹10,000 30 Jun 22 ₹10,400 30 Jun 23 ₹13,144 30 Jun 24 ₹17,710 30 Jun 25 ₹18,473 30 Jun 26 ₹17,825 Returns for HDFC Top 100 Fund
absolute basis & more than 1 year are on CAGR (Compound Annual Growth Rate) basis. as on 28 Jul 23 Duration Returns 1 Month 6.6% 3 Month 3.5% 6 Month -2.9% 1 Year -0.8% 3 Year 11.2% 5 Year 12.8% 10 Year 15 Year Since launch 18.1% Historical performance (Yearly) on absolute basis
Year Returns 2025 7.9% 2024 11.6% 2023 30% 2022 10.6% 2021 28.5% 2020 5.9% 2019 7.7% 2018 0.1% 2017 32% 2016 8.5% Fund Manager information for HDFC Top 100 Fund
Name Since Tenure Rahul Baijal 29 Jul 22 3.93 Yr. Dhruv Muchhal 22 Jun 23 3.03 Yr. Data below for HDFC Top 100 Fund as on 31 May 26
Equity Sector Allocation
Sector Value Financial Services 37.34% Consumer Cyclical 18.35% Health Care 9.89% Industrials 8.27% Communication Services 5.77% Energy 5.22% Consumer Defensive 3.99% Technology 2.98% Basic Materials 2.91% Utility 2.28% Real Estate 0.33% Asset Allocation
Asset Class Value Cash 2.17% Equity 97.33% Debt 0.5% Top Securities Holdings / Portfolio
Name Holding Value Quantity ICICI Bank Ltd (Financial Services)
Equity, Since 31 Dec 05 | ICICIBANK9% ₹3,470 Cr 27,615,474 HDFC Bank Ltd (Financial Services)
Equity, Since 31 Jan 10 | HDFCBANK8% ₹2,885 Cr 38,752,638 Bharti Airtel Ltd (Communication Services)
Equity, Since 30 Apr 20 | BHARTIARTL6% ₹2,180 Cr 11,921,785 Kotak Mahindra Bank Ltd (Financial Services)
Equity, Since 31 Aug 23 | KOTAKBANK6% ₹2,089 Cr 54,361,056 Reliance Industries Ltd (Energy)
Equity, Since 31 Mar 06 | RELIANCE5% ₹1,975 Cr 14,950,234 Titan Co Ltd (Consumer Cyclical)
Equity, Since 28 Feb 23 | TITAN4% ₹1,680 Cr 4,121,802 Torrent Pharmaceuticals Ltd (Healthcare)
Equity, Since 31 Mar 25 | TORNTPHARM4% ₹1,403 Cr 3,180,904 Axis Bank Ltd (Financial Services)
Equity, Since 31 Jan 07 | AXISBANK4% ₹1,378 Cr 10,711,912 Bajaj Auto Ltd (Consumer Cyclical)
Equity, Since 31 Dec 20 | BAJAJ-AUTO3% ₹1,178 Cr 1,126,298 Bajaj Finserv Ltd (Financial Services)
Equity, Since 30 Jun 25 | BAJAJFINSV3% ₹1,172 Cr 6,572,078
↑ 622,490 11. Aditya Birla Sun Life Frontline Equity Fund
Aditya Birla Sun Life Frontline Equity Fund
Growth Launch Date 30 Aug 02 NAV (10 Jul 26) ₹517.71 ↑ 5.47 (1.07 %) Net Assets (Cr) ₹28,640 on 31 May 26 Category Equity - Large Cap AMC Birla Sun Life Asset Management Co Ltd Rating ☆☆☆☆ Risk Moderately High Expense Ratio 1.65 Sharpe Ratio -0.48 Information Ratio 0.04 Alpha Ratio -2.06 Min Investment 1,000 Min SIP Investment 100 Exit Load 0-365 Days (1%),365 Days and above(NIL) Growth of 10,000 investment over the years.
Date Value 30 Jun 21 ₹10,000 30 Jun 22 ₹10,063 30 Jun 23 ₹12,418 30 Jun 24 ₹16,418 30 Jun 25 ₹17,617 30 Jun 26 ₹16,662 Returns for Aditya Birla Sun Life Frontline Equity Fund
absolute basis & more than 1 year are on CAGR (Compound Annual Growth Rate) basis. as on 28 Jul 23 Duration Returns 1 Month 5.4% 3 Month 2.5% 6 Month -4.3% 1 Year -3% 3 Year 10.8% 5 Year 11.1% 10 Year 15 Year Since launch 18% Historical performance (Yearly) on absolute basis
Year Returns 2025 9.4% 2024 15.6% 2023 23.1% 2022 3.5% 2021 27.9% 2020 14.2% 2019 7.6% 2018 -2.9% 2017 30.6% 2016 7.4% Fund Manager information for Aditya Birla Sun Life Frontline Equity Fund
Name Since Tenure Harish Krishnan 8 Jan 26 0.48 Yr. Data below for Aditya Birla Sun Life Frontline Equity Fund as on 31 May 26
Equity Sector Allocation
Sector Value Financial Services 34.95% Consumer Cyclical 16.11% Technology 8.24% Consumer Defensive 6.65% Basic Materials 6.3% Health Care 5.98% Industrials 5.87% Energy 5.77% Utility 4.14% Communication Services 3.49% Real Estate 0.92% Asset Allocation
Asset Class Value Cash 0.95% Equity 98.92% Debt 0.12% Top Securities Holdings / Portfolio
Name Holding Value Quantity ICICI Bank Ltd (Financial Services)
Equity, Since 31 Oct 09 | ICICIBANK7% ₹2,054 Cr 16,348,292 HDFC Bank Ltd (Financial Services)
Equity, Since 30 Apr 07 | HDFCBANK7% ₹1,899 Cr 25,500,000 Reliance Industries Ltd (Energy)
Equity, Since 30 Apr 05 | RELIANCE5% ₹1,506 Cr 11,395,468 Infosys Ltd (Technology)
Equity, Since 30 Apr 05 | INFY4% ₹1,206 Cr 10,390,550 Axis Bank Ltd (Financial Services)
Equity, Since 31 Aug 13 | AXISBANK4% ₹1,126 Cr 8,753,823 Kotak Mahindra Bank Ltd (Financial Services)
Equity, Since 30 Apr 15 | KOTAKBANK4% ₹1,031 Cr 26,836,371 Bharti Airtel Ltd (Communication Services)
Equity, Since 31 Oct 17 | BHARTIARTL3% ₹1,000 Cr 5,469,031 Larsen & Toubro Ltd (Industrials)
Equity, Since 30 Apr 08 | LT3% ₹978 Cr 2,400,000
↓ -337,700 State Bank of India (Financial Services)
Equity, Since 31 Oct 08 | SBIN3% ₹956 Cr 9,908,250
↓ -591,750 Mahindra & Mahindra Ltd (Consumer Cyclical)
Equity, Since 28 Feb 15 | M&M3% ₹923 Cr 3,031,152
बेस्ट लार्ज कैप म्यूचुअल फंड में निवेश क्यों करें
1. स्थिर निवेश
बड़ी कंपनियां अच्छी तरह से स्थापित हैं, जिसका अर्थ है कि उनके पास अधिक सुसंगत हैआय. लार्ज कैप फंड उन कंपनियों में निवेश करता है जो बड़ी हैं, जो कई वर्षों से हैं, उनके पास एक स्थिर कार्यबल और एक स्थापित उत्पाद / सेवा है जो राजस्व उत्पन्न करती है। यही कारण है कि लार्ज कैप शेयरों के सबसे बड़े लाभों में से एक उनके द्वारा प्रदान की जाने वाली स्थिरता है। यह लार्ज कैप म्यूचुअल फंड के पोर्टफोलियो में और इसके पोर्टफोलियो में परिलक्षित होता है।नहीं हैं बहुत।
2. स्थिर रिटर्न
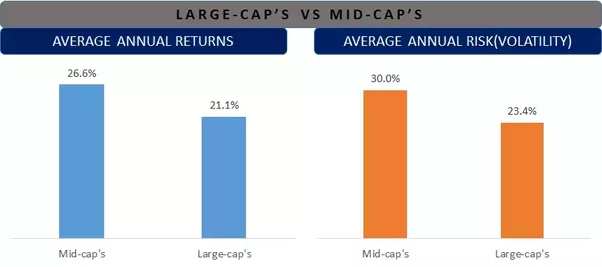
लंबी अवधि में, हालांकि लार्ज-कैप फंडों में मिड- और स्मॉल-कैप फंडों की तुलना में कम रिटर्न होता है, लेकिन लार्ज कैप में रिटर्न अधिक स्थिर होता है। मिड-कैप में अस्थिरता बहुत अधिक होती है और लार्ज कैप की तुलना में मिड कैप में अधिक नुकसान होता है। एक के रूप मेंइन्वेस्टर अगर कोई इक्विटी में निवेश करना चाहता है, तो लार्ज कैप म्यूचुअल फंड में निवेश एक शुरुआती बिंदु हो सकता है।
3. कम अस्थिर
लार्ज कैप फंड मिड और स्मॉल कैप फंड की तुलना में कम अस्थिर होते हैं। ऐतिहासिक आंकड़ों से भी यह बात साबित हो चुकी है। नीचे दी गई छवि में लार्ज कैप के पिछले 15 वर्षों के औसत वार्षिक रिटर्न का विश्लेषण है। यह बीएसई सेंसेक्स को लार्ज-कैप और बीएसई के लिए प्रॉक्सी के रूप में उपयोग करके किया जाता हैमध्यम दर्जे की कंपनियों के शेयर मिडकैप के लिए।
4. मध्यम उच्च जोखिम
चूंकि निवेश बड़ी कंपनियों में किया जाता है, इसलिए इन फंडों में मिड और स्मॉल-कैप फंडों की तुलना में कम जोखिम होता है। लेकिन, अल्पावधि में इक्विटी में नुकसान हो सकता है। इसलिए, नुकसान देखने के लिए तैयार रहना चाहिए और उसी पर नींद नहीं खोनी चाहिए। यदि किसी के पास लंबी होल्डिंग अवधि (कम से कम 5 वर्ष से अधिक) है और निवेश की कुछ बुनियादी बातों का पालन करता है, तो वह अच्छी मात्रा में लाभ कमा सकता है।
बेस्ट लार्ज कैप फंड्स में ऑनलाइन निवेश कैसे करें?
Fincash.com पर आजीवन मुफ्त निवेश खाता खोलें
अपना पंजीकरण और केवाईसी प्रक्रिया पूरी करें
Upload Documents (PAN, Aadhaar, etc.). और, आप निवेश करने के लिए तैयार हैं!
निष्कर्ष
चूंकि लार्ज कैप फंड बड़े बाजार पूंजीकरण वाली कंपनियों में निवेश करते हैं, इसलिए इन फर्मों के पास खराब बाजारों और आर्थिक चक्रों से बचने के लिए आकार और पैमाना होता है। इसलिए, लार्ज कैप में निवेश को सभी इक्विटी म्यूचुअल फंड श्रेणियों में सबसे सुरक्षित माना जाता है। हालांकि, किसी को हमेशा याद रखना चाहिए किआधारभूत निवेश इक्विटी है और इसमें जोखिम हैं। जबकि लार्ज कैप के जोखिम अपेक्षाकृत कम हैं, रिटर्न भी स्थिर रहेगा और बुल मार्केट चरणों के दौरान असाधारण रिटर्न नहीं होगा। ऐसे निवेशक जो कुछ हद तक जोखिम के साथ मध्यम लेकिन निरंतर रिटर्न पसंद करते हैं; सर्वश्रेष्ठ लार्ज कैप फंड में निवेश कर सकते हैं!
यहां प्रदान की गई जानकारी सटीक है, यह सुनिश्चित करने के लिए सभी प्रयास किए गए हैं। हालांकि, डेटा की शुद्धता के संबंध में कोई गारंटी नहीं दी जाती है। कृपया कोई भी निवेश करने से पहले योजना सूचना दस्तावेज के साथ सत्यापित करें।


AMFI Registration No. 112358 | CIN: U74999MH2016PTC282153
Shepard Technologies Pvt. Ltd. (with ARN code 112358) makes no warranties or representations, express or implied, on products offered through the platform. It accepts no liability for any damages or losses, however caused, in connection with the use of, or on the reliance of its product or related services. Terms and conditions of the website are applicable.
©2026 Shepard Technologies Private Limited. All Rights Reserved
Superb. Gave very depth information.
Very good and give us about best largecap fund somtimes