நீண்ட கால முதலீட்டிற்கான சிறந்த SIP திட்டங்கள் 2022
முறையான கருத்துமுதலீட்டுத் திட்டம் (எஸ்ஐபி) கடந்த சில ஆண்டுகளாக இந்திய முதலீட்டாளர்கள் மத்தியில் மிகவும் பிரபலமாகி வருகிறது. நீண்ட கால சேமிப்பு பழக்கத்தை உருவாக்க இது ஒரு சிறந்த வழியாகும். இது எதிர்காலத்திற்கான ஒரு பெரிய கார்பஸை உருவாக்க உதவுகிறதுநிதி இலக்குகள். ஒரு SIP இல், ஒரு குறிப்பிட்ட தேதியில் ஒரு நிதியில் மாதந்தோறும் ஒரு நிலையான தொகை முதலீடு செய்யப்படுகிறதுமுதலீட்டாளர். நீங்கள் ஆரம்பித்தவுடன்முதலீடு நீண்ட காலத்திற்கு SIP இல் மாதந்தோறும், உங்கள் பணம் ஒவ்வொரு நாளும் வளரத் தொடங்குகிறது (பங்குகளில் முதலீடு செய்யப்படுகிறதுசந்தை) முறையான முதலீட்டுத் திட்டம் உங்கள் கொள்முதல் செலவை சராசரியாக வைத்து வருமானத்தை அதிகரிக்க உதவுகிறது. ஒரு முதலீட்டாளர் சந்தை நிலவரங்களைப் பொருட்படுத்தாமல், ஒரு குறிப்பிட்ட காலத்திற்குத் தொடர்ந்து முதலீடு செய்யும் போது, அவர் சந்தை குறைவாக இருக்கும்போது அதிக யூனிட்களையும், சந்தை அதிகமாக இருக்கும்போது குறைவான யூனிட்களையும் பெறுவார். இது உங்கள் மியூச்சுவல் ஃபண்ட் யூனிட்களின் கொள்முதல் செலவை சராசரியாகக் கணக்கிடுகிறது. இதேபோல், நீண்ட காலத்திற்கு ஒரு SIP இன் சில முக்கியமான நன்மைகளைப் பார்க்கலாம்.
Talk to our investment specialist
நீண்ட கால SIP முதலீட்டின் நன்மைகள்
SIP இன் சில முக்கியமான நன்மைகள்:
கலவையின் சக்தி
நீங்கள் நீண்ட காலத்திற்கு முதலீடு செய்தால், உங்கள் முதலீடு தொடங்குகிறதுகலவை. இதன் பொருள் என்னவென்றால், உங்கள் முதலீட்டின் மூலம் ஈட்டிய வருமானத்தில் நீங்கள் வருமானம் ஈட்டும்போது, உங்கள் பணம் கூட்டும். வழக்கமான சிறிய முதலீடுகளுடன் நீண்ட காலத்திற்கு ஒரு பெரிய கார்பஸை உருவாக்க இது உதவுகிறது.
இலக்குகளை அடைய உதவுகிறது
SIP என்பது உங்களின் அனைத்து நீண்ட கால நிதி இலக்குகளையும் அடைய ஒரு சிறந்த வழியாகும்ஓய்வு, திருமணம், வீடு/கார் வாங்குதல் போன்றவற்றை முதலீட்டாளர்கள் எளிமையாகத் தொடங்கலாம்மியூச்சுவல் ஃபண்டுகளில் முதலீடு செய்தல் அவர்களின் நிதி இலக்குகளின்படி மற்றும் குறிப்பிட்ட காலத்தில் அவற்றை அடையலாம். ஒருவர் சிறு வயதிலேயே முதலீடு செய்யத் தொடங்கினால், அவர்களின் எஸ்ஐபி வளர போதுமான நேரம் இருக்கிறது. இந்த வழியில் அவர்களின் அனைத்து இலக்குகளையும் சரியான நேரத்தில் நிறைவேற்றுவது எளிதாகிறது.
மலிவு
முறையான முதலீட்டுத் திட்டத்தின் மிகவும் கவர்ச்சிகரமான பகுதிகளில் ஒன்று அதன் மலிவு. ஒருவர் 500 ரூபாய்க்கு குறைவான தொகையை முதலீடு செய்யலாம், இது அதிக எண்ணிக்கையிலான இந்தியர்களுக்கு முதலீடுகளைத் தொடங்க வழிவகை செய்கிறது. எனவே, மொத்தமாக பணம் செலுத்த முடியாத ஒருவர், SIP மூலம் முதலீடு செய்யலாம்பரஸ்பர நிதி.
நீண்ட கால முதலீட்டிற்கு ஏன் SIP சிறந்தது?
மொத்த தொகையை விட நீண்ட காலத்திற்கு SIPகள் எவ்வாறு அதிக லாபம் ஈட்டுகின்றன என்று முதலீட்டாளர்கள் அடிக்கடி ஆச்சரியப்படுகிறார்கள். சரி, வரலாற்றுத் தகவல்கள் அப்படித்தான் கூறுகின்றன! பங்குச் சந்தையின் மோசமான காலகட்டத்தின் தரவைச் சரிபார்ப்போம்.
செப்டம்பர் 1994 இல் முதலீடு தொடங்க மோசமான காலம் (பங்குச் சந்தை உச்சத்தில் இருந்த நேரம் இது). சந்தை தரவுகளைப் பார்த்தால், மொத்தமாக முதலீடு செய்த முதலீட்டாளர் 59 மாதங்கள் (கிட்டத்தட்ட 5 ஆண்டுகள்!) எதிர்மறையான வருமானத்தில் அமர்ந்திருந்தார். முதலீட்டாளர் 1999 ஆம் ஆண்டு ஜூலை மாதத்தில் கூட முறியடிக்கப்பட்டார். அடுத்த ஆண்டு சில வருமானங்கள் உருவாக்கப்பட்டாலும், 2000 பங்குச் சந்தை வீழ்ச்சியின் காரணமாக இந்த வருமானங்கள் குறுகிய காலமாக இருந்தன. மேலும் 4 வருடங்கள் (எதிர்மறையான வருமானத்துடன்) துன்பத்திற்குப் பிறகு, முதலீட்டாளர் இறுதியாக அக்டோபர் 2003 இல் நேர்மறையாக மாறினார். மொத்த தொகையை முதலீடு செய்ததற்கு இதுவே மோசமான நேரமாக இருக்கலாம்.
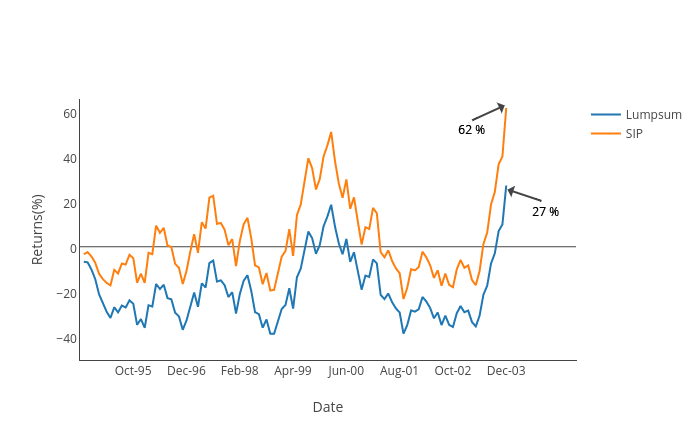
SIP முதலீட்டாளருக்கு என்ன ஆனது? முறையான முதலீட்டுத் திட்ட முதலீட்டாளர் 19 மாதங்களுக்கு மட்டுமே எதிர்மறையாக இருந்தார் மற்றும் லாபத்தைப் பதிவு செய்யத் தொடங்கினார், இருப்பினும், இவை குறுகிய காலமே. SIP முதலீட்டாளர்கள் இடைக்கால இழப்புகளுக்குப் பிறகு மே 1999 இல் மீண்டும் உயர்ந்தனர். பயணம் இன்னும் நடுங்கும் போது, SIP முதலீட்டாளர்கள் மிகவும் முன்னதாகவே போர்ட்ஃபோலியோவில் லாபத்தைக் காட்டினர்.
எனவே, யார் அதிக லாபம் ஈட்டினார்கள்? மொத்த தொகை முதலீட்டாளருக்கு அதிகபட்ச இழப்பு கிட்டத்தட்ட 40% ஆகும், அதேசமயம் SIP முதலீட்டாளருக்கு 23% ஆகும். முறையான முதலீட்டுத் திட்ட முதலீட்டாளர் விரைவான மீட்புக் காலத்தையும், போர்ட்ஃபோலியோவில் குறைந்த இழப்பையும் கொண்டிருந்தார்.
நீண்ட கால SIP முதலீட்டிற்கான சிறந்த பரஸ்பர நிதிகள்
அவற்றில் சிலசிறந்த பரஸ்பர நிதிகள் நீண்ட காலத்திற்கான SIP பின்வருமாறு-
நீண்ட கால SIPக்கான சிறந்த லார்ஜ் கேப் நிதிகள்
பெரிய தொப்பி நிதிகள் ஒரு வகைஈக்விட்டி மியூச்சுவல் ஃபண்டுகள் பெரிய சந்தை மூலதனம் கொண்ட நிறுவனங்களின் பங்குகளில் கார்பஸ் முதலீடு செய்யப்படுகிறது. இந்த நிறுவனங்கள் முக்கியமாக பெரிய வணிகங்கள் மற்றும் பெரிய குழுக்களைக் கொண்ட பெரிய நிறுவனங்களாகும். இந்த நிறுவனங்களின் சந்தை மூலதனம் INR 1000 Cr & அதற்கு மேல். பெரிய நிறுவனங்களில் முதலீடுகள் செய்யப்படுவதால், இந்த நிறுவனங்கள் ஆண்டுக்கு ஆண்டு நிலையான வளர்ச்சியைக் காட்ட அதிக வாய்ப்பைக் கொண்டுள்ளன, இது ஒரு காலத்தில் ஸ்திரத்தன்மையை வழங்குகிறது. இந்த நிதிகள் பாதுகாப்பானவை மற்றும் சந்தை ஏற்ற இறக்கங்களுக்கு நடுப்பகுதியுடன் ஒப்பிடும்போது குறைந்த நிலையற்றதாகக் கருதப்படுகிறது.சிறிய தொப்பி நிதிகள்.
Fund NAV Net Assets (Cr) Min SIP Investment 3 MO (%) 6 MO (%) 1 YR (%) 3 YR (%) 5 YR (%) 2025 (%) Invesco India Largecap Fund Growth ₹71.1
↓ -0.43 ₹1,749 100 6.6 2.2 2.8 13.6 12.5 5.5 Nippon India Large Cap Fund Growth ₹89.4064
↓ -0.64 ₹51,660 100 2.9 -2.4 -0.8 12.9 15 9.2 ICICI Prudential Bluechip Fund Growth ₹108.28
↓ -0.69 ₹76,297 100 2.2 -4.1 -1.3 12.9 13.3 11.3 Bandhan Large Cap Fund Growth ₹77.768
↓ -0.59 ₹2,001 100 4.9 -1.1 2.4 12.7 11.9 8.2 DSP TOP 100 Equity Growth ₹457.37
↓ -3.73 ₹7,175 500 2.1 -3.9 -3.1 12.5 10.6 8.4 Note: Returns up to 1 year are on absolute basis & more than 1 year are on CAGR basis. as on 14 Jul 26 Research Highlights & Commentary of 5 Funds showcased
Commentary Invesco India Largecap Fund Nippon India Large Cap Fund ICICI Prudential Bluechip Fund Bandhan Large Cap Fund DSP TOP 100 Equity Point 1 Bottom quartile AUM (₹1,749 Cr). Upper mid AUM (₹51,660 Cr). Highest AUM (₹76,297 Cr). Bottom quartile AUM (₹2,001 Cr). Lower mid AUM (₹7,175 Cr). Point 2 Established history (16+ yrs). Established history (18+ yrs). Established history (18+ yrs). Established history (20+ yrs). Oldest track record among peers (23 yrs). Point 3 Rating: 3★ (lower mid). Top rated. Rating: 4★ (upper mid). Rating: 2★ (bottom quartile). Rating: 2★ (bottom quartile). Point 4 Risk profile: Moderately High. Risk profile: Moderately High. Risk profile: Moderately High. Risk profile: Moderately High. Risk profile: Moderately High. Point 5 5Y return: 12.53% (lower mid). 5Y return: 15.05% (top quartile). 5Y return: 13.29% (upper mid). 5Y return: 11.93% (bottom quartile). 5Y return: 10.59% (bottom quartile). Point 6 3Y return: 13.59% (top quartile). 3Y return: 12.89% (upper mid). 3Y return: 12.88% (lower mid). 3Y return: 12.72% (bottom quartile). 3Y return: 12.52% (bottom quartile). Point 7 1Y return: 2.76% (top quartile). 1Y return: -0.82% (lower mid). 1Y return: -1.32% (bottom quartile). 1Y return: 2.35% (upper mid). 1Y return: -3.08% (bottom quartile). Point 8 Alpha: 1.94 (upper mid). Alpha: 0.46 (lower mid). Alpha: -1.97 (bottom quartile). Alpha: 1.95 (top quartile). Alpha: -4.25 (bottom quartile). Point 9 Sharpe: -0.24 (top quartile). Sharpe: -0.35 (lower mid). Sharpe: -0.48 (bottom quartile). Sharpe: -0.26 (upper mid). Sharpe: -0.67 (bottom quartile). Point 10 Information ratio: 0.75 (lower mid). Information ratio: 1.03 (top quartile). Information ratio: 0.90 (upper mid). Information ratio: 0.66 (bottom quartile). Information ratio: 0.56 (bottom quartile). Invesco India Largecap Fund
Nippon India Large Cap Fund
ICICI Prudential Bluechip Fund
Bandhan Large Cap Fund
DSP TOP 100 Equity
நீண்ட கால SIPக்கான சிறந்த மிட் & ஸ்மால் கேப் நிதிகள்
மிட் கேப் மற்றும் ஸ்மால் கேப் ஃபண்டுகள் இந்தியாவில் வளர்ந்து வரும் நிறுவனங்களில் முதலீடு செய்யும் ஒரு வகையான ஈக்விட்டி மியூச்சுவல் ஃபண்ட் ஆகும்.நடுத்தர தொப்பி நிதிகள் 500 முதல் 1000 கோடி வரை சந்தை மூலதனம் உள்ள நிறுவனங்களில் முதலீடு செய்யுங்கள். மேலும், சிறிய தொப்பிகள் பொதுவாக 500 கோடி ரூபாய் சந்தை மூலதனம் கொண்ட நிறுவனங்களாக வரையறுக்கப்படுகின்றன. இந்த நிறுவனங்கள் சந்தையின் எதிர்கால தலைவர் என்று அழைக்கப்படுகின்றன. எதிர்காலத்தில் நிறுவனம் சிறப்பாக செயல்பட்டால், இந்த நிதிகள் நீண்ட காலத்திற்கு நல்ல வருவாயை வழங்குவதற்கான சிறந்த ஆற்றலைக் கொண்டுள்ளன. ஆனால், மிட் & ஸ்மால் கேப் ஃபண்டுகளில் ரிஸ்க் அதிகம். எனவே, ஒரு முதலீட்டாளர் இந்த நிதிகளில் முதலீடு செய்யும்போது, அவர்கள் நீண்ட காலத்திற்கு முதலீடு செய்ய வேண்டும்.
Fund NAV Net Assets (Cr) Min SIP Investment 3 MO (%) 6 MO (%) 1 YR (%) 3 YR (%) 5 YR (%) 2025 (%) Motilal Oswal Midcap 30 Fund Growth ₹98.8666
↓ -0.34 ₹36,458 500 10.4 1.5 -2.7 19.2 22.1 -12.1 Invesco India Mid Cap Fund Growth ₹197.62
↓ -2.00 ₹12,397 500 16.3 12.1 10.9 25.4 20 6.3 HDFC Mid-Cap Opportunities Fund Growth ₹207.596
↓ -1.41 ₹97,350 300 8.2 4.2 6.6 20.1 19.8 6.8 Nippon India Small Cap Fund Growth ₹180.511
↓ -1.55 ₹74,604 100 13.2 12.7 5.3 17.8 19.4 -4.7 Edelweiss Mid Cap Fund Growth ₹107.744
↓ -0.76 ₹16,849 500 9 6 7.5 22.8 18.4 3.8 Note: Returns up to 1 year are on absolute basis & more than 1 year are on CAGR basis. as on 14 Jul 26 Research Highlights & Commentary of 5 Funds showcased
Commentary Motilal Oswal Midcap 30 Fund Invesco India Mid Cap Fund HDFC Mid-Cap Opportunities Fund Nippon India Small Cap Fund Edelweiss Mid Cap Fund Point 1 Lower mid AUM (₹36,458 Cr). Bottom quartile AUM (₹12,397 Cr). Highest AUM (₹97,350 Cr). Upper mid AUM (₹74,604 Cr). Bottom quartile AUM (₹16,849 Cr). Point 2 Established history (12+ yrs). Oldest track record among peers (19 yrs). Established history (19+ yrs). Established history (15+ yrs). Established history (18+ yrs). Point 3 Rating: 3★ (upper mid). Rating: 2★ (bottom quartile). Rating: 3★ (lower mid). Top rated. Rating: 3★ (bottom quartile). Point 4 Risk profile: Moderately High. Risk profile: Moderately High. Risk profile: Moderately High. Risk profile: Moderately High. Risk profile: High. Point 5 5Y return: 22.12% (top quartile). 5Y return: 19.98% (upper mid). 5Y return: 19.78% (lower mid). 5Y return: 19.37% (bottom quartile). 5Y return: 18.38% (bottom quartile). Point 6 3Y return: 19.21% (bottom quartile). 3Y return: 25.40% (top quartile). 3Y return: 20.14% (lower mid). 3Y return: 17.84% (bottom quartile). 3Y return: 22.82% (upper mid). Point 7 1Y return: -2.70% (bottom quartile). 1Y return: 10.93% (top quartile). 1Y return: 6.59% (lower mid). 1Y return: 5.26% (bottom quartile). 1Y return: 7.53% (upper mid). Point 8 Alpha: -14.76 (bottom quartile). Alpha: 0.00 (lower mid). Alpha: -0.97 (bottom quartile). Alpha: 2.35 (top quartile). Alpha: 0.35 (upper mid). Point 9 Sharpe: -0.55 (bottom quartile). Sharpe: 0.21 (top quartile). Sharpe: 0.12 (lower mid). Sharpe: 0.05 (bottom quartile). Sharpe: 0.19 (upper mid). Point 10 Information ratio: -0.36 (bottom quartile). Information ratio: 0.00 (upper mid). Information ratio: -0.04 (lower mid). Information ratio: -0.24 (bottom quartile). Information ratio: 0.30 (top quartile). Motilal Oswal Midcap 30 Fund
Invesco India Mid Cap Fund
HDFC Mid-Cap Opportunities Fund
Nippon India Small Cap Fund
Edelweiss Mid Cap Fund
நீண்ட கால SIPக்கான சிறந்த பல்வகைப்பட்ட நிதிகள்
பன்முகப்படுத்தப்பட்ட நிதிகள் ஈக்விட்டி மியூச்சுவல் ஃபண்டுகளின் ஒரு வகுப்பாகும். இவை சந்தை மூலதனம் முழுவதும் முதலீடு செய்யும் நிதிகள், அதாவது பெரிய, நடுத்தர மற்றும் சிறிய தொப்பி நிதிகளில். பன்முகப்படுத்தப்பட்ட நிதிகள் சந்தை வரம்பில் முதலீடு செய்வதால், அவை போர்ட்ஃபோலியோவை சமநிலைப்படுத்துவதில் தேர்ச்சி பெற்றுள்ளன. பன்முகப்படுத்தப்பட்ட நிதிகளில் முதலீடு செய்வதன் மூலம் முதலீட்டாளர்கள் தங்கள் போர்ட்ஃபோலியோவில் நல்ல சமநிலையை உருவாக்க முடியும். இருப்பினும், ஒரு நிலையற்ற சந்தை நிலையின் போது பங்குகளின் ஏற்ற இறக்கத்தால் அவை இன்னும் பாதிக்கப்படும்.
Fund NAV Net Assets (Cr) Min SIP Investment 3 MO (%) 6 MO (%) 1 YR (%) 3 YR (%) 5 YR (%) 2025 (%) IDBI Diversified Equity Fund Growth ₹37.99
↑ 0.14 ₹382 500 10.2 13.2 13.5 22.7 12 Aditya Birla Sun Life Manufacturing Equity Fund Growth ₹37.3
↓ -0.10 ₹1,198 1,000 11.3 14.3 17.4 20.2 13.9 3.5 Motilal Oswal Multicap 35 Fund Growth ₹59.9568
↓ -0.04 ₹12,937 500 8.6 -0.5 -3.5 18.5 12 -5.6 Mahindra Badhat Yojana Growth ₹38.101
↓ -0.22 ₹6,643 500 9.9 6.9 6.5 18 15.9 3.4 ICICI Prudential Multicap Fund Growth ₹845.64
↓ -5.72 ₹17,676 100 8.5 7.8 6.4 17.6 15.6 5.7 Note: Returns up to 1 year are on absolute basis & more than 1 year are on CAGR basis. as on 28 Jul 23 Research Highlights & Commentary of 5 Funds showcased
Commentary IDBI Diversified Equity Fund Aditya Birla Sun Life Manufacturing Equity Fund Motilal Oswal Multicap 35 Fund Mahindra Badhat Yojana ICICI Prudential Multicap Fund Point 1 Bottom quartile AUM (₹382 Cr). Bottom quartile AUM (₹1,198 Cr). Upper mid AUM (₹12,937 Cr). Lower mid AUM (₹6,643 Cr). Highest AUM (₹17,676 Cr). Point 2 Established history (12+ yrs). Established history (11+ yrs). Established history (12+ yrs). Established history (9+ yrs). Oldest track record among peers (31 yrs). Point 3 Rating: 2★ (lower mid). Not Rated. Top rated. Not Rated. Rating: 3★ (upper mid). Point 4 Risk profile: Moderately High. Risk profile: High. Risk profile: Moderately High. Risk profile: Moderately High. Risk profile: Moderately High. Point 5 5Y return: 12.03% (bottom quartile). 5Y return: 13.88% (lower mid). 5Y return: 12.05% (bottom quartile). 5Y return: 15.89% (top quartile). 5Y return: 15.63% (upper mid). Point 6 3Y return: 22.73% (top quartile). 3Y return: 20.17% (upper mid). 3Y return: 18.49% (lower mid). 3Y return: 18.03% (bottom quartile). 3Y return: 17.56% (bottom quartile). Point 7 1Y return: 13.54% (upper mid). 1Y return: 17.39% (top quartile). 1Y return: -3.54% (bottom quartile). 1Y return: 6.55% (lower mid). 1Y return: 6.41% (bottom quartile). Point 8 Alpha: -1.07 (bottom quartile). Alpha: 0.00 (lower mid). Alpha: -5.87 (bottom quartile). Alpha: 4.99 (upper mid). Alpha: 5.38 (top quartile). Point 9 Sharpe: 1.01 (top quartile). Sharpe: 0.59 (upper mid). Sharpe: -0.52 (bottom quartile). Sharpe: 0.15 (bottom quartile). Sharpe: 0.15 (lower mid). Point 10 Information ratio: -0.53 (bottom quartile). Information ratio: 0.00 (bottom quartile). Information ratio: 0.47 (lower mid). Information ratio: 0.65 (upper mid). Information ratio: 0.79 (top quartile). IDBI Diversified Equity Fund
Aditya Birla Sun Life Manufacturing Equity Fund
Motilal Oswal Multicap 35 Fund
Mahindra Badhat Yojana
ICICI Prudential Multicap Fund
SIP நீண்ட காலத்திற்கான சிறந்த துறை நிதிகள்
துறை நிதி குறிப்பிட்ட துறைகளின் பத்திரங்களில் முதலீடு செய்கிறதுபொருளாதாரம், தொலைத்தொடர்பு, வங்கி, FMCG, தகவல் தொழில்நுட்பம் (IT), மருந்து மற்றும் உள்கட்டமைப்பு போன்றவை. உதாரணமாக, ஒரு பார்மா நிதியானது மருந்து நிறுவனங்களின் பங்குகளில் மட்டுமே முதலீடு செய்ய முடியும் மற்றும் வங்கித் துறை நிதி வங்கிகளில் முதலீடு செய்யலாம். ஒரு துறை சார்ந்த ஃபண்டு என்பதால், அத்தகைய ஃபண்டுகளில் ரிஸ்க் அதிகம். எனவே, ஒரு முதலீட்டாளர் ஃபண்டில் முதலீடு செய்வதற்கு முன் குறிப்பிட்ட துறையைப் பற்றிய ஆழமான அறிவைப் பெற்றிருக்க வேண்டும்.
Fund NAV Net Assets (Cr) Min SIP Investment 3 MO (%) 6 MO (%) 1 YR (%) 3 YR (%) 5 YR (%) 2025 (%) DSP Natural Resources and New Energy Fund Growth ₹105.831
↓ -0.15 ₹2,457 500 -1.9 4.9 18.3 19.8 15.6 17.5 Aditya Birla Sun Life Banking And Financial Services Fund Growth ₹63.72
↓ -0.86 ₹3,466 1,000 6.3 0.5 4.4 12.4 11.8 17.5 Franklin Build India Fund Growth ₹145.774
↓ -1.34 ₹3,160 500 2.8 5.3 2.9 21.2 20.1 3.7 ICICI Prudential Banking and Financial Services Fund Growth ₹133.22
↓ -1.34 ₹10,643 100 5.1 -2.9 -0.6 11.1 10.1 15.9 Bandhan Infrastructure Fund Growth ₹50.155
↓ -0.29 ₹1,495 100 9.5 8.2 -1.6 19.2 17.6 -6.9 Note: Returns up to 1 year are on absolute basis & more than 1 year are on CAGR basis. as on 13 Jul 26 Research Highlights & Commentary of 5 Funds showcased
Commentary DSP Natural Resources and New Energy Fund Aditya Birla Sun Life Banking And Financial Services Fund Franklin Build India Fund ICICI Prudential Banking and Financial Services Fund Bandhan Infrastructure Fund Point 1 Bottom quartile AUM (₹2,457 Cr). Upper mid AUM (₹3,466 Cr). Lower mid AUM (₹3,160 Cr). Highest AUM (₹10,643 Cr). Bottom quartile AUM (₹1,495 Cr). Point 2 Oldest track record among peers (18 yrs). Established history (12+ yrs). Established history (16+ yrs). Established history (17+ yrs). Established history (15+ yrs). Point 3 Top rated. Rating: 5★ (upper mid). Rating: 5★ (lower mid). Rating: 5★ (bottom quartile). Rating: 5★ (bottom quartile). Point 4 Risk profile: High. Risk profile: High. Risk profile: High. Risk profile: High. Risk profile: High. Point 5 5Y return: 15.59% (lower mid). 5Y return: 11.81% (bottom quartile). 5Y return: 20.11% (top quartile). 5Y return: 10.14% (bottom quartile). 5Y return: 17.56% (upper mid). Point 6 3Y return: 19.83% (upper mid). 3Y return: 12.40% (bottom quartile). 3Y return: 21.19% (top quartile). 3Y return: 11.08% (bottom quartile). 3Y return: 19.23% (lower mid). Point 7 1Y return: 18.31% (top quartile). 1Y return: 4.43% (upper mid). 1Y return: 2.89% (lower mid). 1Y return: -0.63% (bottom quartile). 1Y return: -1.57% (bottom quartile). Point 8 Alpha: 0.00 (upper mid). Alpha: 3.78 (top quartile). Alpha: 0.00 (lower mid). Alpha: -2.48 (bottom quartile). Alpha: 0.00 (bottom quartile). Point 9 Sharpe: 1.33 (top quartile). Sharpe: -0.15 (lower mid). Sharpe: 0.01 (upper mid). Sharpe: -0.46 (bottom quartile). Sharpe: -0.26 (bottom quartile). Point 10 Information ratio: 0.00 (lower mid). Information ratio: 0.28 (top quartile). Information ratio: 0.00 (bottom quartile). Information ratio: 0.01 (upper mid). Information ratio: 0.00 (bottom quartile). DSP Natural Resources and New Energy Fund
Aditya Birla Sun Life Banking And Financial Services Fund
Franklin Build India Fund
ICICI Prudential Banking and Financial Services Fund
Bandhan Infrastructure Fund
இங்கு வழங்கப்பட்ட தகவல்கள் துல்லியமானவை என்பதை உறுதிப்படுத்த அனைத்து முயற்சிகளும் மேற்கொள்ளப்பட்டுள்ளன. இருப்பினும், தரவின் சரியான தன்மை குறித்து எந்த உத்தரவாதமும் அளிக்கப்படவில்லை. முதலீடு செய்வதற்கு முன் திட்டத் தகவல் ஆவணத்துடன் சரிபார்க்கவும்.
You Might Also Like


AMFI Registration No. 112358 | CIN: U74999MH2016PTC282153
Shepard Technologies Pvt. Ltd. (with ARN code 112358) makes no warranties or representations, express or implied, on products offered through the platform. It accepts no liability for any damages or losses, however caused, in connection with the use of, or on the reliance of its product or related services. Terms and conditions of the website are applicable.
©2026 Shepard Technologies Private Limited. All Rights Reserved
Very good for young generation.