SIP or Systematic Investment plan is an investment mode in Mutual Funds wherein; people invest small amounts at regular intervals. SIP is also referred to as a goal-based investment that helps people to attain their objectives within the set timeframe. With the advents in technology, people can opt for Net Banking channel to invest in SIP. In this process, people need to Add Biller in their Bank accounts so that the process of SIP payments gets automated.
The process of adding billers for SIP transaction is different for each bank. However, one thing that remains common is addition or URN or Unique Registration Number that you need in your bank account so that the SIP Deduction process gets automated. Individuals receive the URN once they make their first transaction. So, let us look at the steps of how to add biller for SIP transaction in State Bank of India or SBI.
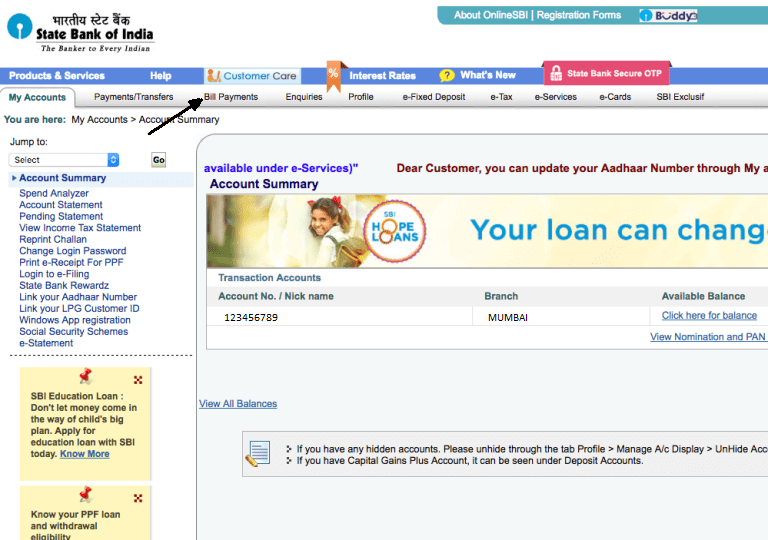
The primary procedure for adding always starts with logging into your bank account. Yes, you first need to log in to your account using your credentials. Once you log in, on your home screen, you need to select the Bill Payments tab which is on top. The image for this step is given below where the Bill Payments tab is pointed with a Black Arrow.
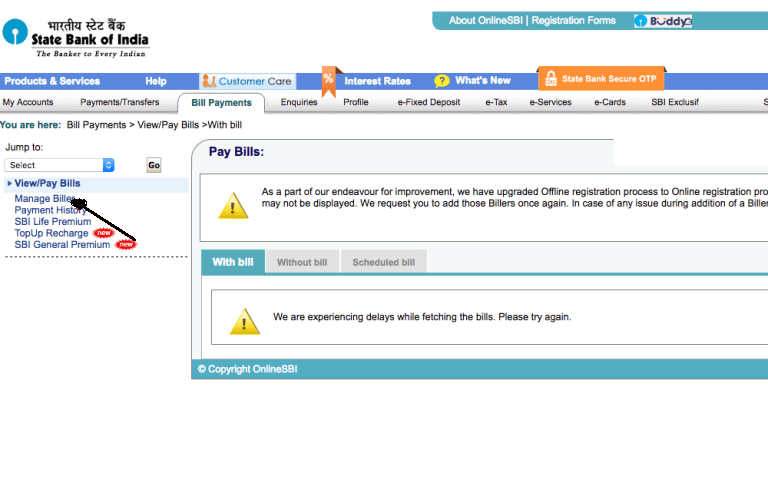
Once you click on Bill Payments tab, a new screen gets redirected. In this screen, on the left side, there is an option called as View/Pay Bills. Under this tab, the first option is Manage Biller which needs to be selected. The image for this step is given below where the Manage Biller option is highlighted with a Black Arrow.
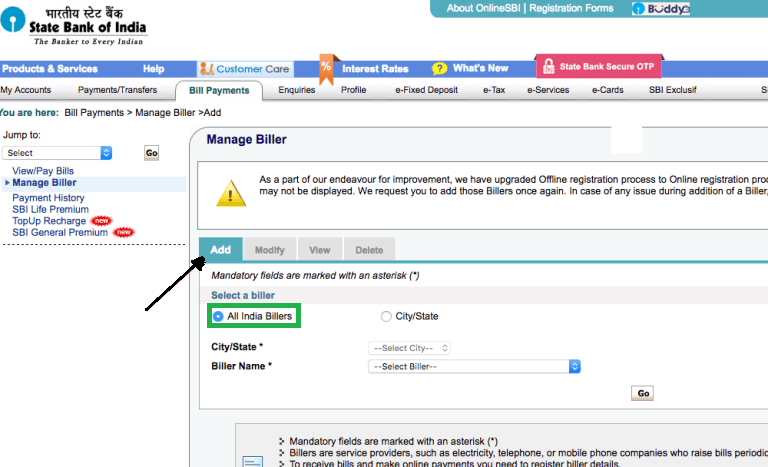
Once you click on Manage Biller option; a new screen opens where you can see tabs such as Add, Modify, View, and Delete. Out of these, you need to click on Add Button. Also, ensure that you select All India Billers option. The image for this step is given below where Add tab is pointed with a Black Arrow and All India Billers option is highlighted in Green.
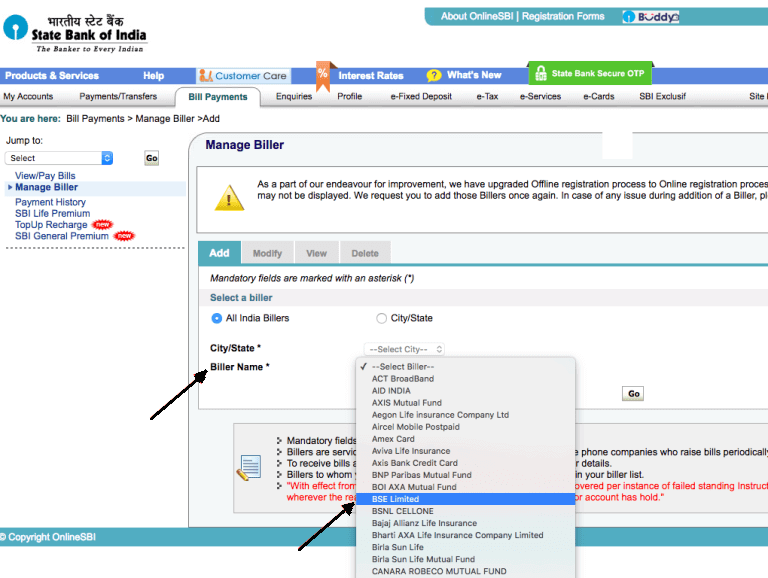
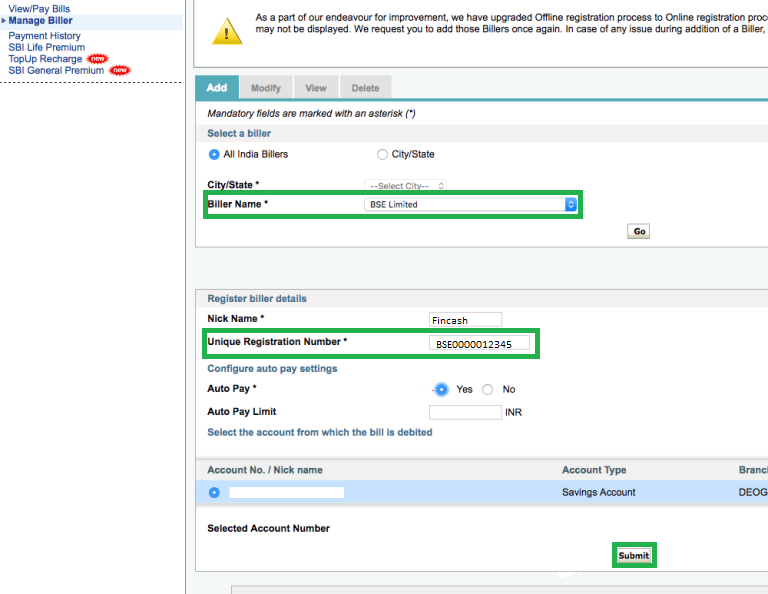
This is the fourth step in the biller addition process of SBI. Once you click on Add tab and select All India Billers; you need to click on drop-down next to Biller Name and select BSE Limited. The image for this step is given below where both Biller Name and BSE Limited both are pointed with a Black Arrow.
This is the last step in the process. Once you click on BSE Limited and click on Go, a new screen opens up wherein; you need to add the biller details. The most important element to be added here is your Unique Registration Number or URN. You will receive this URN in your email or else; you can even access it from the My SIPs Section of www.fincash.com website. Along with the same, you also need to select certain details such as Auto Pay, Auto Pay Limit, Account Number to be used for Payment and so on. Here, you have to select Yes against Auto Pay option. Once you enter all the details you need to click on Submit Option and the Biller gets added automatically. The image representing this step is given below where Biller Name, Unique Registration Number and Submit options are highlighted in Green.
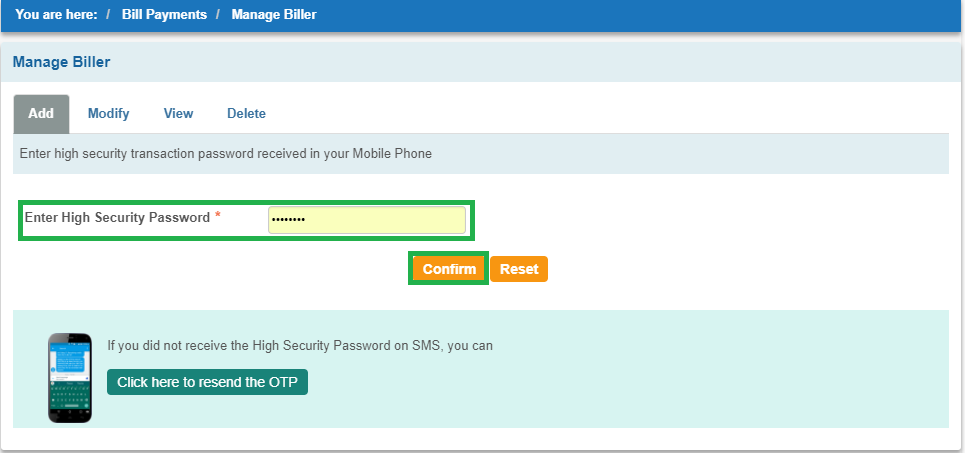
Once you click on Submit in the previous step, then the you will be redirected to a new screen in which you need to enter your High Security Password. This High Security Password number is received by the individuals on their registered mobile number. Once you enter this number then, you need to click on Confirm. The image for this step is given below where the High Security Password box and Confirm button are highlighted in Green.
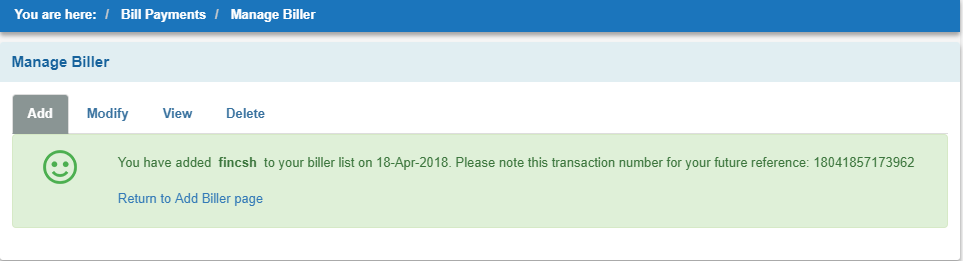
This is the final step wherein; you receive the confirmation that your biller is successfully added for SIP transaction in State Bank of India. The image for this step is given below.
Thus, from the above steps, it can be said that the process of biller addition, in State Bank of India is easy.
Here are some of the recommend SIPs as per 5 year
returns and AUM of more than INR 500 Cr
:
Fund NAV Net Assets (Cr) Min SIP Investment 3 MO (%) 6 MO (%) 1 YR (%) 3 YR (%) 5 YR (%) 2024 (%) ICICI Prudential Infrastructure Fund Growth ₹194.26
↑ 0.22 ₹7,941 100 1.2 16.3 0.9 29.1 33.9 27.4 Motilal Oswal Midcap 30 Fund Growth ₹104.72
↑ 0.29 ₹33,609 500 6.2 14.7 3.8 29.1 33 57.1 Nippon India Small Cap Fund Growth ₹168.884
↑ 0.11 ₹65,922 100 3 16.9 -5.7 24.2 32 26.1 Franklin Build India Fund Growth ₹141.652
↑ 0.18 ₹2,950 500 2.4 16.8 -2.3 28.2 31.8 27.8 DSP India T.I.G.E.R Fund Growth ₹313.777
↓ -0.01 ₹5,406 500 2.8 17 -7.7 27 31.5 32.4 Note: Returns up to 1 year are on absolute basis & more than 1 year are on CAGR basis. as on 25 Aug 25 Research Highlights & Commentary of 5 Funds showcased
Commentary ICICI Prudential Infrastructure Fund Motilal Oswal Midcap 30 Fund Nippon India Small Cap Fund Franklin Build India Fund DSP India T.I.G.E.R Fund Point 1 Lower mid AUM (₹7,941 Cr). Upper mid AUM (₹33,609 Cr). Highest AUM (₹65,922 Cr). Bottom quartile AUM (₹2,950 Cr). Bottom quartile AUM (₹5,406 Cr). Point 2 Established history (20+ yrs). Established history (11+ yrs). Established history (14+ yrs). Established history (15+ yrs). Oldest track record among peers (21 yrs). Point 3 Rating: 3★ (bottom quartile). Rating: 3★ (bottom quartile). Rating: 4★ (upper mid). Top rated. Rating: 4★ (lower mid). Point 4 Risk profile: High. Risk profile: Moderately High. Risk profile: Moderately High. Risk profile: High. Risk profile: High. Point 5 5Y return: 33.87% (top quartile). 5Y return: 33.01% (upper mid). 5Y return: 31.95% (lower mid). 5Y return: 31.76% (bottom quartile). 5Y return: 31.54% (bottom quartile). Point 6 3Y return: 29.13% (top quartile). 3Y return: 29.07% (upper mid). 3Y return: 24.25% (bottom quartile). 3Y return: 28.22% (lower mid). 3Y return: 26.99% (bottom quartile). Point 7 1Y return: 0.91% (upper mid). 1Y return: 3.78% (top quartile). 1Y return: -5.73% (bottom quartile). 1Y return: -2.27% (lower mid). 1Y return: -7.66% (bottom quartile). Point 8 Alpha: 0.00 (upper mid). Alpha: 3.70 (top quartile). Alpha: -3.84 (bottom quartile). Alpha: 0.00 (lower mid). Alpha: 0.00 (bottom quartile). Point 9 Sharpe: -0.42 (upper mid). Sharpe: -0.11 (top quartile). Sharpe: -0.51 (bottom quartile). Sharpe: -0.51 (lower mid). Sharpe: -0.65 (bottom quartile). Point 10 Information ratio: 0.00 (upper mid). Information ratio: 0.44 (top quartile). Information ratio: 0.00 (lower mid). Information ratio: 0.00 (bottom quartile). Information ratio: 0.00 (bottom quartile). ICICI Prudential Infrastructure Fund
Motilal Oswal Midcap 30 Fund
Nippon India Small Cap Fund
Franklin Build India Fund
DSP India T.I.G.E.R Fund
To generate capital appreciation and income distribution to unit holders by investing predominantly in equity/equity related securities of the companies belonging to the infrastructure development and balance in debt securities and money market instruments. Research Highlights for ICICI Prudential Infrastructure Fund Below is the key information for ICICI Prudential Infrastructure Fund Returns up to 1 year are on (Erstwhile Motilal Oswal MOSt Focused Midcap 30 Fund) The investment objective of the Scheme is to achieve long term capital appreciation by investing in a maximum of 30 quality mid-cap companies having long-term competitive advantages and potential for growth. However, there can be no assurance or guarantee that the investment objective of the Scheme would be achieved. Research Highlights for Motilal Oswal Midcap 30 Fund Below is the key information for Motilal Oswal Midcap 30 Fund Returns up to 1 year are on The primary investment objective of the scheme is to generate long term capital appreciation by investing predominantly in equity and equity related instruments of small cap companies and the secondary objective is to generate consistent returns by investing in debt and money market securities. Research Highlights for Nippon India Small Cap Fund Below is the key information for Nippon India Small Cap Fund Returns up to 1 year are on The Scheme seeks to achieve capital appreciation by investing in companies engaged directly or indirectly in infrastructure related activities. Research Highlights for Franklin Build India Fund Below is the key information for Franklin Build India Fund Returns up to 1 year are on To generate capital appreciation, from a portfolio that is substantially constituted of equity securities and equity related securities of corporates, which could benefit from structural changes brought about by continuing liberalization in economic policies by the government and/or continuing investments in infrastructure, both by the public and private sector. Research Highlights for DSP India T.I.G.E.R Fund Below is the key information for DSP India T.I.G.E.R Fund Returns up to 1 year are on 1. ICICI Prudential Infrastructure Fund
ICICI Prudential Infrastructure Fund
Growth Launch Date 31 Aug 05 NAV (25 Aug 25) ₹194.26 ↑ 0.22 (0.11 %) Net Assets (Cr) ₹7,941 on 31 Jul 25 Category Equity - Sectoral AMC ICICI Prudential Asset Management Company Limited Rating ☆☆☆ Risk High Expense Ratio 1.89 Sharpe Ratio -0.42 Information Ratio 0 Alpha Ratio 0 Min Investment 5,000 Min SIP Investment 100 Exit Load 0-1 Years (1%),1 Years and above(NIL) Growth of 10,000 investment over the years.
Date Value 31 Jul 20 ₹10,000 31 Jul 21 ₹17,880 31 Jul 22 ₹21,387 31 Jul 23 ₹30,280 31 Jul 24 ₹49,231 31 Jul 25 ₹48,059 Returns for ICICI Prudential Infrastructure Fund
absolute basis
& more than 1 year are on CAGR (Compound Annual Growth Rate)
basis. as on 25 Aug 25 Duration Returns 1 Month -0.6% 3 Month 1.2% 6 Month 16.3% 1 Year 0.9% 3 Year 29.1% 5 Year 33.9% 10 Year 15 Year Since launch 16% Historical performance (Yearly) on absolute basis
Year Returns 2024 27.4% 2023 44.6% 2022 28.8% 2021 50.1% 2020 3.6% 2019 2.6% 2018 -14% 2017 40.8% 2016 2% 2015 -3.4% Fund Manager information for ICICI Prudential Infrastructure Fund
Name Since Tenure Ihab Dalwai 3 Jun 17 8.17 Yr. Sharmila D’mello 30 Jun 22 3.09 Yr. Data below for ICICI Prudential Infrastructure Fund as on 31 Jul 25
Equity Sector Allocation
Sector Value Industrials 38.68% Basic Materials 16.98% Financial Services 16.27% Utility 9.82% Energy 7.24% Real Estate 2.75% Consumer Cyclical 1.63% Communication Services 1.14% Asset Allocation
Asset Class Value Cash 5.5% Equity 94.5% Top Securities Holdings / Portfolio
Name Holding Value Quantity Larsen & Toubro Ltd (Industrials)
Equity, Since 30 Nov 09 | LT9% ₹727 Cr 1,980,204
↓ -150,000 NTPC Ltd (Utilities)
Equity, Since 29 Feb 16 | 5325554% ₹358 Cr 10,679,473
↑ 3,079,473 Adani Ports & Special Economic Zone Ltd (Industrials)
Equity, Since 31 May 24 | ADANIPORTS4% ₹329 Cr 2,268,659
↓ -200,000 Reliance Industries Ltd (Energy)
Equity, Since 31 Jul 23 | RELIANCE4% ₹290 Cr 1,929,725
↑ 266,998 NCC Ltd (Industrials)
Equity, Since 31 Aug 21 | NCC4% ₹289 Cr 12,522,005 Vedanta Ltd (Basic Materials)
Equity, Since 31 Jul 24 | 5002954% ₹284 Cr 6,158,750
↑ 935,088 JM Financial Ltd (Financial Services)
Equity, Since 31 Oct 21 | JMFINANCIL3% ₹247 Cr 15,506,510
↓ -2,256,731 Axis Bank Ltd (Financial Services)
Equity, Since 31 Dec 20 | 5322153% ₹227 Cr 1,896,057
↑ 400,000 Kalpataru Projects International Ltd (Industrials)
Equity, Since 30 Sep 06 | KPIL3% ₹221 Cr 1,803,566
↓ -100,000 AIA Engineering Ltd (Industrials)
Equity, Since 28 Feb 21 | AIAENG3% ₹219 Cr 660,770
↑ 120,000 2. Motilal Oswal Midcap 30 Fund
Motilal Oswal Midcap 30 Fund
Growth Launch Date 24 Feb 14 NAV (25 Aug 25) ₹104.72 ↑ 0.29 (0.27 %) Net Assets (Cr) ₹33,609 on 31 Jul 25 Category Equity - Mid Cap AMC Motilal Oswal Asset Management Co. Ltd Rating ☆☆☆ Risk Moderately High Expense Ratio 1.56 Sharpe Ratio -0.11 Information Ratio 0.44 Alpha Ratio 3.7 Min Investment 5,000 Min SIP Investment 500 Exit Load 0-1 Years (1%),1 Years and above(NIL) Growth of 10,000 investment over the years.
Date Value 31 Jul 20 ₹10,000 31 Jul 21 ₹16,540 31 Jul 22 ₹20,655 31 Jul 23 ₹26,047 31 Jul 24 ₹44,147 31 Jul 25 ₹44,850 Returns for Motilal Oswal Midcap 30 Fund
absolute basis
& more than 1 year are on CAGR (Compound Annual Growth Rate)
basis. as on 25 Aug 25 Duration Returns 1 Month 3.5% 3 Month 6.2% 6 Month 14.7% 1 Year 3.8% 3 Year 29.1% 5 Year 33% 10 Year 15 Year Since launch 22.7% Historical performance (Yearly) on absolute basis
Year Returns 2024 57.1% 2023 41.7% 2022 10.7% 2021 55.8% 2020 9.3% 2019 9.7% 2018 -12.7% 2017 30.8% 2016 5.2% 2015 16.5% Fund Manager information for Motilal Oswal Midcap 30 Fund
Name Since Tenure Ajay Khandelwal 1 Oct 24 0.83 Yr. Niket Shah 1 Jul 20 5.09 Yr. Rakesh Shetty 22 Nov 22 2.69 Yr. Sunil Sawant 1 Jul 24 1.08 Yr. Data below for Motilal Oswal Midcap 30 Fund as on 31 Jul 25
Equity Sector Allocation
Sector Value Technology 33.7% Industrials 18.11% Consumer Cyclical 17.65% Health Care 4.49% Communication Services 3.99% Real Estate 2.83% Financial Services 2.61% Asset Allocation
Asset Class Value Cash 17.17% Equity 82.83% Top Securities Holdings / Portfolio
Name Holding Value Quantity Coforge Ltd (Technology)
Equity, Since 31 Mar 23 | COFORGE10% ₹3,464 Cr 18,000,000 Persistent Systems Ltd (Technology)
Equity, Since 31 Jan 23 | PERSISTENT10% ₹3,172 Cr 5,250,000 Trent Ltd (Consumer Cyclical)
Equity, Since 30 Nov 24 | 5002519% ₹3,104 Cr 4,992,139
↑ 2,848,945 Dixon Technologies (India) Ltd (Technology)
Equity, Since 31 Mar 23 | DIXON9% ₹2,997 Cr 1,999,999
↑ 1,164,799 Kalyan Jewellers India Ltd (Consumer Cyclical)
Equity, Since 29 Feb 24 | KALYANKJIL8% ₹2,501 Cr 45,000,000
↑ 1,509,750 Polycab India Ltd (Industrials)
Equity, Since 30 Sep 23 | POLYCAB5% ₹1,671 Cr 2,550,000
↑ 50,000 KEI Industries Ltd (Industrials)
Equity, Since 30 Nov 24 | KEI4% ₹1,327 Cr 3,500,000
↑ 750,000 Bharti Hexacom Ltd (Communication Services)
Equity, Since 31 Oct 24 | BHARTIHEXA4% ₹1,318 Cr 6,750,000 Max Healthcare Institute Ltd Ordinary Shares (Healthcare)
Equity, Since 31 Mar 24 | MAXHEALTH4% ₹1,272 Cr 9,969,361 Kaynes Technology India Ltd (Industrials)
Equity, Since 30 Jun 25 | KAYNES3% ₹975 Cr 1,599,306
↑ 1,599,306 3. Nippon India Small Cap Fund
Nippon India Small Cap Fund
Growth Launch Date 16 Sep 10 NAV (25 Aug 25) ₹168.884 ↑ 0.11 (0.06 %) Net Assets (Cr) ₹65,922 on 31 Jul 25 Category Equity - Small Cap AMC Nippon Life Asset Management Ltd. Rating ☆☆☆☆ Risk Moderately High Expense Ratio 1.44 Sharpe Ratio -0.51 Information Ratio 0 Alpha Ratio -3.84 Min Investment 5,000 Min SIP Investment 100 Exit Load 0-1 Years (1%),1 Years and above(NIL) Growth of 10,000 investment over the years.
Date Value 31 Jul 20 ₹10,000 31 Jul 21 ₹21,333 31 Jul 22 ₹23,526 31 Jul 23 ₹31,952 31 Jul 24 ₹49,722 31 Jul 25 ₹46,790 Returns for Nippon India Small Cap Fund
absolute basis
& more than 1 year are on CAGR (Compound Annual Growth Rate)
basis. as on 25 Aug 25 Duration Returns 1 Month -0.9% 3 Month 3% 6 Month 16.9% 1 Year -5.7% 3 Year 24.2% 5 Year 32% 10 Year 15 Year Since launch 20.8% Historical performance (Yearly) on absolute basis
Year Returns 2024 26.1% 2023 48.9% 2022 6.5% 2021 74.3% 2020 29.2% 2019 -2.5% 2018 -16.7% 2017 63% 2016 5.6% 2015 15.1% Fund Manager information for Nippon India Small Cap Fund
Name Since Tenure Samir Rachh 2 Jan 17 8.58 Yr. Kinjal Desai 25 May 18 7.19 Yr. Data below for Nippon India Small Cap Fund as on 31 Jul 25
Equity Sector Allocation
Sector Value Industrials 23.43% Financial Services 14.84% Consumer Cyclical 14.65% Basic Materials 12.82% Health Care 8.57% Consumer Defensive 8.11% Technology 7.37% Utility 2.24% Energy 1.77% Communication Services 1.45% Real Estate 0.69% Asset Allocation
Asset Class Value Cash 4.05% Equity 95.95% Top Securities Holdings / Portfolio
Name Holding Value Quantity Multi Commodity Exchange of India Ltd (Financial Services)
Equity, Since 28 Feb 21 | MCX2% ₹1,656 Cr 1,851,010 HDFC Bank Ltd (Financial Services)
Equity, Since 30 Apr 22 | HDFCBANK2% ₹1,331 Cr 6,650,000 Kirloskar Brothers Ltd (Industrials)
Equity, Since 31 Oct 12 | KIRLOSBROS2% ₹1,054 Cr 4,472,130 Karur Vysya Bank Ltd (Financial Services)
Equity, Since 28 Feb 17 | 5900031% ₹850 Cr 31,784,062 ELANTAS Beck India Ltd (Basic Materials)
Equity, Since 28 Feb 13 | 5001231% ₹827 Cr 651,246
↑ 36,498 Apar Industries Ltd (Industrials)
Equity, Since 31 Mar 17 | APARINDS1% ₹784 Cr 899,271 Tube Investments of India Ltd Ordinary Shares (Industrials)
Equity, Since 30 Apr 18 | TIINDIA1% ₹777 Cr 2,499,222 State Bank of India (Financial Services)
Equity, Since 31 Oct 19 | SBIN1% ₹747 Cr 9,100,000 Bharat Heavy Electricals Ltd (Industrials)
Equity, Since 30 Sep 22 | 5001031% ₹732 Cr 27,500,000 Pfizer Ltd (Healthcare)
Equity, Since 28 Feb 22 | PFIZER1% ₹685 Cr 1,206,103 4. Franklin Build India Fund
Franklin Build India Fund
Growth Launch Date 4 Sep 09 NAV (25 Aug 25) ₹141.652 ↑ 0.18 (0.13 %) Net Assets (Cr) ₹2,950 on 31 Jul 25 Category Equity - Sectoral AMC Franklin Templeton Asst Mgmt(IND)Pvt Ltd Rating ☆☆☆☆☆ Risk High Expense Ratio 2.01 Sharpe Ratio -0.51 Information Ratio 0 Alpha Ratio 0 Min Investment 5,000 Min SIP Investment 500 Exit Load 0-1 Years (1%),1 Years and above(NIL) Growth of 10,000 investment over the years.
Date Value 31 Jul 20 ₹10,000 31 Jul 21 ₹17,587 31 Jul 22 ₹19,236 31 Jul 23 ₹26,244 31 Jul 24 ₹44,020 31 Jul 25 ₹42,375 Returns for Franklin Build India Fund
absolute basis
& more than 1 year are on CAGR (Compound Annual Growth Rate)
basis. as on 25 Aug 25 Duration Returns 1 Month 0.5% 3 Month 2.4% 6 Month 16.8% 1 Year -2.3% 3 Year 28.2% 5 Year 31.8% 10 Year 15 Year Since launch 18.1% Historical performance (Yearly) on absolute basis
Year Returns 2024 27.8% 2023 51.1% 2022 11.2% 2021 45.9% 2020 5.4% 2019 6% 2018 -10.7% 2017 43.3% 2016 8.4% 2015 2.1% Fund Manager information for Franklin Build India Fund
Name Since Tenure Ajay Argal 18 Oct 21 3.79 Yr. Kiran Sebastian 7 Feb 22 3.48 Yr. Sandeep Manam 18 Oct 21 3.79 Yr. Data below for Franklin Build India Fund as on 31 Jul 25
Equity Sector Allocation
Sector Value Industrials 36.15% Energy 12.74% Utility 12.5% Financial Services 11.47% Communication Services 8.4% Basic Materials 6.9% Real Estate 3.07% Consumer Cyclical 2.66% Technology 1.91% Asset Allocation
Asset Class Value Cash 4.19% Equity 95.81% Top Securities Holdings / Portfolio
Name Holding Value Quantity Larsen & Toubro Ltd (Industrials)
Equity, Since 29 Feb 20 | LT8% ₹244 Cr 665,000 Reliance Industries Ltd (Energy)
Equity, Since 31 Oct 21 | RELIANCE6% ₹180 Cr 1,200,000 InterGlobe Aviation Ltd (Industrials)
Equity, Since 29 Feb 20 | INDIGO6% ₹179 Cr 300,000 ICICI Bank Ltd (Financial Services)
Equity, Since 31 Mar 12 | 5321746% ₹173 Cr 1,200,000 Oil & Natural Gas Corp Ltd (Energy)
Equity, Since 30 Jun 19 | 5003125% ₹147 Cr 6,000,000 Bharti Airtel Ltd (Communication Services)
Equity, Since 30 Sep 09 | BHARTIARTL5% ₹143 Cr 710,000 NTPC Ltd (Utilities)
Equity, Since 30 Nov 16 | 5325555% ₹138 Cr 4,125,000 Axis Bank Ltd (Financial Services)
Equity, Since 31 Mar 12 | 5322154% ₹120 Cr 1,000,000 Power Grid Corp Of India Ltd (Utilities)
Equity, Since 28 Feb 21 | 5328984% ₹108 Cr 3,600,000 Tata Power Co Ltd (Utilities)
Equity, Since 31 Jan 25 | 5004003% ₹81 Cr 2,000,000 5. DSP India T.I.G.E.R Fund
DSP India T.I.G.E.R Fund
Growth Launch Date 11 Jun 04 NAV (25 Aug 25) ₹313.777 ↓ -0.01 (0.00 %) Net Assets (Cr) ₹5,406 on 31 Jul 25 Category Equity - Sectoral AMC DSP BlackRock Invmt Managers Pvt. Ltd. Rating ☆☆☆☆ Risk High Expense Ratio 1.89 Sharpe Ratio -0.65 Information Ratio 0 Alpha Ratio 0 Min Investment 1,000 Min SIP Investment 500 Exit Load 0-12 Months (1%),12 Months and above(NIL) Growth of 10,000 investment over the years.
Date Value 31 Jul 20 ₹10,000 31 Jul 21 ₹18,502 31 Jul 22 ₹20,142 31 Jul 23 ₹27,621 31 Jul 24 ₹47,125 31 Jul 25 ₹42,767 Returns for DSP India T.I.G.E.R Fund
absolute basis
& more than 1 year are on CAGR (Compound Annual Growth Rate)
basis. as on 25 Aug 25 Duration Returns 1 Month 0.5% 3 Month 2.8% 6 Month 17% 1 Year -7.7% 3 Year 27% 5 Year 31.5% 10 Year 15 Year Since launch 17.6% Historical performance (Yearly) on absolute basis
Year Returns 2024 32.4% 2023 49% 2022 13.9% 2021 51.6% 2020 2.7% 2019 6.7% 2018 -17.2% 2017 47% 2016 4.1% 2015 0.7% Fund Manager information for DSP India T.I.G.E.R Fund
Name Since Tenure Rohit Singhania 21 Jun 10 15.12 Yr. Data below for DSP India T.I.G.E.R Fund as on 31 Jul 25
Equity Sector Allocation
Sector Value Industrials 28.5% Basic Materials 15.17% Utility 10.47% Financial Services 10.42% Consumer Cyclical 8.59% Health Care 6.63% Energy 5.45% Communication Services 2.61% Technology 2.16% Real Estate 1.62% Consumer Defensive 1.27% Asset Allocation
Asset Class Value Cash 7.11% Equity 92.89% Top Securities Holdings / Portfolio
Name Holding Value Quantity Larsen & Toubro Ltd (Industrials)
Equity, Since 30 Jun 04 | LT5% ₹256 Cr 697,669 NTPC Ltd (Utilities)
Equity, Since 30 Nov 17 | 5325554% ₹239 Cr 7,145,883 Apollo Hospitals Enterprise Ltd (Healthcare)
Equity, Since 31 Dec 24 | APOLLOHOSP3% ₹178 Cr 245,928 Power Grid Corp Of India Ltd (Utilities)
Equity, Since 31 Jan 25 | 5328983% ₹167 Cr 5,567,574 Multi Commodity Exchange of India Ltd (Financial Services)
Equity, Since 31 May 25 | MCX3% ₹147 Cr 164,204 Rainbow Childrens Medicare Ltd (Healthcare)
Equity, Since 31 Jan 25 | 5435243% ₹146 Cr 935,870 Amber Enterprises India Ltd Ordinary Shares (Consumer Cyclical)
Equity, Since 31 Dec 24 | AMBER3% ₹140 Cr 207,277 Bharti Airtel Ltd (Communication Services)
Equity, Since 31 Oct 18 | BHARTIARTL3% ₹138 Cr 688,435 Kirloskar Oil Engines Ltd (Industrials)
Equity, Since 31 Mar 23 | KIRLOSENG2% ₹137 Cr 1,608,534 Solar Industries India Ltd (Basic Materials)
Equity, Since 31 Mar 14 | SOLARINDS2% ₹132 Cr 75,291
In case of any further queries, you can contact us on 8451864111 on any working day between 9.30am to 6.30 pm or write a mail to us anytime at support@fincash.com or chat with us by logging onto our website www.fincash.com.
Great quarries good