ಭಾರತದಲ್ಲಿ 2022 ರಲ್ಲಿ ಉತ್ತಮವಾಗಿ ಕಾರ್ಯನಿರ್ವಹಿಸುತ್ತಿರುವ SIP ಯೋಜನೆಗಳು
ಅತ್ಯುತ್ತಮSIP ಯೋಜನೆಗಳು? ಅವರನ್ನು ಆಯ್ಕೆ ಮಾಡುವುದು ಹೇಗೆ? ಯೋಚಿಸುವಾಗ ಹೂಡಿಕೆದಾರರ ಮನಸ್ಸಿನಲ್ಲಿ ಉಂಟಾಗುವ ಕೆಲವು ಸಾಮಾನ್ಯ ಪ್ರಶ್ನೆಗಳು ಇವುಹೂಡಿಕೆ ಒಳಗೆಮ್ಯೂಚುಯಲ್ ಫಂಡ್ಗಳು SIP ಅಥವಾ ವ್ಯವಸ್ಥಿತ ಮೂಲಕಹೂಡಿಕೆ ಯೋಜನೆ.
SIP ಹೂಡಿಕೆ ಮ್ಯೂಚುವಲ್ ಫಂಡ್ಗಳಲ್ಲಿ ಹೂಡಿಕೆ ಮಾಡುವಾಗ ಅತ್ಯಂತ ಶಿಸ್ತುಬದ್ಧ ಹೂಡಿಕೆಯ ಆಯ್ಕೆಗಳಲ್ಲಿ ಒಂದಾಗಿದೆ. ಇದಲ್ಲದೆ, SIP ಮ್ಯೂಚುಯಲ್ ಫಂಡ್ನಲ್ಲಿ ಹೂಡಿಕೆಯ ಕನಿಷ್ಠ ಮೊತ್ತವು INR 500 ಕ್ಕಿಂತ ಕಡಿಮೆಯಿರುತ್ತದೆ. ಇದು ಹೂಡಿಕೆಯನ್ನು ಮಾಡುತ್ತದೆಉನ್ನತ SIP ಹೆಚ್ಚು ಅನುಕೂಲಕರ ಯೋಜನೆಗಳು.
ಸಾಮಾನ್ಯವಾಗಿ, ಭಾರತದಲ್ಲಿನ ಕೆಲವು ಅತ್ಯುತ್ತಮ SIP ಯೋಜನೆಗಳು ದೀರ್ಘಾವಧಿಯವರೆಗೆ ಹೂಡಿಕೆ ಮಾಡಿದಾಗ ಉತ್ತಮ ಆದಾಯವನ್ನು ನೀಡುತ್ತವೆ. SIP ಅಥವಾ ವ್ಯವಸ್ಥಿತ ಹೂಡಿಕೆ ಯೋಜನೆಯನ್ನು ಹೂಡಿಕೆ ಮಾಡುವ ಮೂಲಕ ಒಬ್ಬರು ಎಷ್ಟು ಗಳಿಸಬಹುದು ಎಂಬುದನ್ನು ತಿಳಿಯಲು, ಪರಿಶೀಲಿಸಿಸಿಪ್ ಕ್ಯಾಲ್ಕುಲೇಟರ್ (SIP ರಿಟರ್ನ್ ಕ್ಯಾಲ್ಕುಲೇಟರ್ ಎಂದೂ ಕರೆಯಲಾಗುತ್ತದೆ) ಕೆಳಗಿನ ವಿಭಾಗ.
ವ್ಯವಸ್ಥಿತ ಹೂಡಿಕೆ ಯೋಜನೆಯಲ್ಲಿ ಏಕೆ ಹೂಡಿಕೆ ಮಾಡಬೇಕು?
ವ್ಯವಸ್ಥಿತ ಹೂಡಿಕೆ ಯೋಜನೆಯು ಬಹು ಪ್ರಯೋಜನಗಳೊಂದಿಗೆ ಬರುತ್ತದೆ. ಇದರ ಕನಿಷ್ಠ ಹೂಡಿಕೆ ಮೊತ್ತINR 500 ಹೆಚ್ಚಿನ ಜನಸಂಖ್ಯೆಯ ಗಮನವನ್ನು ಮಾತ್ರವಲ್ಲದೆ, ಮ್ಯೂಚುವಲ್ ಫಂಡ್ಗಳಲ್ಲಿ ತಮ್ಮ ಹೂಡಿಕೆಯ ಪ್ರಯಾಣವನ್ನು ಪ್ರಾರಂಭಿಸಲು ಅನೇಕ ಯುವಕರ ಗಮನವನ್ನು ಗಳಿಸಿದೆ. ಎಹೂಡಿಕೆದಾರ ಯಾರು ಬಯಸುತ್ತಾರೆSIP ನಲ್ಲಿ ಹೂಡಿಕೆ ಮಾಡಿ ತಮ್ಮ ಪ್ರಮುಖ ಯೋಜನೆ ಮಾಡಬಹುದುಹಣಕಾಸಿನ ಗುರಿಗಳು ಹಾಗೆ- ಮಗುವಿನ ಶಿಕ್ಷಣ, ಮದುವೆಯ ಖರ್ಚು, ಮನೆ/ಕಾರು ಖರೀದಿ ಇತ್ಯಾದಿ ಶಿಸ್ತುಬದ್ಧವಾಗಿ. ಒಬ್ಬರು ತಮ್ಮ ಗುರಿಗಳಿಗೆ ಅನುಗುಣವಾಗಿ ಹೂಡಿಕೆಯನ್ನು ಪ್ರಾರಂಭಿಸಬಹುದು (ಅಲ್ಪಾವಧಿ, ಮಧ್ಯಾವಧಿ ಮತ್ತು ದೀರ್ಘಾವಧಿ) ಮತ್ತು ಒಂದು ನಿರ್ದಿಷ್ಟ ಅವಧಿಯಲ್ಲಿ ಸಂಪತ್ತಿನ ಹೆಚ್ಚಳವನ್ನು ಸಾಧಿಸಬಹುದು.
SIP ಗಳು ರೂಪಾಯಿ ವೆಚ್ಚದ ಸರಾಸರಿ ಮತ್ತು ಪ್ರಮುಖ ಪ್ರಯೋಜನಗಳನ್ನು ನೀಡುತ್ತವೆಸಂಯೋಜನೆಯ ಶಕ್ತಿ. ರೂಪಾಯಿ ವೆಚ್ಚದ ಸರಾಸರಿಯು ಒಬ್ಬ ವ್ಯಕ್ತಿಗೆ ಆಸ್ತಿ ಖರೀದಿಯ ವೆಚ್ಚವನ್ನು ಸರಾಸರಿ ಮಾಡಲು ಸಹಾಯ ಮಾಡುತ್ತದೆ. SIP ನಲ್ಲಿ, ಘಟಕಗಳ ಖರೀದಿಯನ್ನು ದೀರ್ಘಾವಧಿಯಲ್ಲಿ ಮಾಡಲಾಗುತ್ತದೆ ಮತ್ತು ಇವುಗಳು ಮಾಸಿಕ ಮಧ್ಯಂತರಗಳಲ್ಲಿ (ಸಾಮಾನ್ಯವಾಗಿ) ಸಮಾನವಾಗಿ ಹರಡುತ್ತವೆ. ಹೂಡಿಕೆಯು ಕಾಲಾನಂತರದಲ್ಲಿ ಹರಡುವುದರಿಂದ, ಹೂಡಿಕೆಯನ್ನು ಸ್ಟಾಕ್ಗೆ ಮಾಡಲಾಗುತ್ತದೆಮಾರುಕಟ್ಟೆ ವಿವಿಧ ಬೆಲೆಗಳಲ್ಲಿ ಹೂಡಿಕೆದಾರರಿಗೆ ಸರಾಸರಿ ವೆಚ್ಚದ ಲಾಭವನ್ನು ನೀಡುತ್ತದೆ, ಆದ್ದರಿಂದ ರೂಪಾಯಿ ವೆಚ್ಚದ ಸರಾಸರಿ ಎಂಬ ಪದ.
ಚಕ್ರಬಡ್ಡಿಯ ಸಂದರ್ಭದಲ್ಲಿ, ನೀವು ಅಸಲು ಮೇಲೆ ಮಾತ್ರ ಬಡ್ಡಿ ಪಡೆಯುವ ಸರಳ ಬಡ್ಡಿಗಿಂತ ಭಿನ್ನವಾಗಿ, ಇಲ್ಲಿ ಬಡ್ಡಿ ಮೊತ್ತವನ್ನು ಅಸಲಿಗೆ ಸೇರಿಸಲಾಗುತ್ತದೆ ಮತ್ತು ಬಡ್ಡಿಯನ್ನು ಹೊಸ ಅಸಲು (ಹಳೆಯ ಅಸಲು ಮತ್ತು ಲಾಭಗಳು) ಮೇಲೆ ಲೆಕ್ಕಹಾಕಲಾಗುತ್ತದೆ. ಈ ಪ್ರಕ್ರಿಯೆಯು ಪ್ರತಿ ಬಾರಿಯೂ ಮುಂದುವರಿಯುತ್ತದೆ. SIP ಯಲ್ಲಿನ ಮ್ಯೂಚುಯಲ್ ಫಂಡ್ಗಳು ಕಂತುಗಳಲ್ಲಿರುವುದರಿಂದ, ಅವುಗಳು ಸಂಯೋಜಿತವಾಗಿರುತ್ತವೆ, ಇದು ಆರಂಭದಲ್ಲಿ ಹೂಡಿಕೆ ಮಾಡಿದ ಮೊತ್ತಕ್ಕೆ ಹೆಚ್ಚಿನದನ್ನು ಸೇರಿಸುತ್ತದೆ.
ವ್ಯವಸ್ಥಿತ ಹೂಡಿಕೆ ಯೋಜನೆಯಲ್ಲಿ ಹೂಡಿಕೆ ಮಾಡುವುದು ಹೇಗೆ?
Fincash.com ನಲ್ಲಿ ಜೀವಮಾನಕ್ಕಾಗಿ ಉಚಿತ ಹೂಡಿಕೆ ಖಾತೆಯನ್ನು ತೆರೆಯಿರಿ
ನಿಮ್ಮ ನೋಂದಣಿ ಮತ್ತು KYC ಪ್ರಕ್ರಿಯೆಯನ್ನು ಪೂರ್ಣಗೊಳಿಸಿ
ದಾಖಲೆಗಳನ್ನು ಅಪ್ಲೋಡ್ ಮಾಡಿ (PAN, ಆಧಾರ್, ಇತ್ಯಾದಿ).ಮತ್ತು, ನೀವು ಹೂಡಿಕೆ ಮಾಡಲು ಸಿದ್ಧರಿದ್ದೀರಿ!
ಹಾಗಾದರೆ, ನೀವು ಯಾವುದಕ್ಕಾಗಿ ಕಾಯುತ್ತಿದ್ದೀರಿ? ನಿಮ್ಮ SIP ಅಥವಾ ವ್ಯವಸ್ಥಿತ ಹೂಡಿಕೆ ಯೋಜನೆಯೊಂದಿಗೆ ಪ್ರಾರಂಭಿಸಿ ಮತ್ತು ಇದೀಗ ಉತ್ತಮವಾಗಿ ಉಳಿಸಿ!
Talk to our investment specialist
FY 22 - 23 ರಲ್ಲಿ ಹೂಡಿಕೆ ಮಾಡಲು ಉತ್ತಮ SIP ಯೋಜನೆಗಳು
To generate capital appreciation and income distribution to unit holders by investing predominantly in equity/equity related securities of the companies belonging to the infrastructure development and balance in debt securities and money market instruments. Research Highlights for ICICI Prudential Infrastructure Fund Below is the key information for ICICI Prudential Infrastructure Fund Returns up to 1 year are on The objective of the scheme would be to provide investors with opportunities for long-term growth in capital along with the liquidity of an open-ended scheme through an active management of investments in a diversified basket of equity stocks of domestic Public Sector Undertakings and in debt and money market instruments issued by PSUs AND others. Research Highlights for SBI PSU Fund Below is the key information for SBI PSU Fund Returns up to 1 year are on The investment objective of the scheme is to provide long term growth from a portfolio of equity / equity related instruments of companies engaged either directly or indirectly in the infrastructure sector. Research Highlights for LIC MF Infrastructure Fund Below is the key information for LIC MF Infrastructure Fund Returns up to 1 year are on "The primary investment objective of the Scheme is to seek capital appreciation by investing predominantly in units of MLIIF - WGF. The Scheme may, at the discretion of the Investment Manager, also invest in the units of other similar overseas mutual fund schemes, which may constitute a significant part of its corpus. The Scheme may also invest a certain portion of its corpus in money market securities and/or units of money market/liquid schemes of DSP Merrill Lynch Mutual Fund, in order to meet liquidity requirements from time to time. However, there is no assurance that the investment objective of the Scheme will be realized." Research Highlights for DSP World Gold Fund Below is the key information for DSP World Gold Fund Returns up to 1 year are on (Erstwhile Reliance Diversified Power Sector Fund) The primary investment objective of the scheme is to generate long term capital appreciation by investing predominantly in equity and equity related securities of companies in the power sector. Research Highlights for Nippon India Power and Infra Fund Below is the key information for Nippon India Power and Infra Fund Returns up to 1 year are on (Erstwhile Motilal Oswal MOSt Focused Midcap 30 Fund) The investment objective of the Scheme is to achieve long term capital appreciation by investing in a maximum of 30 quality mid-cap companies having long-term competitive advantages and potential for growth. However, there can be no assurance or guarantee that the investment objective of the Scheme would be achieved. Research Highlights for Motilal Oswal Midcap 30 Fund Below is the key information for Motilal Oswal Midcap 30 Fund Returns up to 1 year are on To generate capital appreciation, from a portfolio that is substantially constituted of equity securities and equity related securities of corporates, which could benefit from structural changes brought about by continuing liberalization in economic policies by the government and/or continuing investments in infrastructure, both by the public and private sector. Research Highlights for DSP India T.I.G.E.R Fund Below is the key information for DSP India T.I.G.E.R Fund Returns up to 1 year are on To generate capital appreciation by investing in Equity and Equity Related Instruments of companies where the Central / State Government(s) has majority shareholding or management control or has powers to appoint majority of directors. However, there is no assurance or guarantee that the investment objective of the Scheme will be achieved. The Scheme does not assure or guarantee any returns. Research Highlights for Invesco India PSU Equity Fund Below is the key information for Invesco India PSU Equity Fund Returns up to 1 year are on The Scheme seeks to generate long term capital appreciation through a portfolio of predominantly equity and equity related securities of companies engaged in manufacturing and infrastructure and related sectors. Further, there can be no assurance that the investment objectives of the scheme will be realized. The Scheme is not providing any assured or guaranteed returns Research Highlights for BOI AXA Manufacturing and Infrastructure Fund Below is the key information for BOI AXA Manufacturing and Infrastructure Fund Returns up to 1 year are on Investment Objective is “capital appreciation” through investments in stocks of the companies engaged in the transportation and logistics sector. Research Highlights for UTI Transportation & Logistics Fund Below is the key information for UTI Transportation & Logistics Fund Returns up to 1 year are on Fund NAV Net Assets (Cr) Min SIP Investment 3 MO (%) 6 MO (%) 1 YR (%) 3 YR (%) 5 YR (%) 2025 (%) ICICI Prudential Infrastructure Fund Growth ₹202.51
↑ 0.83 ₹8,550 100 1.1 5.4 4.6 18.4 23 6.7 SBI PSU Fund Growth ₹34.3228
↑ 0.27 ₹6,684 500 -4.4 -1.7 9.6 22.4 22.9 11.3 LIC MF Infrastructure Fund Growth ₹54.5662
↑ 0.75 ₹1,137 1,000 5.3 14.5 9.8 24.5 22.4 -3.7 DSP World Gold Fund Growth ₹50.4247
↑ 1.63 ₹1,433 500 -12.7 -17.8 62.8 43.6 22.1 167.1 Nippon India Power and Infra Fund Growth ₹381.086
↑ 3.66 ₹8,043 100 0.6 14 11.4 19.9 22 -0.5 Motilal Oswal Midcap 30 Fund Growth ₹100.253
↑ 0.39 ₹37,474 500 10.2 8.9 -1.6 19.2 21.7 -12.1 DSP India T.I.G.E.R Fund Growth ₹359.538
↑ 2.49 ₹6,264 500 4.5 16.6 15.1 21.2 21.6 -2.5 Invesco India PSU Equity Fund Growth ₹64.91
↑ 0.49 ₹1,473 500 -3.5 -5.1 4.4 20 20.6 10.3 BOI AXA Manufacturing and Infrastructure Fund Growth ₹66.6
↑ 0.16 ₹837 1,000 6.1 15 17.9 22.3 20.3 7.8 UTI Transportation & Logistics Fund Growth ₹300.36
↑ 3.32 ₹3,962 500 10.7 6.5 14 18.7 20.3 19.5 Note: Returns up to 1 year are on absolute basis & more than 1 year are on CAGR basis. as on 31 Jul 26 Research Highlights & Commentary of 10 Funds showcased
Commentary ICICI Prudential Infrastructure Fund SBI PSU Fund LIC MF Infrastructure Fund DSP World Gold Fund Nippon India Power and Infra Fund Motilal Oswal Midcap 30 Fund DSP India T.I.G.E.R Fund Invesco India PSU Equity Fund BOI AXA Manufacturing and Infrastructure Fund UTI Transportation & Logistics Fund Point 1 Top quartile AUM (₹8,550 Cr). Upper mid AUM (₹6,684 Cr). Bottom quartile AUM (₹1,137 Cr). Bottom quartile AUM (₹1,433 Cr). Upper mid AUM (₹8,043 Cr). Highest AUM (₹37,474 Cr). Upper mid AUM (₹6,264 Cr). Lower mid AUM (₹1,473 Cr). Bottom quartile AUM (₹837 Cr). Lower mid AUM (₹3,962 Cr). Point 2 Established history (20+ yrs). Established history (16+ yrs). Established history (18+ yrs). Established history (18+ yrs). Oldest track record among peers (22 yrs). Established history (12+ yrs). Established history (22+ yrs). Established history (16+ yrs). Established history (16+ yrs). Established history (22+ yrs). Point 3 Rating: 3★ (upper mid). Rating: 2★ (bottom quartile). Not Rated. Rating: 3★ (upper mid). Top rated. Rating: 3★ (upper mid). Rating: 4★ (top quartile). Rating: 3★ (lower mid). Not Rated. Rating: 3★ (lower mid). Point 4 Risk profile: High. Risk profile: High. Risk profile: High. Risk profile: High. Risk profile: High. Risk profile: Moderately High. Risk profile: High. Risk profile: High. Risk profile: High. Risk profile: High. Point 5 5Y return: 22.96% (top quartile). 5Y return: 22.88% (top quartile). 5Y return: 22.40% (upper mid). 5Y return: 22.15% (upper mid). 5Y return: 21.98% (upper mid). 5Y return: 21.68% (lower mid). 5Y return: 21.62% (lower mid). 5Y return: 20.63% (bottom quartile). 5Y return: 20.28% (bottom quartile). 5Y return: 20.25% (bottom quartile). Point 6 3Y return: 18.40% (bottom quartile). 3Y return: 22.37% (upper mid). 3Y return: 24.50% (top quartile). 3Y return: 43.62% (top quartile). 3Y return: 19.91% (lower mid). 3Y return: 19.20% (bottom quartile). 3Y return: 21.24% (upper mid). 3Y return: 20.01% (lower mid). 3Y return: 22.25% (upper mid). 3Y return: 18.66% (bottom quartile). Point 7 1Y return: 4.59% (bottom quartile). 1Y return: 9.60% (lower mid). 1Y return: 9.79% (lower mid). 1Y return: 62.77% (top quartile). 1Y return: 11.37% (upper mid). 1Y return: -1.65% (bottom quartile). 1Y return: 15.10% (upper mid). 1Y return: 4.39% (bottom quartile). 1Y return: 17.88% (top quartile). 1Y return: 14.00% (upper mid). Point 8 Alpha: 0.00 (upper mid). Alpha: -0.30 (bottom quartile). Alpha: 8.41 (top quartile). Alpha: 2.12 (upper mid). Alpha: 8.81 (top quartile). Alpha: -14.72 (bottom quartile). Alpha: 0.00 (upper mid). Alpha: -6.88 (bottom quartile). Alpha: 0.00 (lower mid). Alpha: 0.00 (lower mid). Point 9 Sharpe: -0.07 (bottom quartile). Sharpe: 0.12 (lower mid). Sharpe: 0.22 (upper mid). Sharpe: 1.22 (top quartile). Sharpe: 0.24 (upper mid). Sharpe: -0.71 (bottom quartile). Sharpe: 0.44 (upper mid). Sharpe: -0.16 (bottom quartile). Sharpe: 0.53 (top quartile). Sharpe: 0.12 (lower mid). Point 10 Information ratio: 0.00 (upper mid). Information ratio: -0.11 (lower mid). Information ratio: 0.58 (top quartile). Information ratio: -0.50 (bottom quartile). Information ratio: 0.56 (top quartile). Information ratio: -0.25 (bottom quartile). Information ratio: 0.00 (upper mid). Information ratio: -0.57 (bottom quartile). Information ratio: 0.00 (upper mid). Information ratio: 0.00 (lower mid). ICICI Prudential Infrastructure Fund
SBI PSU Fund
LIC MF Infrastructure Fund
DSP World Gold Fund
Nippon India Power and Infra Fund
Motilal Oswal Midcap 30 Fund
DSP India T.I.G.E.R Fund
Invesco India PSU Equity Fund
BOI AXA Manufacturing and Infrastructure Fund
UTI Transportation & Logistics Fund
ಆಸ್ತಿ >= 200 ಕೋಟಿ & ವಿಂಗಡಿಸಲಾಗಿದೆ5 ವರ್ಷಗಳ ರಿಟರ್ನ್.1. ICICI Prudential Infrastructure Fund
ICICI Prudential Infrastructure Fund
Growth Launch Date 31 Aug 05 NAV (31 Jul 26) ₹202.51 ↑ 0.83 (0.41 %) Net Assets (Cr) ₹8,550 on 30 Jun 26 Category Equity - Sectoral AMC ICICI Prudential Asset Management Company Limited Rating ☆☆☆ Risk High Expense Ratio 1.89 Sharpe Ratio -0.07 Information Ratio 0 Alpha Ratio 0 Min Investment 5,000 Min SIP Investment 100 Exit Load 0-1 Years (1%),1 Years and above(NIL) Growth of 10,000 investment over the years.
Date Value 31 Jul 21 ₹10,000 31 Jul 22 ₹11,961 31 Jul 23 ₹16,935 31 Jul 24 ₹27,533 31 Jul 25 ₹26,878 31 Jul 26 ₹28,111 Returns for ICICI Prudential Infrastructure Fund
absolute basis & more than 1 year are on CAGR (Compound Annual Growth Rate) basis. as on 31 Jul 26 Duration Returns 1 Month -0.8% 3 Month 1.1% 6 Month 5.4% 1 Year 4.6% 3 Year 18.4% 5 Year 23% 10 Year 15 Year Since launch 15.5% Historical performance (Yearly) on absolute basis
Year Returns 2025 6.7% 2024 27.4% 2023 44.6% 2022 28.8% 2021 50.1% 2020 3.6% 2019 2.6% 2018 -14% 2017 40.8% 2016 2% Fund Manager information for ICICI Prudential Infrastructure Fund
Name Since Tenure Ihab Dalwai 3 Jun 17 9.08 Yr. Sharmila D’mello 30 Jun 22 4.01 Yr. Data below for ICICI Prudential Infrastructure Fund as on 30 Jun 26
Equity Sector Allocation
Sector Value Industrials 47.57% Financial Services 10.57% Utility 10.32% Basic Materials 9.74% Real Estate 8.09% Energy 5.04% Consumer Cyclical 1.98% Communication Services 0.09% Asset Allocation
Asset Class Value Cash 5.83% Equity 94.17% Top Securities Holdings / Portfolio
Name Holding Value Quantity InterGlobe Aviation Ltd (Industrials)
Equity, Since 28 Feb 23 | INDIGO9% ₹745 Cr 1,691,985
↑ 50,000 Larsen & Toubro Ltd (Industrials)
Equity, Since 30 Nov 09 | LT7% ₹614 Cr 1,505,704 Oberoi Realty Ltd (Real Estate)
Equity, Since 31 May 23 | OBEROIRLTY4% ₹365 Cr 2,139,426 Gujarat Energy Ltd (Utilities)
Equity, Since 31 Jan 23 | GUJGASLTD4% ₹340 Cr 8,482,024
↑ 156,557 NTPC Ltd (Utilities)
Equity, Since 29 Feb 16 | NTPC4% ₹334 Cr 8,626,448 Shree Cement Ltd (Basic Materials)
Equity, Since 30 Apr 24 | SHREECEM3% ₹270 Cr 106,892
↑ 3,387 Kalpataru Projects International Ltd (Industrials)
Equity, Since 30 Sep 06 | KPIL3% ₹262 Cr 2,005,608 AIA Engineering Ltd (Industrials)
Equity, Since 28 Feb 21 | AIAENG3% ₹258 Cr 572,697 HDFC Bank Ltd (Financial Services)
Equity, Since 31 Jan 22 | HDFCBANK3% ₹250 Cr 3,357,506
↑ 1,057,506 Container Corporation of India Ltd (Industrials)
Equity, Since 31 Jan 16 | CONCOR3% ₹227 Cr 4,885,153 2. SBI PSU Fund
SBI PSU Fund
Growth Launch Date 7 Jul 10 NAV (31 Jul 26) ₹34.3228 ↑ 0.27 (0.79 %) Net Assets (Cr) ₹6,684 on 30 Jun 26 Category Equity - Sectoral AMC SBI Funds Management Private Limited Rating ☆☆ Risk High Expense Ratio 1.89 Sharpe Ratio 0.12 Information Ratio -0.11 Alpha Ratio -0.3 Min Investment 5,000 Min SIP Investment 500 Exit Load 0-1 Years (1%),1 Years and above(NIL) Growth of 10,000 investment over the years.
Date Value 31 Jul 21 ₹10,000 31 Jul 22 ₹10,878 31 Jul 23 ₹15,287 31 Jul 24 ₹28,684 31 Jul 25 ₹25,557 31 Jul 26 ₹28,011 Returns for SBI PSU Fund
absolute basis & more than 1 year are on CAGR (Compound Annual Growth Rate) basis. as on 31 Jul 26 Duration Returns 1 Month -0.8% 3 Month -4.4% 6 Month -1.7% 1 Year 9.6% 3 Year 22.4% 5 Year 22.9% 10 Year 15 Year Since launch 8% Historical performance (Yearly) on absolute basis
Year Returns 2025 11.3% 2024 23.5% 2023 54% 2022 29% 2021 32.4% 2020 -10% 2019 6% 2018 -23.8% 2017 21.9% 2016 16.2% Fund Manager information for SBI PSU Fund
Name Since Tenure Rohit Shimpi 1 Jun 24 2.08 Yr. Data below for SBI PSU Fund as on 30 Jun 26
Equity Sector Allocation
Sector Value Financial Services 32.54% Utility 31.22% Industrials 14.07% Energy 11.97% Basic Materials 6.94% Asset Allocation
Asset Class Value Cash 3.18% Equity 96.74% Debt 0.07% Top Securities Holdings / Portfolio
Name Holding Value Quantity State Bank of India (Financial Services)
Equity, Since 31 Jul 10 | SBIN17% ₹1,112 Cr 11,527,500
↑ 1,000,000 GAIL (India) Ltd (Utilities)
Equity, Since 31 May 24 | GAIL10% ₹628 Cr 38,150,000 NTPC Ltd (Utilities)
Equity, Since 31 Jul 10 | NTPC9% ₹597 Cr 15,443,244 Bharat Electronics Ltd (Industrials)
Equity, Since 30 Jun 24 | BEL9% ₹583 Cr 14,185,000
↑ 800,000 Power Grid Corp Of India Ltd (Utilities)
Equity, Since 31 Jul 10 | POWERGRID9% ₹579 Cr 19,935,554 Oil & Natural Gas Corp Ltd (Energy)
Equity, Since 31 May 20 | ONGC6% ₹389 Cr 14,655,000 Bank of Baroda (Financial Services)
Equity, Since 31 Aug 24 | BANKBARODA5% ₹352 Cr 13,100,000 Bharat Petroleum Corp Ltd (Energy)
Equity, Since 31 Aug 24 | BPCL4% ₹289 Cr 9,700,000 Bharat Heavy Electricals Ltd (Industrials)
Equity, Since 30 Jun 25 | BHEL4% ₹271 Cr 6,500,000 NMDC Ltd (Basic Materials)
Equity, Since 31 Oct 23 | NMDC4% ₹245 Cr 27,900,000 3. LIC MF Infrastructure Fund
LIC MF Infrastructure Fund
Growth Launch Date 29 Feb 08 NAV (31 Jul 26) ₹54.5662 ↑ 0.75 (1.39 %) Net Assets (Cr) ₹1,137 on 30 Jun 26 Category Equity - Sectoral AMC LIC Mutual Fund Asset Mgmt Co Ltd Rating Risk High Expense Ratio 2.21 Sharpe Ratio 0.22 Information Ratio 0.58 Alpha Ratio 8.41 Min Investment 5,000 Min SIP Investment 1,000 Exit Load 0-1 Years (1%),1 Years and above(NIL) Growth of 10,000 investment over the years.
Date Value 31 Jul 21 ₹10,000 31 Jul 22 ₹11,519 31 Jul 23 ₹14,236 31 Jul 24 ₹26,350 31 Jul 25 ₹25,021 31 Jul 26 ₹27,470 Returns for LIC MF Infrastructure Fund
absolute basis & more than 1 year are on CAGR (Compound Annual Growth Rate) basis. as on 31 Jul 26 Duration Returns 1 Month -0.9% 3 Month 5.3% 6 Month 14.5% 1 Year 9.8% 3 Year 24.5% 5 Year 22.4% 10 Year 15 Year Since launch 9.7% Historical performance (Yearly) on absolute basis
Year Returns 2025 -3.7% 2024 47.8% 2023 44.4% 2022 7.9% 2021 46.6% 2020 -0.1% 2019 13.3% 2018 -14.6% 2017 42.2% 2016 -2.2% Fund Manager information for LIC MF Infrastructure Fund
Name Since Tenure Sumit Bhatnagar 7 Apr 26 0.23 Yr. Mahesh Bendre 1 Jul 24 2 Yr. Data below for LIC MF Infrastructure Fund as on 30 Jun 26
Equity Sector Allocation
Sector Value Industrials 37.05% Consumer Cyclical 20.88% Basic Materials 12.42% Utility 11.88% Communication Services 5.02% Financial Services 3.98% Real Estate 1.97% Health Care 1.89% Technology 1.08% Asset Allocation
Asset Class Value Cash 3.82% Equity 96.18% Top Securities Holdings / Portfolio
Name Holding Value Quantity Larsen & Toubro Ltd (Industrials)
Equity, Since 30 Apr 09 | LT4% ₹44 Cr 106,968
↓ -10,884 Garware Hi-Tech Films Ltd (Basic Materials)
Equity, Since 31 Aug 23 | 5006554% ₹40 Cr 65,325
↓ -7,684 Tata Motors Passenger Vehicles Ltd (Consumer Cyclical)
Equity, Since 28 Feb 26 | TMPV4% ₹39 Cr 982,891
↓ -332,760 Tata Motors Ltd (Consumer Cyclical)
Equity, Since 31 Oct 25 | TMCV4% ₹39 Cr 1,015,933
↑ 26,983 Tata Power Co Ltd (Utilities)
Equity, Since 29 Feb 24 | TATAPOWER3% ₹36 Cr 861,040
↑ 524,312 KSH International Ltd (Industrials)
Equity, Since 31 Dec 25 | KSHINTL3% ₹34 Cr 432,816
↑ 6,280 Siemens Energy India Ltd (Utilities)
Equity, Since 31 Aug 25 | ENRIN3% ₹34 Cr 87,106
↑ 24,800 JSW Infrastructure Ltd (Industrials)
Equity, Since 30 Apr 26 | JSWINFRA3% ₹31 Cr 1,133,858
↑ 745,681 Carraro India Ltd (Consumer Cyclical)
Equity, Since 31 Dec 24 | CARRARO3% ₹31 Cr 572,991 Bharat Dynamics Ltd Ordinary Shares (Industrials)
Equity, Since 31 Jan 26 | BDL3% ₹29 Cr 242,954
↑ 157,744 4. DSP World Gold Fund
DSP World Gold Fund
Growth Launch Date 14 Sep 07 NAV (30 Jul 26) ₹50.4247 ↑ 1.63 (3.33 %) Net Assets (Cr) ₹1,433 on 30 Jun 26 Category Equity - Global AMC DSP BlackRock Invmt Managers Pvt. Ltd. Rating ☆☆☆ Risk High Expense Ratio 1.41 Sharpe Ratio 1.22 Information Ratio -0.5 Alpha Ratio 2.12 Min Investment 1,000 Min SIP Investment 500 Exit Load 0-12 Months (1%),12 Months and above(NIL) Growth of 10,000 investment over the years.
Date Value 31 Jul 21 ₹10,000 31 Jul 22 ₹7,373 31 Jul 23 ₹9,366 31 Jul 24 ₹11,150 31 Jul 25 ₹16,504 31 Jul 26 ₹26,355 Returns for DSP World Gold Fund
absolute basis & more than 1 year are on CAGR (Compound Annual Growth Rate) basis. as on 31 Jul 26 Duration Returns 1 Month 2.3% 3 Month -12.7% 6 Month -17.8% 1 Year 62.8% 3 Year 43.6% 5 Year 22.1% 10 Year 15 Year Since launch 8.9% Historical performance (Yearly) on absolute basis
Year Returns 2025 167.1% 2024 15.9% 2023 7% 2022 -7.7% 2021 -9% 2020 31.4% 2019 35.1% 2018 -10.7% 2017 -4% 2016 52.7% Fund Manager information for DSP World Gold Fund
Name Since Tenure Kaivalya Nadkarni 1 May 25 1.17 Yr. Data below for DSP World Gold Fund as on 30 Jun 26
Equity Sector Allocation
Sector Value Basic Materials 94.47% Asset Allocation
Asset Class Value Cash 3.62% Equity 94.47% Debt 0% Other 1.91% Top Securities Holdings / Portfolio
Name Holding Value Quantity BGF World Gold I2
Investment Fund | -68% ₹1,141 Cr 1,005,044 VanEck Gold Miners ETF
- | GDX29% ₹490 Cr 573,719 Treps / Reverse Repo Investments
CBLO/Reverse Repo | -3% ₹54 Cr Net Receivables/Payables
Net Current Assets | -0% -₹6 Cr 5. Nippon India Power and Infra Fund
Nippon India Power and Infra Fund
Growth Launch Date 8 May 04 NAV (31 Jul 26) ₹381.086 ↑ 3.66 (0.97 %) Net Assets (Cr) ₹8,043 on 30 Jun 26 Category Equity - Sectoral AMC Nippon Life Asset Management Ltd. Rating ☆☆☆☆ Risk High Expense Ratio 1.85 Sharpe Ratio 0.24 Information Ratio 0.56 Alpha Ratio 8.81 Min Investment 5,000 Min SIP Investment 100 Exit Load 0-1 Years (1%),1 Years and above(NIL) Growth of 10,000 investment over the years.
Date Value 31 Jul 21 ₹10,000 31 Jul 22 ₹10,666 31 Jul 23 ₹15,659 31 Jul 24 ₹26,918 31 Jul 25 ₹24,246 31 Jul 26 ₹27,001 Returns for Nippon India Power and Infra Fund
absolute basis & more than 1 year are on CAGR (Compound Annual Growth Rate) basis. as on 31 Jul 26 Duration Returns 1 Month -0.8% 3 Month 0.6% 6 Month 14% 1 Year 11.4% 3 Year 19.9% 5 Year 22% 10 Year 15 Year Since launch 17.8% Historical performance (Yearly) on absolute basis
Year Returns 2025 -0.5% 2024 26.9% 2023 58% 2022 10.9% 2021 48.9% 2020 10.8% 2019 -2.9% 2018 -21.1% 2017 61.7% 2016 0.1% Fund Manager information for Nippon India Power and Infra Fund
Name Since Tenure Kinjal Desai 25 May 18 8.11 Yr. Rahul Modi 19 Aug 24 1.87 Yr. Amber Singhania 11 Mar 26 0.31 Yr. Data below for Nippon India Power and Infra Fund as on 30 Jun 26
Equity Sector Allocation
Sector Value Industrials 34.92% Utility 22.36% Consumer Cyclical 11.45% Energy 9.18% Basic Materials 6.78% Technology 4.51% Financial Services 4.09% Communication Services 2.39% Real Estate 1.47% Health Care 1.24% Asset Allocation
Asset Class Value Cash 1.59% Equity 98.41% Top Securities Holdings / Portfolio
Name Holding Value Quantity Reliance Industries Ltd (Energy)
Equity, Since 30 Nov 18 | RELIANCE8% ₹616 Cr 4,660,000 Larsen & Toubro Ltd (Industrials)
Equity, Since 30 Nov 07 | LT7% ₹557 Cr 1,366,958
↑ 20,000 NTPC Ltd (Utilities)
Equity, Since 31 May 09 | NTPC6% ₹487 Cr 12,600,000
↓ -554,060 NTPC Green Energy Ltd (Utilities)
Equity, Since 30 Nov 24 | NTPCGREEN4% ₹296 Cr 28,594,584
↑ 2,403,505 Tata Power Co Ltd (Utilities)
Equity, Since 30 Apr 23 | TATAPOWER3% ₹246 Cr 5,850,789
↓ -100,000 Bharat Heavy Electricals Ltd (Industrials)
Equity, Since 30 Sep 24 | BHEL3% ₹242 Cr 5,800,000
↓ -1,148,468 Triveni Turbine Ltd (Industrials)
Equity, Since 30 Jun 25 | TRITURBINE3% ₹237 Cr 3,193,288
↑ 120,000 Power Finance Corp Ltd (Financial Services)
Equity, Since 31 Oct 24 | PFC3% ₹198 Cr 4,620,000
↑ 720,000 Bharti Airtel Ltd (Communication Services)
Equity, Since 30 Apr 18 | BHARTIARTL2% ₹188 Cr 1,030,000
↑ 180,000 CG Power & Industrial Solutions Ltd (Industrials)
Equity, Since 30 Sep 24 | CGPOWER2% ₹174 Cr 1,893,400
↓ -276,614 6. Motilal Oswal Midcap 30 Fund
Motilal Oswal Midcap 30 Fund
Growth Launch Date 24 Feb 14 NAV (31 Jul 26) ₹100.253 ↑ 0.39 (0.39 %) Net Assets (Cr) ₹37,474 on 30 Jun 26 Category Equity - Mid Cap AMC Motilal Oswal Asset Management Co. Ltd Rating ☆☆☆ Risk Moderately High Expense Ratio 1.56 Sharpe Ratio -0.71 Information Ratio -0.25 Alpha Ratio -14.72 Min Investment 5,000 Min SIP Investment 500 Exit Load 0-1 Years (1%),1 Years and above(NIL) Growth of 10,000 investment over the years.
Date Value 31 Jul 21 ₹10,000 31 Jul 22 ₹12,488 31 Jul 23 ₹15,748 31 Jul 24 ₹26,692 31 Jul 25 ₹27,117 31 Jul 26 ₹26,669 Returns for Motilal Oswal Midcap 30 Fund
absolute basis & more than 1 year are on CAGR (Compound Annual Growth Rate) basis. as on 31 Jul 26 Duration Returns 1 Month 6.6% 3 Month 10.2% 6 Month 8.9% 1 Year -1.6% 3 Year 19.2% 5 Year 21.7% 10 Year 15 Year Since launch 20.4% Historical performance (Yearly) on absolute basis
Year Returns 2025 -12.1% 2024 57.1% 2023 41.7% 2022 10.7% 2021 55.8% 2020 9.3% 2019 9.7% 2018 -12.7% 2017 30.8% 2016 5.2% Fund Manager information for Motilal Oswal Midcap 30 Fund
Name Since Tenure Varun Sharma 21 Jan 26 0.44 Yr. Swapnil Mayekar 18 Nov 25 0.62 Yr. Ajay Khandelwal 1 Oct 24 1.75 Yr. Ankit Agarwal 21 Jan 26 0.44 Yr. Rakesh Shetty 22 Nov 22 3.61 Yr. Data below for Motilal Oswal Midcap 30 Fund as on 30 Jun 26
Equity Sector Allocation
Sector Value Financial Services 31.02% Technology 26.84% Industrials 13.76% Consumer Cyclical 13.41% Communication Services 3.08% Real Estate 2.81% Health Care 2.46% Asset Allocation
Asset Class Value Cash 6.63% Equity 93.37% Top Securities Holdings / Portfolio
Name Holding Value Quantity One97 Communications Ltd (Technology)
Equity, Since 30 Sep 24 | PAYTM7% ₹2,659 Cr 23,765,865 Coforge Ltd (Technology)
Equity, Since 31 Mar 23 | COFORGE6% ₹2,233 Cr 15,703,312
↓ -979,603 Kalyan Jewellers India Ltd (Consumer Cyclical)
Equity, Since 29 Feb 24 | KALYANKJIL6% ₹2,180 Cr 61,413,395 KEI Industries Ltd (Industrials)
Equity, Since 30 Nov 24 | KEI6% ₹2,123 Cr 4,030,834 Eternal Ltd (Consumer Cyclical)
Equity, Since 31 Aug 25 | ETERNAL6% ₹2,115 Cr 84,386,866 Persistent Systems Ltd (Technology)
Equity, Since 31 Jan 23 | PERSISTENT6% ₹2,091 Cr 4,026,493 Aditya Birla Capital Ltd (Financial Services)
Equity, Since 30 Jun 25 | ABCAPITAL5% ₹1,906 Cr 52,459,381
↓ -1,000,000 Billionbrains Garage Ventures Ltd (Financial Services)
Equity, Since 31 Jan 26 | GROWW4% ₹1,564 Cr 84,616,660 Multi Commodity Exchange of India Ltd (Financial Services)
Equity, Since 31 Jan 26 | MCX4% ₹1,539 Cr 5,209,458 BSE Ltd (Financial Services)
Equity, Since 30 Nov 25 | BSE4% ₹1,451 Cr 3,500,830
↓ -256,232 7. DSP India T.I.G.E.R Fund
DSP India T.I.G.E.R Fund
Growth Launch Date 11 Jun 04 NAV (31 Jul 26) ₹359.538 ↑ 2.49 (0.70 %) Net Assets (Cr) ₹6,264 on 30 Jun 26 Category Equity - Sectoral AMC DSP BlackRock Invmt Managers Pvt. Ltd. Rating ☆☆☆☆ Risk High Expense Ratio 1.89 Sharpe Ratio 0.44 Information Ratio 0 Alpha Ratio 0 Min Investment 1,000 Min SIP Investment 500 Exit Load 0-12 Months (1%),12 Months and above(NIL) Growth of 10,000 investment over the years.
Date Value 31 Jul 21 ₹10,000 31 Jul 22 ₹10,886 31 Jul 23 ₹14,928 31 Jul 24 ₹25,470 31 Jul 25 ₹23,115 31 Jul 26 ₹26,604 Returns for DSP India T.I.G.E.R Fund
absolute basis & more than 1 year are on CAGR (Compound Annual Growth Rate) basis. as on 31 Jul 26 Duration Returns 1 Month -0.6% 3 Month 4.5% 6 Month 16.6% 1 Year 15.1% 3 Year 21.2% 5 Year 21.6% 10 Year 15 Year Since launch 17.6% Historical performance (Yearly) on absolute basis
Year Returns 2025 -2.5% 2024 32.4% 2023 49% 2022 13.9% 2021 51.6% 2020 2.7% 2019 6.7% 2018 -17.2% 2017 47% 2016 4.1% Fund Manager information for DSP India T.I.G.E.R Fund
Name Since Tenure Rohit Singhania 21 Jun 10 16.04 Yr. Data below for DSP India T.I.G.E.R Fund as on 30 Jun 26
Equity Sector Allocation
Sector Value Industrials 28.69% Basic Materials 13.29% Energy 9.47% Utility 9.46% Financial Services 8.49% Consumer Cyclical 6.52% Health Care 6.13% Communication Services 2.58% Technology 1.52% Real Estate 1.49% Consumer Defensive 0.71% Asset Allocation
Asset Class Value Cash 11.66% Equity 88.34% Top Securities Holdings / Portfolio
Name Holding Value Quantity Reliance Industries Ltd (Energy)
Equity, Since 31 Aug 19 | RELIANCE4% ₹262 Cr 1,983,815
↑ 1,304,235 NTPC Ltd (Utilities)
Equity, Since 30 Nov 17 | NTPC4% ₹249 Cr 6,433,748
↓ -94,844 Apollo Hospitals Enterprise Ltd (Healthcare)
Equity, Since 31 Dec 24 | APOLLOHOSP4% ₹247 Cr 301,630 Larsen & Toubro Ltd (Industrials)
Equity, Since 30 Jun 04 | LT4% ₹240 Cr 588,665 Kirloskar Oil Engines Ltd (Industrials)
Equity, Since 31 Mar 23 | 5332933% ₹161 Cr 834,973 Bharti Airtel Ltd (Communication Services)
Equity, Since 31 Oct 18 | BHARTIARTL3% ₹155 Cr 849,969 Coal India Ltd (Energy)
Equity, Since 31 Dec 23 | COALINDIA3% ₹154 Cr 3,352,298
↑ 647,118 INOX India Ltd (Industrials)
Equity, Since 31 Dec 23 | INOXINDIA2% ₹139 Cr 931,429
↓ -9,412 UltraTech Cement Ltd (Basic Materials)
Equity, Since 31 Dec 14 | ULTRACEMCO2% ₹135 Cr 118,010
↑ 51,464 Hindustan Aeronautics Ltd Ordinary Shares (Industrials)
Equity, Since 31 Oct 25 | HAL2% ₹131 Cr 305,098 8. Invesco India PSU Equity Fund
Invesco India PSU Equity Fund
Growth Launch Date 18 Nov 09 NAV (31 Jul 26) ₹64.91 ↑ 0.49 (0.76 %) Net Assets (Cr) ₹1,473 on 30 Jun 26 Category Equity - Sectoral AMC Invesco Asset Management (India) Private Ltd Rating ☆☆☆ Risk High Expense Ratio 2.14 Sharpe Ratio -0.16 Information Ratio -0.57 Alpha Ratio -6.88 Min Investment 5,000 Min SIP Investment 500 Exit Load 0-1 Years (1%),1 Years and above(NIL) Growth of 10,000 investment over the years.
Date Value 31 Jul 21 ₹10,000 31 Jul 22 ₹10,492 31 Jul 23 ₹14,778 31 Jul 24 ₹27,721 31 Jul 25 ₹24,471 31 Jul 26 ₹25,545 Returns for Invesco India PSU Equity Fund
absolute basis & more than 1 year are on CAGR (Compound Annual Growth Rate) basis. as on 31 Jul 26 Duration Returns 1 Month -0.5% 3 Month -3.5% 6 Month -5.1% 1 Year 4.4% 3 Year 20% 5 Year 20.6% 10 Year 15 Year Since launch 11.9% Historical performance (Yearly) on absolute basis
Year Returns 2025 10.3% 2024 25.6% 2023 54.5% 2022 20.5% 2021 31.1% 2020 6.1% 2019 10.1% 2018 -16.9% 2017 24.3% 2016 17.9% Fund Manager information for Invesco India PSU Equity Fund
Name Since Tenure Hiten Jain 1 Jul 25 1 Yr. Sagar Gandhi 1 Jul 25 1 Yr. Data below for Invesco India PSU Equity Fund as on 30 Jun 26
Equity Sector Allocation
Sector Value Financial Services 30.26% Industrials 29.89% Utility 19.1% Energy 13.91% Basic Materials 3.59% Consumer Cyclical 1.59% Asset Allocation
Asset Class Value Cash 1.66% Equity 98.34% Top Securities Holdings / Portfolio
Name Holding Value Quantity State Bank of India (Financial Services)
Equity, Since 28 Feb 21 | SBIN9% ₹128 Cr 1,323,094
↑ 151,862 Hindustan Aeronautics Ltd Ordinary Shares (Industrials)
Equity, Since 31 May 22 | HAL8% ₹112 Cr 261,137 Indian Bank (Financial Services)
Equity, Since 30 Jun 21 | INDIANB8% ₹112 Cr 1,341,970
↑ 78,651 Bharat Petroleum Corp Ltd (Energy)
Equity, Since 30 Sep 18 | BPCL6% ₹92 Cr 3,076,024 Bharat Electronics Ltd (Industrials)
Equity, Since 31 Mar 17 | BEL6% ₹85 Cr 2,078,629 Dredging Corp of India Ltd (Industrials)
Equity, Since 31 Jul 25 | DREDGECORP5% ₹75 Cr 646,300 NTPC Green Energy Ltd (Utilities)
Equity, Since 30 Nov 24 | NTPCGREEN5% ₹71 Cr 6,852,914 Bank of Baroda (Financial Services)
Equity, Since 30 Jun 21 | BANKBARODA5% ₹70 Cr 2,611,219 NTPC Ltd (Utilities)
Equity, Since 31 May 19 | NTPC5% ₹70 Cr 1,801,543 REC Ltd (Financial Services)
Equity, Since 31 Aug 23 | RECLTD4% ₹58 Cr 1,703,577 9. BOI AXA Manufacturing and Infrastructure Fund
BOI AXA Manufacturing and Infrastructure Fund
Growth Launch Date 5 Mar 10 NAV (31 Jul 26) ₹66.6 ↑ 0.16 (0.24 %) Net Assets (Cr) ₹837 on 30 Jun 26 Category Equity - Sectoral AMC BOI AXA Investment Mngrs Private Ltd Rating Risk High Expense Ratio 2.4 Sharpe Ratio 0.53 Information Ratio 0 Alpha Ratio 0 Min Investment 5,000 Min SIP Investment 1,000 Exit Load 0-1 Years (1%),1 Years and above(NIL) Growth of 10,000 investment over the years.
Date Value 31 Jul 21 ₹10,000 31 Jul 22 ₹10,684 31 Jul 23 ₹13,776 31 Jul 24 ₹22,241 31 Jul 25 ₹21,353 31 Jul 26 ₹25,170 Returns for BOI AXA Manufacturing and Infrastructure Fund
absolute basis & more than 1 year are on CAGR (Compound Annual Growth Rate) basis. as on 31 Jul 26 Duration Returns 1 Month 1.8% 3 Month 6.1% 6 Month 15% 1 Year 17.9% 3 Year 22.3% 5 Year 20.3% 10 Year 15 Year Since launch 12.3% Historical performance (Yearly) on absolute basis
Year Returns 2025 7.8% 2024 25.7% 2023 44.7% 2022 3.3% 2021 52.5% 2020 28.1% 2019 2.5% 2018 -22.8% 2017 56% 2016 1% Fund Manager information for BOI AXA Manufacturing and Infrastructure Fund
Name Since Tenure Nitin Gosar 27 Sep 22 3.76 Yr. Data below for BOI AXA Manufacturing and Infrastructure Fund as on 30 Jun 26
Equity Sector Allocation
Sector Value Industrials 24.81% Basic Materials 13.14% Consumer Cyclical 12.85% Health Care 11.87% Energy 10.92% Utility 6.13% Communication Services 4.02% Technology 3.57% Consumer Defensive 3.15% Real Estate 1.14% Asset Allocation
Asset Class Value Cash 6.24% Equity 93.66% Debt 0.1% Top Securities Holdings / Portfolio
Name Holding Value Quantity Larsen & Toubro Ltd (Industrials)
Equity, Since 31 Mar 10 | LT7% ₹52 Cr 127,443
↓ -23,672 NTPC Ltd (Utilities)
Equity, Since 31 May 21 | NTPC6% ₹48 Cr 1,250,367 Reliance Industries Ltd (Energy)
Equity, Since 31 Oct 20 | RELIANCE6% ₹47 Cr 356,510 Bharti Airtel Ltd (Communication Services)
Equity, Since 31 Dec 22 | BHARTIARTL4% ₹32 Cr 173,416 Dixon Technologies (India) Ltd (Technology)
Equity, Since 30 Apr 26 | DIXON4% ₹28 Cr 24,451
↑ 8,155 Aurobindo Pharma Ltd (Healthcare)
Equity, Since 31 May 25 | AUROPHARMA4% ₹28 Cr 196,331 Cemindia Projects Ltd (Industrials)
Equity, Since 31 Dec 22 | CEMPRO3% ₹26 Cr 243,152
↓ -65,994 Petronet LNG Ltd (Energy)
Equity, Since 31 Jan 26 | PETRONET3% ₹25 Cr 931,486
↑ 138,246 Stylam Industries Ltd (Consumer Cyclical)
Equity, Since 30 Apr 25 | 5269513% ₹24 Cr 83,372 Lloyds Metals & Energy Ltd (Basic Materials)
Equity, Since 30 Nov 24 | 5124553% ₹23 Cr 130,000
↓ -53,702 10. UTI Transportation & Logistics Fund
UTI Transportation & Logistics Fund
Growth Launch Date 11 Apr 04 NAV (31 Jul 26) ₹300.36 ↑ 3.32 (1.12 %) Net Assets (Cr) ₹3,962 on 30 Jun 26 Category Equity - Sectoral AMC UTI Asset Management Company Ltd Rating ☆☆☆ Risk High Expense Ratio 1.93 Sharpe Ratio 0.12 Information Ratio 0 Alpha Ratio 0 Min Investment 5,000 Min SIP Investment 500 Exit Load 0-1 Years (1%),1 Years and above(NIL) Growth of 10,000 investment over the years.
Date Value 31 Jul 21 ₹10,000 31 Jul 22 ₹12,359 31 Jul 23 ₹15,049 31 Jul 24 ₹23,724 31 Jul 25 ₹22,056 31 Jul 26 ₹25,144 Returns for UTI Transportation & Logistics Fund
absolute basis & more than 1 year are on CAGR (Compound Annual Growth Rate) basis. as on 31 Jul 26 Duration Returns 1 Month 7.1% 3 Month 10.7% 6 Month 6.5% 1 Year 14% 3 Year 18.7% 5 Year 20.3% 10 Year 15 Year Since launch 16.5% Historical performance (Yearly) on absolute basis
Year Returns 2025 19.5% 2024 18.7% 2023 40.1% 2022 14.7% 2021 24.3% 2020 11% 2019 -8.7% 2018 -19.5% 2017 39.6% 2016 4.8% Fund Manager information for UTI Transportation & Logistics Fund
Name Since Tenure Sachin Trivedi 22 Sep 16 9.78 Yr. Data below for UTI Transportation & Logistics Fund as on 30 Jun 26
Equity Sector Allocation
Sector Value Consumer Cyclical 79.75% Industrials 14.72% Asset Allocation
Asset Class Value Cash 5.36% Equity 94.46% Debt 0.13% Top Securities Holdings / Portfolio
Name Holding Value Quantity Mahindra & Mahindra Ltd (Consumer Cyclical)
Equity, Since 30 Apr 04 | M&M13% ₹492 Cr 1,614,940
↓ -49,846 Maruti Suzuki India Ltd (Consumer Cyclical)
Equity, Since 30 Apr 04 | MARUTI9% ₹339 Cr 258,455 Eternal Ltd (Consumer Cyclical)
Equity, Since 31 Jul 21 | ETERNAL9% ₹333 Cr 13,273,081
↑ 500,000 Eicher Motors Ltd (Consumer Cyclical)
Equity, Since 30 Nov 08 | EICHERMOT8% ₹301 Cr 419,126
↓ -44,388 Bajaj Auto Ltd (Consumer Cyclical)
Equity, Since 30 Apr 18 | BAJAJ-AUTO7% ₹263 Cr 251,657 Adani Ports & Special Economic Zone Ltd (Industrials)
Equity, Since 31 May 13 | ADANIPORTS7% ₹253 Cr 1,399,964
↑ 30,000 Hero MotoCorp Ltd (Consumer Cyclical)
Equity, Since 31 Mar 12 | HEROMOTOCO4% ₹151 Cr 308,832
↓ -18,907 Hyundai Motor India Ltd (Consumer Cyclical)
Equity, Since 31 Oct 24 | HYUNDAI4% ₹151 Cr 786,342
↑ 75,000 TVS Motor Co Ltd (Consumer Cyclical)
Equity, Since 30 Sep 19 | TVSMOTOR4% ₹147 Cr 438,430
↑ 35,000 InterGlobe Aviation Ltd (Industrials)
Equity, Since 31 May 18 | INDIGO3% ₹110 Cr 250,430
ಉತ್ತಮ SIP ಹೂಡಿಕೆಯನ್ನು ಹೇಗೆ ಆರಿಸುವುದು?
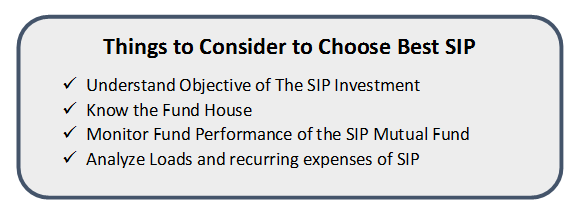
SIP ಮೂಲಕ ಹೂಡಿಕೆ ಮಾಡಲು ನಿಮಗೆ ಅನುಮತಿಸುವ ವಿವಿಧ ಮ್ಯೂಚುಯಲ್ ಫಂಡ್ಗಳಿವೆ. ಆದರೆ ಮುಖ್ಯ ಸಮಸ್ಯೆ ಆಯ್ಕೆಯಾಗಿದೆಅತ್ಯುತ್ತಮ ಮ್ಯೂಚುಯಲ್ ಫಂಡ್ಗಳು SIP ಗಾಗಿ. ಅತ್ಯುತ್ತಮ ಮ್ಯೂಚುಯಲ್ ಫಂಡ್ಗಳು ವ್ಯಕ್ತಿಯಿಂದ ವ್ಯಕ್ತಿಗೆ ಬದಲಾಗಬಹುದಾದರೂ, ಅತ್ಯುತ್ತಮ SIP ಮ್ಯೂಚುಯಲ್ ಫಂಡ್ ಅನ್ನು ಆಯ್ಕೆಮಾಡುವ ಮೊದಲು ಹೂಡಿಕೆದಾರರು ಪರಿಗಣಿಸಬಹುದಾದ ಕೆಲವು ಅಂಶಗಳ ಪಟ್ಟಿಯನ್ನು ಕೆಳಗೆ ನೀಡಲಾಗಿದೆ.
SIP ಹೂಡಿಕೆಯ ಉದ್ದೇಶವನ್ನು ಅರ್ಥಮಾಡಿಕೊಳ್ಳಿ
ಹೂಡಿಕೆಯ ವಿಷಯಕ್ಕೆ ಬಂದಾಗ, ನಮ್ಮಲ್ಲಿ ಪ್ರತಿಯೊಬ್ಬರಿಗೂ ವಿಭಿನ್ನ ಉದ್ದೇಶವಿದೆ. ಆದ್ದರಿಂದ SIP ಮೂಲಕ ಮ್ಯೂಚುವಲ್ ಫಂಡ್ಗಳಲ್ಲಿ ಹೂಡಿಕೆ ಮಾಡುವ ಮೊದಲು, ನಿಮ್ಮ ಹೂಡಿಕೆ ಗುರಿಗಳ ಸ್ಪಷ್ಟ ಚಿತ್ರಣವನ್ನು ಪಡೆಯಲು ಸಲಹೆ ನೀಡಲಾಗುತ್ತದೆ ಮತ್ತುಅಪಾಯದ ಪ್ರೊಫೈಲ್. ಸಾಮಾನ್ಯವಾಗಿ,ಇಕ್ವಿಟಿ ಮ್ಯೂಚುಯಲ್ ಫಂಡ್ಗಳು ದೀರ್ಘಕಾಲೀನ ಉದ್ದೇಶಗಳಿಗಾಗಿ ಪ್ರಯೋಜನಕಾರಿ ಎಂದು ಪರಿಗಣಿಸಲಾಗುತ್ತದೆಹಣದ ಮಾರುಕಟ್ಟೆ ಮತ್ತುಸಾಲ ನಿಧಿ ಅಲ್ಪಾವಧಿಯ ಉದ್ದೇಶಗಳಿಗೆ ಸೂಕ್ತವಾಗಿದೆ.
ಫಂಡ್ ಹೌಸ್ ಅನ್ನು ತಿಳಿಯಿರಿ
SIP ಆದಾಯದ ಹೆಚ್ಚಿನ ಭಾಗವು ನಿಮ್ಮ ಪರವಾಗಿ ನಿಮ್ಮ ಹಣವನ್ನು ನಿರ್ವಹಿಸುವ ಫಂಡ್ ಹೌಸ್ ಅನ್ನು ಅವಲಂಬಿಸಿರುತ್ತದೆ. ಫಂಡ್ ಹೌಸ್ ತನ್ನ ಉದ್ದೇಶವನ್ನು ವಿಫಲಗೊಳಿಸಿದರೆ, ನಿಮ್ಮ ಹಣವನ್ನು ನೀವು ಕಳೆದುಕೊಳ್ಳುತ್ತೀರಿ. ನೀವು ಉತ್ತಮ SIP ಯೋಜನೆಯನ್ನು ಹೊಂದಿರುವಿರಾ ಎಂದು ಖಚಿತಪಡಿಸಿಕೊಳ್ಳಲು ಸುಪ್ರಸಿದ್ಧ ಫಂಡ್ ಹೌಸ್ ಅನ್ನು ಆಯ್ಕೆಮಾಡಿ.
SIP ಮ್ಯೂಚುಯಲ್ ಫಂಡ್ನ ನಿಧಿಯ ಕಾರ್ಯಕ್ಷಮತೆಯನ್ನು ಮೇಲ್ವಿಚಾರಣೆ ಮಾಡಿ
ಜನರು ಇದಕ್ಕೆ ಕಾರಣವಾಗಿರುವ ಮೂಲಭೂತ ಕಾರಣಗಳಲ್ಲಿ ಒಂದಾಗಿದೆಮ್ಯೂಚುವಲ್ ಫಂಡ್ಗಳಲ್ಲಿ ಹೂಡಿಕೆ ಮಾಡಿ SIP ಮೂಲಕ ಹಣ ಗಳಿಸುವುದು. ಆದ್ದರಿಂದ, ಉತ್ತಮ ನಿಧಿಯನ್ನು ಆಯ್ಕೆ ಮಾಡಲು ಮತ್ತು ನಂತರ ಉತ್ತಮ SIP ಯೋಜನೆಗಳಲ್ಲಿ ಹೂಡಿಕೆ ಮಾಡಲು ಸಮಯದ ಅವಧಿಯಲ್ಲಿ ನಿಧಿಗಳ ಕಾರ್ಯಕ್ಷಮತೆಯನ್ನು ವಿಶ್ಲೇಷಿಸುವುದು ಮುಖ್ಯವಾಗಿದೆ. ವಿಶಿಷ್ಟವಾಗಿ, ಈಕ್ವಿಟಿಗಾಗಿ ಮ್ಯೂಚುಯಲ್ ಫಂಡ್ಗಳ ದೀರ್ಘಾವಧಿಯ ಕಾರ್ಯಕ್ಷಮತೆಯನ್ನು ನೋಡಲಾಗುತ್ತದೆ, ಆದರೆ ಸಾಲಕ್ಕಾಗಿ ಮ್ಯೂಚುಯಲ್ ಫಂಡ್ಗಳು ಸಣ್ಣದಿಂದ ಮಧ್ಯಾವಧಿಯ ಆದಾಯವನ್ನು ಪರಿಗಣಿಸಲಾಗುತ್ತದೆ.
SIP ಯ ಲೋಡ್ಗಳು ಮತ್ತು ಮರುಕಳಿಸುವ ವೆಚ್ಚಗಳನ್ನು ವಿಶ್ಲೇಷಿಸಿ
ಕೊನೆಯದಾಗಿ ಆದರೆ ಕನಿಷ್ಠವಲ್ಲ, ನಿಗದಿತ ಅವಧಿಯ ಮೊದಲು (ಸಾಮಾನ್ಯವಾಗಿ ಲಾಕ್-ಇನ್ ಅವಧಿ ಎಂದು ಕರೆಯಲಾಗುತ್ತದೆ) ಹೂಡಿಕೆಯಲ್ಲಿ ಹೂಡಿಕೆಯನ್ನು ರಿಡೀಮ್ ಮಾಡಿದರೆ ನಿರ್ಗಮನ ಲೋಡ್ ಮತ್ತು ವೆಚ್ಚದ ಅನುಪಾತ.
ಆದ್ದರಿಂದ, ಈ ನಿಯತಾಂಕಗಳನ್ನು ಮನಸ್ಸಿನಲ್ಲಿಟ್ಟುಕೊಂಡು ಅತ್ಯುತ್ತಮ SIP ಯೋಜನೆಗಳನ್ನು ಆಯ್ಕೆ ಮಾಡಲು ಸಲಹೆ ನೀಡಲಾಗುತ್ತದೆ. ನೀವು ಹೂಡಿಕೆ ಮಾಡುವ ಮೊದಲು ಯೋಚಿಸಿ!
SIP ಕ್ಯಾಲ್ಕುಲೇಟರ್ (SIP ರಿಟರ್ನ್ ಕ್ಯಾಲ್ಕುಲೇಟರ್)
ಫಾರ್ಹಣಕಾಸಿನ ಯೋಜನೆ, SIP ಕ್ಯಾಲ್ಕುಲೇಟರ್ ಅಥವಾ SIP ರಿಟರ್ನ್ ಕ್ಯಾಲ್ಕುಲೇಟರ್ ಅತ್ಯುತ್ತಮ ಸಾಧನಗಳಲ್ಲಿ ಒಂದಾಗಿದೆ.
ಸಂಯೋಜನೆಯ ಶಕ್ತಿಯ ಮೂಲಕ ನಿಮ್ಮ SIP ಹೇಗೆ ಬೆಳೆಯುತ್ತದೆ ಎಂಬುದನ್ನು ಮೇಲ್ವಿಚಾರಣೆ ಮಾಡಲು ಕೆಳಗಿನ ಉದಾಹರಣೆಯನ್ನು ಪರಿಗಣಿಸಿ.
| ಮಾಸಿಕ ಹೂಡಿಕೆ | ಹೂಡಿಕೆಯ ಅವಧಿ | ಹೂಡಿಕೆ ಮಾಡಿದ ಒಟ್ಟು ಮೊತ್ತ | ಅಂತಿಮ ಮೌಲ್ಯ @ 14% p.a. |
|---|---|---|---|
| 1,000 | 5 ವರ್ಷಗಳು | 60,000 | 87,200 |
| 1,000 | 10 ವರ್ಷಗಳು | 1,20,000 | 2,62,091 |
| 1,000 | 15 ವರ್ಷಗಳು | 1,80,000 | 6,12,853 |
SIP ಮ್ಯೂಚುಯಲ್ ಫಂಡ್ನಲ್ಲಿ ನೀವು ತಿಂಗಳಿಗೆ INR 1,000 ಹೂಡಿಕೆ ಮಾಡಿದರೆ, 5 ವರ್ಷಗಳಲ್ಲಿ ನಿಮ್ಮ ಒಟ್ಟು ಹೂಡಿಕೆ INR 60,000 ಆಗಿರುತ್ತದೆ ಮತ್ತು ನಿಮ್ಮ SIP ಆದಾಯವು 14% p.a ಯ ಊಹೆಯ ರಿಟರ್ನ್ ಶೇಕಡಾವಾರು ಎಂದು ಮೇಲಿನ ಕೋಷ್ಟಕವು ಉಲ್ಲೇಖಿಸುತ್ತದೆ. ಆಗಿರುತ್ತದೆINR 87,2001, ಕ್ರಮವಾಗಿ. ಅದೇ ರೀತಿ, 10 ವರ್ಷಗಳಲ್ಲಿ ಒಟ್ಟು ಹೂಡಿಕೆಯಾಗಲಿದೆINR 1,20,000 ಮತ್ತು SIP ರಿಟರ್ನ್ 14% p.a ಎಂದು ಭಾವಿಸಲಾದ ಶೇಕಡಾವಾರು. ಆಗಿರುತ್ತದೆINR 2,62,091.
ಅದೇ ರೀತಿಯಲ್ಲಿ, 15 ವರ್ಷಗಳಲ್ಲಿ ಹೂಡಿಕೆ ಇರುತ್ತದೆINR 1,80,000 ಮತ್ತು 14% p.a ರಿಟರ್ನ್ ಶೇಕಡಾವಾರು ಅಂತಿಮ ಮೌಲ್ಯವು ಆಗಿರುತ್ತದೆINR 6,12,853, ಕ್ರಮವಾಗಿ.
ಆದ್ದರಿಂದ, ಕೇವಲ ಒಂದು ತಿಂಗಳಲ್ಲಿ INR 1,000 ಹೂಡಿಕೆ ಮಾಡುವ ಮೂಲಕ, ಮುಂದಿನ ವರ್ಷಗಳಲ್ಲಿ ನಿಮ್ಮ ಹಣವು ಹೇಗೆ ಬೆಳೆಯುತ್ತದೆ ಎಂಬುದನ್ನು ನೋಡಿ. ಹೂಡಿಕೆ ಮಾಡಲು ಉತ್ತಮ SIP ಮ್ಯೂಚುಯಲ್ ಫಂಡ್ ಅನ್ನು ಆಯ್ಕೆಮಾಡುವಾಗ ಮೇಲಿನ ಲೆಕ್ಕಾಚಾರಗಳನ್ನು ಪರಿಗಣಿಸಿ.
FAQ ಗಳು
1. SIP ಎಂದರೇನು?
ಉ: SIP ಅಥವಾ ವ್ಯವಸ್ಥಿತ ಹೂಡಿಕೆ ಯೋಜನೆಯು ಮ್ಯೂಚುಯಲ್ ಫಂಡ್ ಯೋಜನೆಯ ಅಡಿಯಲ್ಲಿ ನೀಡಲಾಗುವ ಹೂಡಿಕೆಯ ಮಾರ್ಗವಾಗಿದೆ, ಅಲ್ಲಿ ನಿಯಮಿತ ಮಧ್ಯಂತರದಲ್ಲಿ ಯೋಜನೆಯ ಅಡಿಯಲ್ಲಿ ನಿರ್ದಿಷ್ಟ ಮೊತ್ತವನ್ನು ಹೂಡಿಕೆ ಮಾಡಲಾಗುತ್ತದೆ. ಈ ಕಂತು 500 ರೂ.
2. SIP ನ ಪ್ರಯೋಜನಗಳು ಯಾವುವು?
ಉ: SIP ಯ ಪ್ರಾಥಮಿಕ ಪ್ರಯೋಜನವೆಂದರೆ ಅದು ಹೂಡಿಕೆಗಳನ್ನು ಹೆಚ್ಚು ಶಿಸ್ತುಬದ್ಧಗೊಳಿಸುತ್ತದೆ. ಇದು ಹೂಡಿಕೆದಾರರಿಗೆ ಮಾಡಲು ಅನುಮತಿಸುತ್ತದೆಹಣಕಾಸು ಯೋಜನೆ ಉಪಯುಕ್ತ ಮತ್ತು ಹೂಡಿಕೆದಾರರಿಗೆ ಹೂಡಿಕೆದಾರರಲ್ಲಿ ಹೂಡಿಕೆ ಮಾಡುವ ಅಭ್ಯಾಸವನ್ನು ಅಭಿವೃದ್ಧಿಪಡಿಸಲು ಸಹಾಯ ಮಾಡುತ್ತದೆ.
3. SIP ನಲ್ಲಿ ಯಾರು ಹೂಡಿಕೆ ಮಾಡಬಹುದು?
ಉ: SIP ನಲ್ಲಿ ಯಾರು ಬೇಕಾದರೂ ಹೂಡಿಕೆ ಮಾಡಬಹುದು. ಆದರೆ, ನಿಮ್ಮ ಅಪಾಯದ ವಿಶ್ಲೇಷಣೆಯನ್ನು ನೀವು ಮಾಡಬೇಕು, ನೀವು ಎಷ್ಟು ಅಪಾಯವನ್ನು ತೆಗೆದುಕೊಳ್ಳಲು ಬಯಸುತ್ತೀರಿ ಎಂದರ್ಥ. ಅಲ್ಲದೆ, ಪ್ರಾರಂಭಿಸಲು, ನಿಮಗೆ PAN ವಿವರಗಳು, ವಿಳಾಸ ಪುರಾವೆ ಮತ್ತು ಅಗತ್ಯವಿದೆಬ್ಯಾಂಕ್ ವಿವರಗಳು.
4. ಆಫ್ಲೈನ್ ಮೋಡ್ನಲ್ಲಿ SIP ನಲ್ಲಿ ಹೂಡಿಕೆ ಮಾಡಲು ಹಂತಗಳು ಯಾವುವು?
ಉ: ಆಫ್ಲೈನ್ ಮೋಡ್ನಲ್ಲಿ ಹೂಡಿಕೆ ಮಾಡಲು, ನೀವು ಅರ್ಜಿ ನಮೂನೆಯನ್ನು ಭರ್ತಿ ಮಾಡಬೇಕು, ಮಾಸಿಕ ಅಥವಾ ತ್ರೈಮಾಸಿಕ SIP ಮೊತ್ತದ ಚೆಕ್ ಅನ್ನು ಸಲ್ಲಿಸಬೇಕು, ನಕಲನ್ನು ಒದಗಿಸಬೇಕುಪ್ಯಾನ್ ಕಾರ್ಡ್, ವಿಳಾಸ ಪುರಾವೆ ಮತ್ತು ನಿಮ್ಮ ಬ್ಯಾಂಕ್ ವಿವರಗಳ ಪುರಾವೆಯಾಗಿ ರದ್ದುಗೊಂಡ ಚೆಕ್.
5. ICICI ಪ್ರುಡೆನ್ಶಿಯಲ್ ಟೆಕ್ನಾಲಜಿ ಫಂಡ್ನಲ್ಲಿ ನಾನು ಏಕೆ ಹೂಡಿಕೆ ಮಾಡಬೇಕು?
ಉ: ICICI ಪ್ರುಡೆನ್ಶಿಯಲ್ ಟೆಕ್ನಾಲಜಿ ಫಂಡ್ 3ನೇ ಮಾರ್ಚ್ 2000 ರಂದು ಪ್ರಾರಂಭವಾದಾಗಿನಿಂದ 11.9% ನಷ್ಟು ಆದಾಯವನ್ನು ತೋರಿಸಿದೆ. ಇತರ ಫಂಡ್ಗಳಿಗಿಂತ ಭಿನ್ನವಾಗಿ, 2020 ರಲ್ಲಿ, ಇದು 70.6% ನಷ್ಟು ಆದಾಯವನ್ನು ಸ್ಥಾಪಿಸಿದೆ. ಆದ್ದರಿಂದ, ಐಸಿಐಸಿಐ ಪ್ರುಡೆನ್ಶಿಯಲ್ ಟೆಕ್ನಾಲಜಿ ಫಂಡ್ನಲ್ಲಿ ಹೂಡಿಕೆ ಮಾಡುವುದು ಯೋಗ್ಯವಾಗಿದೆ ಮತ್ತು ಐದು ವರ್ಷಗಳ ಕಾಲ SIP ನಲ್ಲಿ ಹೂಡಿಕೆ ಮಾಡಿದೆ.
6. ನಾನು SBI ಬ್ಲೂಚಿಪ್ ಫಂಡ್ ನಿಯಮಿತ ಬೆಳವಣಿಗೆಯಲ್ಲಿ ಏಕೆ ಹೂಡಿಕೆ ಮಾಡಬೇಕು?
ಉ: ಎಸ್ಬಿಐ ಬ್ಲೂಚಿಪ್ ಫಂಡ್ ನಿಯಮಿತ ಬೆಳವಣಿಗೆಯು ಐದು ವರ್ಷಗಳ ಬೆಳವಣಿಗೆಯ ದರವನ್ನು ತೋರಿಸಿದೆ5.29%, ಇದು ತುಲನಾತ್ಮಕವಾಗಿ ಹೆಚ್ಚು.
7. SIP ನಲ್ಲಿ ಹೂಡಿಕೆ ಮಾಡುವಾಗ ನೀವು ಏನು ಪರಿಗಣಿಸಬೇಕು?
ಉ: ನೀವು SIP ನಲ್ಲಿ ಹೂಡಿಕೆ ಮಾಡುವಾಗ, ನೀವು ನಿವ್ವಳ ಆಸ್ತಿ ಮೌಲ್ಯ ಅಥವಾ ದಿಅವು ಅಲ್ಲ. ಯೋಜನೆಗಾಗಿ ನೀವು ಮಾಡುವ ಹೂಡಿಕೆ ಇದು. ನೀವು ಅದರ ರೇಟಿಂಗ್ಗಳು ಮತ್ತು ಅದರ ಐತಿಹಾಸಿಕ ಕಾರ್ಯಕ್ಷಮತೆಯನ್ನು ಸಹ ಪರಿಶೀಲಿಸಬೇಕು. ನಿಮ್ಮ ಹೂಡಿಕೆ ಸುರಕ್ಷಿತವಾಗಿದೆ ಎಂದು ಖಚಿತಪಡಿಸಿಕೊಳ್ಳಲು SIP ಉತ್ಪಾದಿಸುವ ಆದಾಯವನ್ನು ಅರ್ಥಮಾಡಿಕೊಳ್ಳುವುದು ಅತ್ಯಗತ್ಯ.
8. SIP ಗೆ KYC ಮುಖ್ಯವೇ?
ಉ: ಹೌದು, SIP ಗೆ ಸಹ KYC ಅತ್ಯಗತ್ಯ. SIP ಮ್ಯೂಚುಯಲ್ ಫಂಡ್ನ ಯೋಜನೆಯ ಅಡಿಯಲ್ಲಿ ಬರುವುದರಿಂದ, SIP ನಲ್ಲಿ ಹೂಡಿಕೆ ಮಾಡಲು ನೀವು KYC ದಾಖಲೆಗಳನ್ನು ಒದಗಿಸಬೇಕಾಗುತ್ತದೆ.
9. SIP ಗಳು ಕನಿಷ್ಠ ಹೂಡಿಕೆಯ ಅಗತ್ಯವನ್ನು ಹೊಂದಿದೆಯೇ?
ಉ: ಹೌದು, ಕೆಲವು SIP ಗಳಿಗೆ ಕನಿಷ್ಠ ಹೂಡಿಕೆಯ ಅಗತ್ಯವಿರುತ್ತದೆ. ಉದಾಹರಣೆಗೆ, ಆದಿತ್ಯ ಬಿರ್ಲಾ ಸನ್ ಲೈಫ್ ಡಿಜಿಟಲ್ ಇಂಡಿಯಾ ಫಂಡ್ ಕನಿಷ್ಠ ರೂ.1000 SIP ಹೂಡಿಕೆಯ ಅಗತ್ಯವನ್ನು ಹೊಂದಿದೆ. ಎಸ್ಬಿಐ ಬ್ಲೂಚಿಪ್ ಫಂಡ್ ನಿಯಮಿತ ಬೆಳವಣಿಗೆಗೆ ಕನಿಷ್ಠ ರೂ.5000 ಅಗತ್ಯವಿದೆ. ಹೀಗಾಗಿ, ನೀವು ಹೂಡಿಕೆ ಮಾಡುತ್ತಿರುವ SIP ಅನ್ನು ಅವಲಂಬಿಸಿ, ನಿಮ್ಮ ಹೂಡಿಕೆಯ ಮೊತ್ತವನ್ನು ನೀವು ಹೆಚ್ಚಿಸಬೇಕಾಗುತ್ತದೆ.
ಇಲ್ಲಿ ಒದಗಿಸಲಾದ ಮಾಹಿತಿಯು ನಿಖರವಾಗಿದೆ ಎಂದು ಖಚಿತಪಡಿಸಿಕೊಳ್ಳಲು ಎಲ್ಲಾ ಪ್ರಯತ್ನಗಳನ್ನು ಮಾಡಲಾಗಿದೆ. ಆದಾಗ್ಯೂ, ಡೇಟಾದ ನಿಖರತೆಯ ಬಗ್ಗೆ ಯಾವುದೇ ಗ್ಯಾರಂಟಿಗಳನ್ನು ನೀಡಲಾಗುವುದಿಲ್ಲ. ಯಾವುದೇ ಹೂಡಿಕೆ ಮಾಡುವ ಮೊದಲು ದಯವಿಟ್ಟು ಸ್ಕೀಮ್ ಮಾಹಿತಿ ದಾಖಲೆಯೊಂದಿಗೆ ಪರಿಶೀಲಿಸಿ.
You Might Also Like


What Is The Best Date For Sips And Does It Really Affect Returns?


Best Liquid Mutual Funds In 2026 - A Complete Investor Guide

When To Increase, Pause, Or Stop Your SIP? A Complete Guide Most Investors Ignore
 – Expert Buying Guide")
Best Smartphones Under ₹30,000 In India (2025) – Expert Buying Guide

E Filing Of Income Tax – A Complete Guide To File Income Tax Return
AMFI Registration No. 112358 | CIN: U74999MH2016PTC282153
Shepard Technologies Pvt. Ltd. (with ARN code 112358) makes no warranties or representations, express or implied, on products offered through the platform. It accepts no liability for any damages or losses, however caused, in connection with the use of, or on the reliance of its product or related services. Terms and conditions of the website are applicable.
©2026 Shepard Technologies Private Limited. All Rights Reserved
helpful to invest in SIP