മ്യൂച്വൽ ഫണ്ടുകളിലെ ലംപ് സം നിക്ഷേപം
നിങ്ങൾക്ക് ഒറ്റത്തവണ തുക നിക്ഷേപിക്കാമെന്ന് അറിയാമോമ്യൂച്വൽ ഫണ്ടുകൾ? ഉണ്ടെങ്കിൽ, അത് നല്ലതാണ്. എന്നിരുന്നാലും, ഇല്ലെങ്കിൽ, വിഷമിക്കേണ്ട. ഈ ലേഖനം അതേ വഴിയിലൂടെ നിങ്ങളെ നയിക്കും. ഒരു വ്യക്തി ഒറ്റത്തവണ മ്യൂച്വൽ ഫണ്ടുകളിൽ പണം നിക്ഷേപിക്കുന്ന സാഹചര്യത്തെയാണ് മ്യൂച്വൽ ഫണ്ടുകളിലെ ലംപ് സം നിക്ഷേപം സൂചിപ്പിക്കുന്നത്. ഇവിടെ പലതവണ നിക്ഷേപം നടക്കുന്നില്ല. തമ്മിൽ ഒരുപാട് വ്യത്യാസമുണ്ട്എസ്.ഐ.പി കൂടാതെ മൊത്തത്തിലുള്ള നിക്ഷേപ രീതിയും. അതിനാൽ, മ്യൂച്വൽ ഫണ്ടുകളിലെ ലംപ് സം നിക്ഷേപം എന്ന ആശയം നമുക്ക് മനസിലാക്കാം,മികച്ച മ്യൂച്വൽ ഫണ്ടുകൾ ഒറ്റത്തവണ നിക്ഷേപം, ലംപ് സം നിക്ഷേപ സമയത്ത് പരിഗണിക്കേണ്ട കാര്യങ്ങൾ, മ്യൂച്വൽ ഫണ്ട് ലംപ് സം റിട്ടേൺ കാൽക്കുലേറ്റർ, മറ്റ് അനുബന്ധ വശങ്ങൾ എന്നിവ ഈ ലേഖനത്തിലൂടെ.

മ്യൂച്വൽ ഫണ്ടുകളിലെ ലംപ് സം നിക്ഷേപം എന്നതുകൊണ്ട് നിങ്ങൾ എന്താണ് അർത്ഥമാക്കുന്നത്?
മ്യൂച്വൽ ഫണ്ടിലെ ലംപ് സം നിക്ഷേപം എന്നത് വ്യക്തികളുടെ ഒരു സാഹചര്യമാണ്മ്യൂച്വൽ ഫണ്ടുകളിൽ നിക്ഷേപിക്കുക ഒരിക്കൽ മാത്രം. എന്നിരുന്നാലും, വ്യക്തികൾ ചെറിയ തുകകൾ ലംപ് സം മോഡിൽ നിക്ഷേപിക്കുന്ന SIP രീതിക്ക് വിപരീതമായി, വ്യക്തികൾ ഗണ്യമായ തുക നിക്ഷേപിക്കുന്നു. മറ്റൊരു വിധത്തിൽ പറഞ്ഞാൽ, ഇത് ഒറ്റത്തവണ സാങ്കേതികതയാണ്നിക്ഷേപിക്കുന്നു മ്യൂച്വൽ ഫണ്ടുകളിൽ. അധിക ഫണ്ടുകളുള്ള നിക്ഷേപകർക്ക് അനുയോജ്യമായ നിക്ഷേപത്തിന്റെ മൊത്തത്തിലുള്ള നിക്ഷേപ രീതിബാങ്ക് അക്കൗണ്ട് കൂടാതെ കൂടുതൽ സമ്പാദിക്കാൻ ചാനലുകൾക്കായി നോക്കുന്നുവരുമാനം മ്യൂച്വൽ ഫണ്ടുകളിൽ നിക്ഷേപിക്കുന്നതിലൂടെ.
2022 - 2023 ലെ ലംപ് സം നിക്ഷേപത്തിനുള്ള മികച്ച മ്യൂച്വൽ ഫണ്ട്
ലംപ് സം മോഡിലൂടെ നിങ്ങൾ മ്യൂച്വൽ ഫണ്ടുകളിൽ നിക്ഷേപിക്കുന്നതിന് മുമ്പ്, വ്യക്തികൾ AUM, നിക്ഷേപ തുക എന്നിവയും അതിലേറെയും പോലുള്ള വിവിധ പാരാമീറ്ററുകൾ പരിഗണിക്കേണ്ടതുണ്ട്. അതിനാൽ, ഈ പാരാമീറ്ററുകളെ അടിസ്ഥാനമാക്കി ലംപ് സം നിക്ഷേപത്തിനുള്ള ചില മികച്ച മ്യൂച്വൽ ഫണ്ടുകൾ ഇനിപ്പറയുന്നവയാണ്.
ഇക്വിറ്റി മ്യൂച്വൽ ഫണ്ടുകളിലെ മികച്ച ലംപ് നിക്ഷേപം
ഇക്വിറ്റി ഫണ്ടുകൾ വിവിധ കമ്പനികളുടെ ഇക്വിറ്റി, ഇക്വിറ്റി സംബന്ധിയായ ഉപകരണങ്ങളിൽ അവരുടെ കോർപ്പസ് നിക്ഷേപിക്കുന്ന സ്കീമുകളാണ്. ദീർഘകാല നിക്ഷേപത്തിനുള്ള നല്ലൊരു ഓപ്ഷനായി ഈ സ്കീമുകൾ കണക്കാക്കപ്പെടുന്നു. വ്യക്തികൾക്ക് ഇക്വിറ്റി ഫണ്ടുകളിൽ മൊത്തത്തിലുള്ള തുക നിക്ഷേപിക്കാൻ കഴിയുമെങ്കിലും, ഇക്വിറ്റി ഫണ്ടുകളിൽ നിക്ഷേപിക്കുന്നതിനുള്ള ശുപാർശിത സാങ്കേതികത ഒന്നുകിൽ SIP വഴിയോ അല്ലെങ്കിൽസിസ്റ്റമാറ്റിക് ട്രാൻസ്ഫർ പ്ലാൻ (STP) മോഡ്. STP മോഡിൽ, വ്യക്തികൾ ആദ്യം ഗണ്യമായ പണം നിക്ഷേപിക്കുന്നുഡെറ്റ് ഫണ്ട് അതുപോലെലിക്വിഡ് ഫണ്ടുകൾ തുടർന്ന് ഇക്വിറ്റി ഫണ്ടുകളിൽ കൃത്യമായ ഇടവേളകളിൽ പണം കൈമാറ്റം ചെയ്യപ്പെടുന്നു. നിക്ഷേപത്തിനായി പരിഗണിക്കാവുന്ന ചില ഇക്വിറ്റി മ്യൂച്വൽ ഫണ്ടുകൾ ഇനിപ്പറയുന്നവയാണ്.
Fund NAV Net Assets (Cr) Min Investment 3 MO (%) 6 MO (%) 1 YR (%) 3 YR (%) 5 YR (%) 2025 (%) ICICI Prudential Infrastructure Fund Growth ₹204.61
↑ 0.29 ₹8,351 5,000 3.2 5.7 2.6 20.9 23.3 6.7 SBI PSU Fund Growth ₹34.3974
↓ -0.06 ₹6,594 5,000 -4.1 0.6 5.9 25.5 23 11.3 LIC MF Infrastructure Fund Growth ₹54.3117
↓ -0.12 ₹1,099 5,000 6.6 13.4 6.9 25.4 22.7 -3.7 DSP India T.I.G.E.R Fund Growth ₹361.563
↓ -0.05 ₹6,019 1,000 8 16.7 12.6 23.8 22.3 -2.5 Nippon India Power and Infra Fund Growth ₹381.085
↑ 0.60 ₹7,898 5,000 4.4 13.8 8.4 22.2 22.1 -0.5 Note: Returns up to 1 year are on absolute basis & more than 1 year are on CAGR basis. as on 16 Jul 26 Research Highlights & Commentary of 5 Funds showcased
Commentary ICICI Prudential Infrastructure Fund SBI PSU Fund LIC MF Infrastructure Fund DSP India T.I.G.E.R Fund Nippon India Power and Infra Fund Point 1 Highest AUM (₹8,351 Cr). Lower mid AUM (₹6,594 Cr). Bottom quartile AUM (₹1,099 Cr). Bottom quartile AUM (₹6,019 Cr). Upper mid AUM (₹7,898 Cr). Point 2 Established history (20+ yrs). Established history (16+ yrs). Established history (18+ yrs). Oldest track record among peers (22 yrs). Established history (22+ yrs). Point 3 Rating: 3★ (lower mid). Rating: 2★ (bottom quartile). Not Rated. Top rated. Rating: 4★ (upper mid). Point 4 Risk profile: High. Risk profile: High. Risk profile: High. Risk profile: High. Risk profile: High. Point 5 5Y return: 23.34% (top quartile). 5Y return: 23.01% (upper mid). 5Y return: 22.72% (lower mid). 5Y return: 22.32% (bottom quartile). 5Y return: 22.07% (bottom quartile). Point 6 3Y return: 20.93% (bottom quartile). 3Y return: 25.52% (top quartile). 3Y return: 25.41% (upper mid). 3Y return: 23.76% (lower mid). 3Y return: 22.20% (bottom quartile). Point 7 1Y return: 2.63% (bottom quartile). 1Y return: 5.94% (bottom quartile). 1Y return: 6.93% (lower mid). 1Y return: 12.64% (top quartile). 1Y return: 8.36% (upper mid). Point 8 Alpha: 0.00 (bottom quartile). Alpha: 0.16 (lower mid). Alpha: 4.51 (upper mid). Alpha: 0.00 (bottom quartile). Alpha: 6.45 (top quartile). Point 9 Sharpe: 0.00 (bottom quartile). Sharpe: 0.26 (bottom quartile). Sharpe: 0.26 (lower mid). Sharpe: 0.48 (top quartile). Sharpe: 0.35 (upper mid). Point 10 Information ratio: 0.00 (lower mid). Information ratio: -0.02 (bottom quartile). Information ratio: 0.55 (upper mid). Information ratio: 0.00 (bottom quartile). Information ratio: 0.63 (top quartile). ICICI Prudential Infrastructure Fund
SBI PSU Fund
LIC MF Infrastructure Fund
DSP India T.I.G.E.R Fund
Nippon India Power and Infra Fund
Talk to our investment specialist
ഡെറ്റ് മ്യൂച്വൽ ഫണ്ടുകളിലെ മികച്ച ലംപ് സം നിക്ഷേപം
ഡെറ്റ് ഫണ്ടുകൾ അവരുടെ ഫണ്ട് പണം വ്യത്യസ്തമായി നിക്ഷേപിക്കുന്നുസ്ഥിര വരുമാനം ട്രഷറി ബില്ലുകൾ, കോർപ്പറേറ്റ് തുടങ്ങിയ ഉപകരണങ്ങൾബോണ്ടുകൾ, അതോടൊപ്പം തന്നെ കുടുതല്. ഈ സ്കീമുകൾ ഹ്രസ്വ, ഇടത്തരം കാലയളവിനുള്ള ഒരു നല്ല ഓപ്ഷനായി കണക്കാക്കപ്പെടുന്നു. പല വ്യക്തികളും ഡെറ്റ് മ്യൂച്വൽ ഫണ്ടുകളിൽ ഒറ്റത്തവണ പണം നിക്ഷേപിക്കാൻ തിരഞ്ഞെടുക്കുന്നു. ചിലമികച്ച ഡെറ്റ് ഫണ്ടുകൾ ഒറ്റത്തവണ നിക്ഷേപത്തിനായി തിരഞ്ഞെടുക്കാവുന്നവ താഴെ പറയുന്നവയാണ്.
Fund NAV Net Assets (Cr) Min Investment 3 MO (%) 6 MO (%) 1 YR (%) 3 YR (%) 2025 (%) Debt Yield (YTM) Mod. Duration Eff. Maturity DSP Credit Risk Fund Growth ₹54.8304
↑ 0.05 ₹258 1,000 1.7 7.9 10 16 21 0% 2Y 3M 27D Aditya Birla Sun Life Credit Risk Fund Growth ₹25.1758
↑ 0.02 ₹1,391 1,000 2.2 4.5 11.9 12.2 13.4 8.4% 1Y 10M 13D 2Y 6M Franklin India Credit Risk Fund Growth ₹25.3348
↑ 0.04 ₹104 5,000 2.9 5 7.5 11 0% Aditya Birla Sun Life Medium Term Plan Growth ₹43.5415
↑ 0.04 ₹3,127 1,000 2.2 3.8 8.5 9.9 10.9 8.49% 2Y 10M 6D 3Y 10M 10D Franklin India Ultra Short Bond Fund - Super Institutional Plan Growth ₹34.9131
↑ 0.04 ₹297 10,000 1.3 5.9 13.7 8.8 0% 1Y 15D Note: Returns up to 1 year are on absolute basis & more than 1 year are on CAGR basis. as on 16 Jul 26 Research Highlights & Commentary of 5 Funds showcased
Commentary DSP Credit Risk Fund Aditya Birla Sun Life Credit Risk Fund Franklin India Credit Risk Fund Aditya Birla Sun Life Medium Term Plan Franklin India Ultra Short Bond Fund - Super Institutional Plan Point 1 Bottom quartile AUM (₹258 Cr). Upper mid AUM (₹1,391 Cr). Bottom quartile AUM (₹104 Cr). Highest AUM (₹3,127 Cr). Lower mid AUM (₹297 Cr). Point 2 Oldest track record among peers (23 yrs). Established history (11+ yrs). Established history (14+ yrs). Established history (17+ yrs). Established history (18+ yrs). Point 3 Top rated. Not Rated. Rating: 1★ (lower mid). Rating: 4★ (upper mid). Rating: 1★ (bottom quartile). Point 4 Risk profile: Moderate. Risk profile: Moderate. Risk profile: Moderate. Risk profile: Moderate. Risk profile: Moderate. Point 5 1Y return: 9.99% (lower mid). 1Y return: 11.93% (upper mid). 1Y return: 7.45% (bottom quartile). 1Y return: 8.51% (bottom quartile). 1Y return: 13.69% (top quartile). Point 6 1M return: 1.27% (top quartile). 1M return: 1.07% (upper mid). 1M return: 0.91% (bottom quartile). 1M return: 1.01% (lower mid). 1M return: 0.59% (bottom quartile). Point 7 Sharpe: 0.57 (bottom quartile). Sharpe: 1.60 (upper mid). Sharpe: 0.29 (bottom quartile). Sharpe: 0.70 (lower mid). Sharpe: 2.57 (top quartile). Point 8 Information ratio: 0.00 (top quartile). Information ratio: 0.00 (upper mid). Information ratio: 0.00 (lower mid). Information ratio: 0.00 (bottom quartile). Information ratio: 0.00 (bottom quartile). Point 9 Yield to maturity (debt): 0.00% (lower mid). Yield to maturity (debt): 8.40% (upper mid). Yield to maturity (debt): 0.00% (bottom quartile). Yield to maturity (debt): 8.49% (top quartile). Yield to maturity (debt): 0.00% (bottom quartile). Point 10 Modified duration: 2.33 yrs (bottom quartile). Modified duration: 1.87 yrs (lower mid). Modified duration: 0.00 yrs (top quartile). Modified duration: 2.85 yrs (bottom quartile). Modified duration: 0.00 yrs (upper mid). DSP Credit Risk Fund
Aditya Birla Sun Life Credit Risk Fund
Franklin India Credit Risk Fund
Aditya Birla Sun Life Medium Term Plan
Franklin India Ultra Short Bond Fund - Super Institutional Plan
ലംപ് സം നിക്ഷേപത്തിനുള്ള മികച്ച ഹൈബ്രിഡ് ഫണ്ടുകൾ
ഹൈബ്രിഡ് ഫണ്ടുകൾ എന്നും അറിയപ്പെടുന്നുബാലൻസ്ഡ് ഫണ്ട് ഇക്വിറ്റിയിലും സ്ഥിരവരുമാനത്തിലും അവരുടെ പണം നിക്ഷേപിക്കുക. ഈ സ്കീമുകൾ തിരയുന്ന വ്യക്തികൾക്ക് അനുയോജ്യമാണ്മൂലധനം സ്ഥിരവരുമാനത്തിനൊപ്പം തലമുറ. സമതുലിതമായ സ്കീമുകൾ എന്നും അറിയപ്പെടുന്നു, വ്യക്തികൾക്ക് ഹൈബ്രിഡ് സ്കീമുകളിൽ ഒറ്റത്തവണ തുക നിക്ഷേപിക്കാൻ തിരഞ്ഞെടുക്കാം. ഒറ്റത്തവണ നിക്ഷേപത്തിനുള്ള ഏറ്റവും മികച്ച ചില ഹൈബ്രിഡ് ഫണ്ടുകൾ ചുവടെ പട്ടികപ്പെടുത്തിയിരിക്കുന്നു.
Fund NAV Net Assets (Cr) Min Investment 3 MO (%) 6 MO (%) 1 YR (%) 3 YR (%) 5 YR (%) 2025 (%) BOI AXA Mid and Small Cap Equity and Debt Fund Growth ₹41.95
↓ -0.11 ₹1,482 5,000 6.6 11 7.8 18.6 14 -0.9 Sundaram Equity Hybrid Fund Growth ₹135.137
↑ 0.78 ₹1,954 5,000 0.5 10.5 27.1 16 14.2 SBI Multi Asset Allocation Fund Growth ₹66.6898
↑ 0.02 ₹18,290 5,000 1.4 0.7 10.7 15.8 13.2 18.6 ICICI Prudential Multi-Asset Fund Growth ₹809.607
↑ 2.28 ₹84,165 5,000 0.3 -1 6.4 15.7 17.1 18.6 ICICI Prudential Equity and Debt Fund Growth ₹406.49
↑ 0.15 ₹50,033 5,000 1.3 -0.2 3.2 15.4 16.4 13.3 Note: Returns up to 1 year are on absolute basis & more than 1 year are on CAGR basis. as on 16 Jul 26 Research Highlights & Commentary of 5 Funds showcased
Commentary BOI AXA Mid and Small Cap Equity and Debt Fund Sundaram Equity Hybrid Fund SBI Multi Asset Allocation Fund ICICI Prudential Multi-Asset Fund ICICI Prudential Equity and Debt Fund Point 1 Bottom quartile AUM (₹1,482 Cr). Bottom quartile AUM (₹1,954 Cr). Lower mid AUM (₹18,290 Cr). Highest AUM (₹84,165 Cr). Upper mid AUM (₹50,033 Cr). Point 2 Established history (9+ yrs). Oldest track record among peers (26 yrs). Established history (20+ yrs). Established history (23+ yrs). Established history (26+ yrs). Point 3 Not Rated. Rating: 2★ (lower mid). Top rated. Rating: 2★ (bottom quartile). Rating: 4★ (upper mid). Point 4 Risk profile: Moderately High. Risk profile: Moderately High. Risk profile: Moderate. Risk profile: Moderately High. Risk profile: Moderately High. Point 5 5Y return: 13.99% (bottom quartile). 5Y return: 14.20% (lower mid). 5Y return: 13.19% (bottom quartile). 5Y return: 17.06% (top quartile). 5Y return: 16.41% (upper mid). Point 6 3Y return: 18.63% (top quartile). 3Y return: 16.03% (upper mid). 3Y return: 15.76% (lower mid). 3Y return: 15.66% (bottom quartile). 3Y return: 15.39% (bottom quartile). Point 7 1Y return: 7.76% (lower mid). 1Y return: 27.10% (top quartile). 1Y return: 10.67% (upper mid). 1Y return: 6.40% (bottom quartile). 1Y return: 3.20% (bottom quartile). Point 8 1M return: 2.12% (top quartile). 1M return: 1.80% (upper mid). 1M return: 0.13% (bottom quartile). 1M return: 0.86% (bottom quartile). 1M return: 1.52% (lower mid). Point 9 Alpha: 0.00 (lower mid). Alpha: 5.81 (top quartile). Alpha: 0.00 (bottom quartile). Alpha: 0.00 (bottom quartile). Alpha: 1.75 (upper mid). Point 10 Sharpe: 0.50 (lower mid). Sharpe: 2.64 (top quartile). Sharpe: 0.78 (upper mid). Sharpe: 0.18 (bottom quartile). Sharpe: -0.21 (bottom quartile). BOI AXA Mid and Small Cap Equity and Debt Fund
Sundaram Equity Hybrid Fund
SBI Multi Asset Allocation Fund
ICICI Prudential Multi-Asset Fund
ICICI Prudential Equity and Debt Fund
ലംപ് സം നിക്ഷേപത്തിനുള്ള മികച്ച ഇൻഡെക്സ് ഫണ്ടുകൾ
ഒരു സൂചിക ഫണ്ടിന്റെ പോർട്ട്ഫോളിയോയിൽ ഓഹരികളും മറ്റ് ഉപകരണങ്ങളും സൂചികയിലുള്ള അതേ അനുപാതത്തിൽ അടങ്ങിയിരിക്കുന്നു. മറ്റൊരു വിധത്തിൽ പറഞ്ഞാൽ, ഈ സ്കീമുകൾ ഒരു സൂചികയുടെ പ്രകടനത്തെ അനുകരിക്കുന്നു. ഇവ നിഷ്ക്രിയമായി കൈകാര്യം ചെയ്യപ്പെടുന്ന ഫണ്ടുകളാണ്, ഒറ്റത്തവണ നിക്ഷേപത്തിനുള്ള നല്ലൊരു ഓപ്ഷനായി ഇതിനെ കണക്കാക്കാം. മികച്ച ചിലത്ഇൻഡെക്സ് ഫണ്ടുകൾ ഒറ്റത്തവണ നിക്ഷേപത്തിനായി തിരഞ്ഞെടുക്കാവുന്നവ താഴെ പറയുന്നവയാണ്.
Fund NAV Net Assets (Cr) 3 MO (%) 6 MO (%) 1 YR (%) 3 YR (%) 5 YR (%) 2025 (%) Nippon India Index Fund - Sensex Plan Growth ₹39.4561
↑ 0.00 ₹894 -0.6 -7.3 -6.1 6 8.4 9.8 LIC MF Index Fund Sensex Growth ₹144.441
↓ 0.00 ₹88 -0.7 -7.4 -6.6 5.4 7.9 9.1 Franklin India Index Fund Nifty Plan Growth ₹195.053
↓ -0.05 ₹713 -0.1 -6 -3.9 7.8 9.2 11.3 IDBI Nifty Index Fund Growth ₹36.2111
↓ -0.02 ₹208 9.1 11.9 16.2 20.3 11.7 Nippon India Index Fund - Nifty Plan Growth ₹41.068
↓ -0.01 ₹3,662 0 -5.9 -3.8 7.8 9.1 11.4 Note: Returns up to 1 year are on absolute basis & more than 1 year are on CAGR basis. as on 16 Jul 26 Research Highlights & Commentary of 5 Funds showcased
Commentary Nippon India Index Fund - Sensex Plan LIC MF Index Fund Sensex Franklin India Index Fund Nifty Plan IDBI Nifty Index Fund Nippon India Index Fund - Nifty Plan Point 1 Upper mid AUM (₹894 Cr). Bottom quartile AUM (₹88 Cr). Lower mid AUM (₹713 Cr). Bottom quartile AUM (₹208 Cr). Highest AUM (₹3,662 Cr). Point 2 Established history (15+ yrs). Established history (23+ yrs). Oldest track record among peers (25 yrs). Established history (16+ yrs). Established history (15+ yrs). Point 3 Top rated. Rating: 1★ (upper mid). Rating: 1★ (lower mid). Rating: 1★ (bottom quartile). Rating: 1★ (bottom quartile). Point 4 Risk profile: Moderately High. Risk profile: Moderately High. Risk profile: Moderately High. Risk profile: Moderately High. Risk profile: Moderately High. Point 5 5Y return: 8.39% (bottom quartile). 5Y return: 7.90% (bottom quartile). 5Y return: 9.15% (upper mid). 5Y return: 11.74% (top quartile). 5Y return: 9.13% (lower mid). Point 6 3Y return: 6.00% (bottom quartile). 3Y return: 5.41% (bottom quartile). 3Y return: 7.76% (lower mid). 3Y return: 20.28% (top quartile). 3Y return: 7.85% (upper mid). Point 7 1Y return: -6.09% (bottom quartile). 1Y return: -6.57% (bottom quartile). 1Y return: -3.93% (lower mid). 1Y return: 16.16% (top quartile). 1Y return: -3.84% (upper mid). Point 8 1M return: 0.78% (upper mid). 1M return: 0.74% (lower mid). 1M return: 0.62% (bottom quartile). 1M return: 3.68% (top quartile). 1M return: 0.62% (bottom quartile). Point 9 Alpha: -0.53 (upper mid). Alpha: -1.14 (bottom quartile). Alpha: -0.58 (lower mid). Alpha: -1.03 (bottom quartile). Alpha: -0.46 (top quartile). Point 10 Sharpe: -0.75 (bottom quartile). Sharpe: -0.79 (bottom quartile). Sharpe: -0.54 (lower mid). Sharpe: 1.04 (top quartile). Sharpe: -0.53 (upper mid). Nippon India Index Fund - Sensex Plan
LIC MF Index Fund Sensex
Franklin India Index Fund Nifty Plan
IDBI Nifty Index Fund
Nippon India Index Fund - Nifty Plan
കഴിഞ്ഞ ഒരു മാസത്തെ അടിസ്ഥാനമാക്കിയുള്ള മികച്ച മ്യൂച്വൽ ഫണ്ടുകൾ
(Erstwhile SBI Pharma Fund) To provide the investors maximum growth opportunity through equity
investments in stocks of growth oriented sectors of the economy. Below is the key information for SBI Healthcare Opportunities Fund Returns up to 1 year are on (Erstwhile UTI Pharma & Healthcare Fund) The Investment objective of the Scheme is capital appreciation through investments in equities and equity related instruments of the Pharma & Healthcare sectors. Research Highlights for UTI Healthcare Fund Below is the key information for UTI Healthcare Fund Returns up to 1 year are on The investment objective of the scheme is to seek long term capital appreciation by investing atleast 80% of its net assets in equity/equity related instruments of the companies in the pharma & healthcare sectors in India.However, there is no assurance or guarantee that the investment objective of the Scheme will be achieved.The Scheme does not assure or guarantee any returns. Research Highlights for TATA India Pharma & Healthcare Fund Below is the key information for TATA India Pharma & Healthcare Fund Returns up to 1 year are on The primary investment objective of the scheme is to seek to generate consistent returns by investing in equity and equity related or fixed income securities of Pharma and other associated companies. Research Highlights for Nippon India Pharma Fund Below is the key information for Nippon India Pharma Fund Returns up to 1 year are on (Erstwhile DSP BlackRock Micro Cap Fund) The primary investment objective is to seek to generate long term capital appreciation from a portfolio that is substantially constituted of equity and equity related securities of small cap companies. From time to time, the fund manager will also seek participation in other equity and equity related securities to achieve optimal portfolio construction. There is no assurance that the investment objective of the Scheme will be realized Research Highlights for DSP Small Cap Fund Below is the key information for DSP Small Cap Fund Returns up to 1 year are on 1. SBI Healthcare Opportunities Fund
SBI Healthcare Opportunities Fund
Growth Launch Date 31 Dec 04 NAV (15 Jul 26) ₹504.895 ↑ 3.16 (0.63 %) Net Assets (Cr) ₹4,566 on 31 May 26 Category Equity - Sectoral AMC SBI Funds Management Private Limited Rating ☆☆ Risk High Expense Ratio 1.97 Sharpe Ratio 0.36 Information Ratio -0.4 Alpha Ratio -0.04 Min Investment 5,000 Min SIP Investment 500 Exit Load 0-15 Days (0.5%),15 Days and above(NIL) Growth of 10,000 investment over the years.
Date Value 30 Jun 21 ₹10,000 30 Jun 22 ₹8,662 30 Jun 23 ₹11,165 30 Jun 24 ₹15,491 30 Jun 25 ₹18,739 30 Jun 26 ₹21,357 Returns for SBI Healthcare Opportunities Fund
absolute basis & more than 1 year are on CAGR (Compound Annual Growth Rate) basis. as on 15 Jul 26 Duration Returns 1 Month 7.5% 3 Month 18.1% 6 Month 19.9% 1 Year 14.8% 3 Year 23.8% 5 Year 16.6% 10 Year 15 Year Since launch 15.6% Historical performance (Yearly) on absolute basis
Year Returns 2025 -3.5% 2024 42.2% 2023 38.2% 2022 -6% 2021 20.1% 2020 65.8% 2019 -0.5% 2018 -9.9% 2017 2.1% 2016 -14% Fund Manager information for SBI Healthcare Opportunities Fund
Name Since Tenure Tanmaya Desai 1 Jun 11 15.09 Yr. Data below for SBI Healthcare Opportunities Fund as on 31 May 26
Equity Sector Allocation
Sector Value Health Care 88.67% Basic Materials 8.82% Asset Allocation
Asset Class Value Cash 2.45% Equity 97.49% Debt 0.06% Top Securities Holdings / Portfolio
Name Holding Value Quantity Sun Pharmaceuticals Industries Ltd (Healthcare)
Equity, Since 31 Dec 17 | SUNPHARMA11% ₹504 Cr 2,800,000 Divi's Laboratories Ltd (Healthcare)
Equity, Since 31 Mar 12 | DIVISLAB7% ₹300 Cr 450,000 Acutaas Chemicals Ltd (Basic Materials)
Equity, Since 30 Jun 24 | 5433496% ₹282 Cr 900,000 Apollo Hospitals Enterprise Ltd (Healthcare)
Equity, Since 31 Jan 26 | APOLLOHOSP5% ₹245 Cr 300,000 Max Healthcare Institute Ltd Ordinary Shares (Healthcare)
Equity, Since 31 Mar 21 | MAXHEALTH5% ₹217 Cr 2,250,000 Aurobindo Pharma Ltd (Healthcare)
Equity, Since 31 Mar 26 | AUROPHARMA4% ₹178 Cr 1,250,000
↑ 250,000 Aster DM Healthcare Ltd Ordinary Shares (Healthcare)
Equity, Since 31 Mar 24 | ASTERDM4% ₹175 Cr 2,400,000 Laurus Labs Ltd (Healthcare)
Equity, Since 31 Aug 23 | LAURUSLABS4% ₹163 Cr 1,200,000 Biocon Ltd (Healthcare)
Equity, Since 30 Nov 24 | BIOCON4% ₹161 Cr 3,750,000 Torrent Pharmaceuticals Ltd (Healthcare)
Equity, Since 30 Jun 21 | TORNTPHARM3% ₹159 Cr 360,000 2. UTI Healthcare Fund
UTI Healthcare Fund
Growth Launch Date 28 Jun 99 NAV (16 Jul 26) ₹335.106 ↑ 1.17 (0.35 %) Net Assets (Cr) ₹1,217 on 31 May 26 Category Equity - Sectoral AMC UTI Asset Management Company Ltd Rating ☆ Risk High Expense Ratio 2.26 Sharpe Ratio 0.42 Information Ratio 0.08 Alpha Ratio 0.91 Min Investment 5,000 Min SIP Investment 500 Exit Load 0-1 Years (1%),1 Years and above(NIL) Growth of 10,000 investment over the years.
Date Value 30 Jun 21 ₹10,000 30 Jun 22 ₹8,478 30 Jun 23 ₹10,006 30 Jun 24 ₹14,264 30 Jun 25 ₹17,337 30 Jun 26 ₹19,764 Returns for UTI Healthcare Fund
absolute basis & more than 1 year are on CAGR (Compound Annual Growth Rate) basis. as on 15 Jul 26 Duration Returns 1 Month 7.4% 3 Month 18% 6 Month 20.7% 1 Year 13.4% 3 Year 26% 5 Year 14.5% 10 Year 15 Year Since launch 15% Historical performance (Yearly) on absolute basis
Year Returns 2025 -3.1% 2024 42.9% 2023 38.2% 2022 -12.3% 2021 19.1% 2020 67.4% 2019 1.2% 2018 -7.5% 2017 6.2% 2016 -9.7% Fund Manager information for UTI Healthcare Fund
Name Since Tenure Kamal Gada 2 May 22 4.17 Yr. Data below for UTI Healthcare Fund as on 31 May 26
Equity Sector Allocation
Sector Value Health Care 94.45% Asset Allocation
Asset Class Value Cash 5.55% Equity 94.45% Top Securities Holdings / Portfolio
Name Holding Value Quantity Sun Pharmaceuticals Industries Ltd (Healthcare)
Equity, Since 31 Oct 06 | SUNPHARMA9% ₹108 Cr 600,000 Divi's Laboratories Ltd (Healthcare)
Equity, Since 30 Sep 17 | DIVISLAB5% ₹59 Cr 88,814
↑ 28,076 Ajanta Pharma Ltd (Healthcare)
Equity, Since 31 Jul 17 | AJANTPHARM5% ₹57 Cr 195,295
↓ -41,216 Gland Pharma Ltd (Healthcare)
Equity, Since 30 Nov 20 | GLAND4% ₹48 Cr 215,251 Lupin Ltd (Healthcare)
Equity, Since 28 Feb 25 | LUPIN4% ₹46 Cr 203,834
↓ -6,166 Apollo Hospitals Enterprise Ltd (Healthcare)
Equity, Since 30 Apr 21 | APOLLOHOSP4% ₹43 Cr 53,000 Dr Reddy's Laboratories Ltd (Healthcare)
Equity, Since 28 Feb 18 | DRREDDY3% ₹38 Cr 290,000 Caplin Point Laboratories Ltd (Healthcare)
Equity, Since 31 Dec 23 | CAPLIPOINT3% ₹37 Cr 185,000
↑ 39,847 Alkem Laboratories Ltd (Healthcare)
Equity, Since 31 May 21 | ALKEM3% ₹37 Cr 68,000 Fortis Healthcare Ltd (Healthcare)
Equity, Since 31 Dec 20 | FORTIS3% ₹37 Cr 400,000 3. TATA India Pharma & Healthcare Fund
TATA India Pharma & Healthcare Fund
Growth Launch Date 28 Dec 15 NAV (16 Jul 26) ₹33.3324 ↑ 0.09 (0.27 %) Net Assets (Cr) ₹1,387 on 31 May 26 Category Equity - Sectoral AMC Tata Asset Management Limited Rating Risk High Expense Ratio 2.17 Sharpe Ratio 0.14 Information Ratio -0.62 Alpha Ratio -7.02 Min Investment 5,000 Min SIP Investment 150 Exit Load 0-3 Months (0.25%),3 Months and above(NIL) Growth of 10,000 investment over the years.
Date Value 30 Jun 21 ₹10,000 30 Jun 22 ₹8,951 30 Jun 23 ₹10,628 30 Jun 24 ₹15,238 30 Jun 25 ₹17,550 30 Jun 26 ₹18,791 Returns for TATA India Pharma & Healthcare Fund
absolute basis & more than 1 year are on CAGR (Compound Annual Growth Rate) basis. as on 15 Jul 26 Duration Returns 1 Month 6.2% 3 Month 13.6% 6 Month 12.1% 1 Year 7.8% 3 Year 21.4% 5 Year 13.3% 10 Year 15 Year Since launch 12.1% Historical performance (Yearly) on absolute basis
Year Returns 2025 -4.9% 2024 40.4% 2023 36.6% 2022 -8% 2021 19.1% 2020 64.4% 2019 5.5% 2018 -2.6% 2017 4.7% 2016 -14.7% Fund Manager information for TATA India Pharma & Healthcare Fund
Name Since Tenure Rajat Srivastava 16 Sep 24 1.79 Yr. Data below for TATA India Pharma & Healthcare Fund as on 31 May 26
Equity Sector Allocation
Sector Value Health Care 93.6% Basic Materials 3.96% Consumer Defensive 1.35% Financial Services 0.4% Asset Allocation
Asset Class Value Cash 0.7% Equity 99.3% Top Securities Holdings / Portfolio
Name Holding Value Quantity Sun Pharmaceuticals Industries Ltd (Healthcare)
Equity, Since 31 Jan 16 | SUNPHARMA9% ₹130 Cr 723,130 HealthCare Global Enterprises Ltd (Healthcare)
Equity, Since 31 Dec 18 | HCG6% ₹81 Cr 1,276,727
↑ 15,000 Divi's Laboratories Ltd (Healthcare)
Equity, Since 30 Sep 17 | DIVISLAB6% ₹80 Cr 120,600 Abbott India Ltd (Healthcare)
Equity, Since 30 Sep 25 | ABBOTINDIA5% ₹75 Cr 27,953 Cipla Ltd (Healthcare)
Equity, Since 30 Apr 20 | CIPLA5% ₹72 Cr 512,754 Max Healthcare Institute Ltd Ordinary Shares (Healthcare)
Equity, Since 31 Jul 25 | MAXHEALTH5% ₹67 Cr 690,488 Apollo Hospitals Enterprise Ltd (Healthcare)
Equity, Since 31 Dec 16 | APOLLOHOSP5% ₹63 Cr 77,345
↑ 6,861 Rainbow Childrens Medicare Ltd (Healthcare)
Equity, Since 31 Jul 25 | 5435245% ₹63 Cr 454,338
↑ 7,205 Dr Reddy's Laboratories Ltd (Healthcare)
Equity, Since 31 Aug 18 | DRREDDY4% ₹56 Cr 428,116
↑ 54,652 Mankind Pharma Ltd (Healthcare)
Equity, Since 30 Apr 23 | MANKIND4% ₹52 Cr 220,018 4. Nippon India Pharma Fund
Nippon India Pharma Fund
Growth Launch Date 5 Jun 04 NAV (16 Jul 26) ₹567.354 ↑ 1.29 (0.23 %) Net Assets (Cr) ₹8,636 on 31 May 26 Category Equity - Sectoral AMC Nippon Life Asset Management Ltd. Rating ☆☆ Risk High Expense Ratio 1.81 Sharpe Ratio 0.07 Information Ratio -0.93 Alpha Ratio -3.9 Min Investment 5,000 Min SIP Investment 100 Exit Load 0-1 Years (1%),1 Years and above(NIL) Growth of 10,000 investment over the years.
Date Value 30 Jun 21 ₹10,000 30 Jun 22 ₹8,540 30 Jun 23 ₹10,376 30 Jun 24 ₹14,608 30 Jun 25 ₹16,993 30 Jun 26 ₹18,254 Returns for Nippon India Pharma Fund
absolute basis & more than 1 year are on CAGR (Compound Annual Growth Rate) basis. as on 15 Jul 26 Duration Returns 1 Month 5.9% 3 Month 12.8% 6 Month 13.3% 1 Year 8.1% 3 Year 20.5% 5 Year 12.6% 10 Year 15 Year Since launch 20% Historical performance (Yearly) on absolute basis
Year Returns 2025 -3.3% 2024 34% 2023 39.2% 2022 -9.9% 2021 23.9% 2020 66.4% 2019 1.7% 2018 3.6% 2017 7.6% 2016 -10.6% Fund Manager information for Nippon India Pharma Fund
Name Since Tenure Sailesh Raj Bhan 1 Apr 05 21.26 Yr. Kinjal Desai 25 May 18 8.11 Yr. Amber Singhania 11 Mar 26 0.31 Yr. Data below for Nippon India Pharma Fund as on 31 May 26
Equity Sector Allocation
Sector Value Health Care 97.92% Asset Allocation
Asset Class Value Cash 2.08% Equity 97.92% Top Securities Holdings / Portfolio
Name Holding Value Quantity Sun Pharmaceuticals Industries Ltd (Healthcare)
Equity, Since 31 Oct 09 | SUNPHARMA13% ₹1,153 Cr 6,406,349 Lupin Ltd (Healthcare)
Equity, Since 31 Aug 08 | LUPIN7% ₹631 Cr 2,783,991
↓ -100,000 Dr Reddy's Laboratories Ltd (Healthcare)
Equity, Since 30 Jun 11 | DRREDDY7% ₹580 Cr 4,449,746 Cipla Ltd (Healthcare)
Equity, Since 31 May 08 | CIPLA6% ₹532 Cr 3,795,054
↑ 300,000 Divi's Laboratories Ltd (Healthcare)
Equity, Since 31 Mar 12 | DIVISLAB6% ₹501 Cr 750,754
↓ -100,000 Apollo Hospitals Enterprise Ltd (Healthcare)
Equity, Since 30 Sep 20 | APOLLOHOSP5% ₹449 Cr 548,795 Mankind Pharma Ltd (Healthcare)
Equity, Since 30 Apr 23 | MANKIND4% ₹340 Cr 1,431,195
↑ 300,000 Medplus Health Services Ltd (Healthcare)
Equity, Since 30 Nov 22 | MEDPLUS4% ₹317 Cr 3,545,229
↓ -82,048 Sai Life Sciences Ltd (Healthcare)
Equity, Since 31 Dec 24 | SAILIFE3% ₹296 Cr 2,555,745 Ajanta Pharma Ltd (Healthcare)
Equity, Since 30 Apr 22 | AJANTPHARM3% ₹277 Cr 946,323 5. DSP Small Cap Fund
DSP Small Cap Fund
Growth Launch Date 14 Jun 07 NAV (16 Jul 26) ₹223.022 ↓ -0.10 (-0.04 %) Net Assets (Cr) ₹18,358 on 31 May 26 Category Equity - Small Cap AMC DSP BlackRock Invmt Managers Pvt. Ltd. Rating ☆☆☆☆ Risk Moderately High Expense Ratio 1.72 Sharpe Ratio 0.13 Information Ratio 0 Alpha Ratio 0 Min Investment 1,000 Min SIP Investment 500 Exit Load 0-12 Months (1%),12 Months and above(NIL) Growth of 10,000 investment over the years.
Date Value 30 Jun 21 ₹10,000 30 Jun 22 ₹10,594 30 Jun 23 ₹13,804 30 Jun 24 ₹19,548 30 Jun 25 ₹21,421 30 Jun 26 ₹23,103 Returns for DSP Small Cap Fund
absolute basis & more than 1 year are on CAGR (Compound Annual Growth Rate) basis. as on 15 Jul 26 Duration Returns 1 Month 5.6% 3 Month 11.8% 6 Month 16.6% 1 Year 9.1% 3 Year 18.7% 5 Year 17.3% 10 Year 15 Year Since launch 17.7% Historical performance (Yearly) on absolute basis
Year Returns 2025 -2.8% 2024 25.6% 2023 41.2% 2022 0.5% 2021 58.9% 2020 33.1% 2019 0.7% 2018 -25.5% 2017 42.8% 2016 12.7% Fund Manager information for DSP Small Cap Fund
Name Since Tenure Vinit Sambre 21 Jun 10 16.04 Yr. Data below for DSP Small Cap Fund as on 31 May 26
Equity Sector Allocation
Sector Value Consumer Cyclical 31.79% Industrials 16.23% Basic Materials 15.28% Health Care 9.25% Financial Services 8.24% Consumer Defensive 6.15% Technology 2.11% Communication Services 0.44% Asset Allocation
Asset Class Value Cash 10.5% Equity 89.5% Top Securities Holdings / Portfolio
Name Holding Value Quantity Lumax Auto Technologies Ltd (Consumer Cyclical)
Equity, Since 30 Jun 18 | LUMAXTECH5% ₹921 Cr 5,337,441
↓ -600,000 Kirloskar Oil Engines Ltd (Industrials)
Equity, Since 31 Mar 23 | 5332934% ₹725 Cr 3,762,866 Thangamayil Jewellery Ltd (Consumer Cyclical)
Equity, Since 30 Nov 21 | THANGAMAYL3% ₹628 Cr 1,493,620
↓ -91,335 Sansera Engineering Ltd (Consumer Cyclical)
Equity, Since 30 Jun 24 | SANSERA3% ₹506 Cr 1,770,029 Welspun Corp Ltd (Basic Materials)
Equity, Since 31 Mar 21 | WELCORP3% ₹470 Cr 3,411,788
↓ -343,883 Jubilant Ingrevia Ltd Ordinary Shares (Basic Materials)
Equity, Since 31 Dec 22 | JUBLINGREA2% ₹450 Cr 6,970,677
↓ -29,323 Dodla Dairy Ltd (Consumer Defensive)
Equity, Since 30 Jun 21 | DODLA2% ₹405 Cr 3,750,000 LT Foods Ltd (Consumer Defensive)
Equity, Since 31 Dec 17 | LTFOODS2% ₹392 Cr 10,000,000 SPR Auto Technologies Ltd (Consumer Cyclical)
Equity, Since 31 Aug 24 | SHRIPISTON2% ₹367 Cr 1,081,165 eClerx Services Ltd (Technology)
Equity, Since 28 Feb 18 | ECLERX2% ₹334 Cr 2,211,836
ഒറ്റത്തവണ നിക്ഷേപം നടത്തുമ്പോൾ ശ്രദ്ധിക്കേണ്ട കാര്യങ്ങൾ
മ്യൂച്വൽ ഫണ്ടുകളിൽ നിക്ഷേപിക്കുന്നതിന് മുമ്പ് വ്യക്തികൾ ധാരാളം പാരാമീറ്ററുകൾ ശ്രദ്ധിക്കേണ്ടതുണ്ട്. ഇതിൽ ഉൾപ്പെടുന്നു:
മാർക്കറ്റ് സമയം
ഒറ്റത്തവണ നിക്ഷേപത്തിന്റെ കാര്യം വരുമ്പോൾ, വ്യക്തികൾ എപ്പോഴും അന്വേഷിക്കേണ്ടതുണ്ട്വിപണി പ്രത്യേകിച്ച് ഇക്വിറ്റി അധിഷ്ഠിത ഫണ്ടുകളുമായി ബന്ധപ്പെട്ട സമയങ്ങൾ. ഒറ്റത്തവണ നിക്ഷേപം നടത്താനുള്ള നല്ല സമയമാണ് വിപണികൾ താഴ്ന്നതും ഉടൻ തന്നെ അവർ വിലമതിക്കാൻ തുടങ്ങുന്നതും. എന്നിരുന്നാലും, വിപണികൾ ഇതിനകം ഏറ്റവും ഉയർന്ന നിലയിലാണെങ്കിൽ, ഒറ്റത്തവണ നിക്ഷേപത്തിൽ നിന്ന് വിട്ടുനിൽക്കുന്നതാണ് നല്ലത്.
വൈവിധ്യവൽക്കരണം
ഒറ്റത്തവണ നിക്ഷേപിക്കുന്നതിന് മുമ്പ് പരിഗണിക്കേണ്ട ഒരു പ്രധാന വശം കൂടിയാണ് വൈവിധ്യവൽക്കരണം. ഒറ്റത്തവണ നിക്ഷേപം നടത്തുന്ന വ്യക്തികൾ ഒന്നിലധികം വഴികളിലേക്ക് വ്യാപിച്ചുകൊണ്ട് അവരുടെ നിക്ഷേപം വൈവിധ്യവത്കരിക്കണം. സ്കീമുകളിലൊന്ന് പ്രവർത്തിക്കുന്നില്ലെങ്കിൽപ്പോലും അവരുടെ മൊത്തത്തിലുള്ള പോർട്ട്ഫോളിയോ നന്നായി പ്രവർത്തിക്കുന്നുവെന്ന് ഉറപ്പാക്കാൻ ഇത് സഹായിക്കും.
നിങ്ങളുടെ ലക്ഷ്യം അനുസരിച്ച് നിങ്ങളുടെ നിക്ഷേപം നടത്തുക
വ്യക്തികൾ ചെയ്യുന്ന ഏതൊരു നിക്ഷേപവും ഒരു പ്രത്യേക ലക്ഷ്യം കൈവരിക്കാനാണ്. അതിനാൽ, സ്കീമിന്റെ സമീപനം യോജിച്ചതാണോ എന്ന് വ്യക്തികൾ പരിശോധിക്കണംനിക്ഷേപകൻന്റെ ലക്ഷ്യം. ഇവിടെ, വ്യക്തികൾ വിവിധ പാരാമീറ്ററുകൾക്കായി നോക്കണംസിഎജിആർ സ്കീമിൽ നിക്ഷേപിക്കുന്നതിന് മുമ്പുള്ള വരുമാനം, സമ്പൂർണ്ണ വരുമാനം, നികുതിയുടെ സ്വാധീനം എന്നിവയും അതിലേറെയും.
ശരിയായ സമയത്ത് വീണ്ടെടുക്കൽ നടത്തണം
വ്യക്തികൾ അവരുടെ കാര്യം ചെയ്യണംമോചനം കൃത്യമായ സമയത്ത് ഒറ്റത്തവണ നിക്ഷേപം. നിക്ഷേപലക്ഷ്യം അനുസരിച്ച് ഇത് സാധ്യമാണെങ്കിലും; വ്യക്തികൾ അവർ നിക്ഷേപിക്കാൻ ഉദ്ദേശിക്കുന്ന സ്കീമിനെക്കുറിച്ച് സമയബന്ധിതമായി അവലോകനം ചെയ്യണം. എന്നിരുന്നാലും, അവർക്ക് പരമാവധി ആനുകൂല്യങ്ങൾ ആസ്വദിക്കാൻ കഴിയുന്ന തരത്തിൽ ദീർഘകാലത്തേക്ക് നിക്ഷേപം നിലനിർത്തേണ്ടതുണ്ട്.
മ്യൂച്വൽ ഫണ്ട് ലംപ് സം റിട്ടേൺ കാൽക്കുലേറ്റർ
മ്യൂച്വൽ ഫണ്ട് ലംപ് സം റിട്ടേൺ കാൽക്കുലേറ്റർ ഒരു വ്യക്തിയുടെ ലംപ് സം നിക്ഷേപം ഒരു നിശ്ചിത സമയപരിധിയിൽ എങ്ങനെ വളരുന്നു എന്ന് കാണിക്കാൻ വ്യക്തികളെ സഹായിക്കുന്നു. ലംപ് സം കാൽക്കുലേറ്ററിൽ ഇൻപുട്ട് ചെയ്യേണ്ട ചില ഡാറ്റയിൽ നിക്ഷേപത്തിന്റെ കാലാവധി, പ്രാരംഭ നിക്ഷേപ തുക, ദീർഘകാല പ്രതീക്ഷിക്കുന്ന വളർച്ചാ നിരക്ക് എന്നിവയും അതിലേറെയും ഉൾപ്പെടുന്നു. മ്യൂച്വൽ ഫണ്ട് ലംപ്സം റിട്ടേൺ കാൽക്കുലേറ്ററിന്റെ ഒരു ചിത്രീകരണം ഇനിപ്പറയുന്നതാണ്.
ചിത്രീകരണം
ലംപ് സം നിക്ഷേപം: 25 രൂപ,000
നിക്ഷേപ കാലാവധി: 15 വർഷം
ദീർഘകാല വളർച്ചാ നിരക്ക് (ഏകദേശം): 15%
ലംപ് സം കാൽക്കുലേറ്റർ അനുസരിച്ച് പ്രതീക്ഷിക്കുന്ന വരുമാനം: 2,03,427 രൂപ
നിക്ഷേപത്തിലെ അറ്റാദായം: 1,78,427 രൂപ
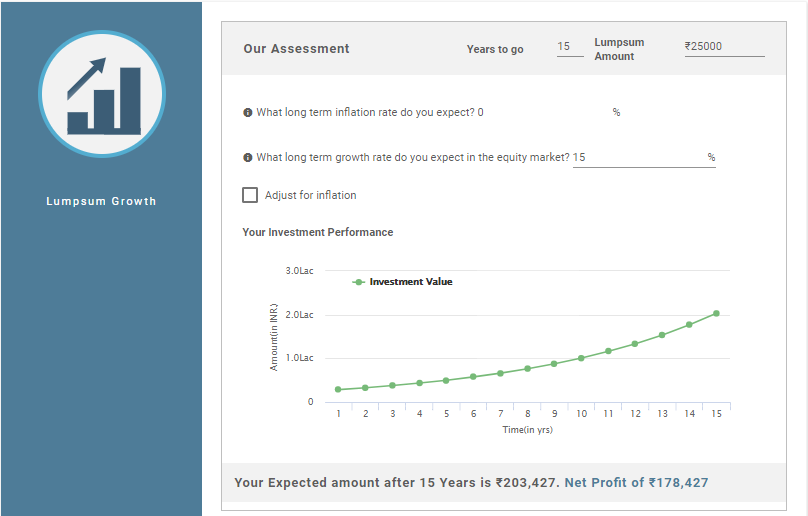
അതിനാൽ, മുകളിലെ കണക്കുകൂട്ടൽ കാണിക്കുന്നത് നിങ്ങളുടെ നിക്ഷേപത്തിലെ നിക്ഷേപത്തിന്റെ അറ്റാദായം 1,78,427 രൂപയാണെന്നും നിങ്ങളുടെ നിക്ഷേപത്തിന്റെ ആകെ മൂല്യം 2,03,427 രൂപയാണെന്നും ആണ്..
മ്യൂച്വൽ ഫണ്ടിലെ ഒറ്റത്തവണ നിക്ഷേപത്തിന്റെ ഗുണങ്ങളും ദോഷങ്ങളും
SIP-ന് സമാനമായി, ലംപ് സം നിക്ഷേപത്തിനും അതിന്റേതായ ഗുണങ്ങളും ദോഷങ്ങളുമുണ്ട്. അതിനാൽ, നമുക്ക് ഈ ഗുണങ്ങളും ദോഷങ്ങളും നോക്കാം.
പ്രയോജനങ്ങൾ
ലംപ് സം നിക്ഷേപത്തിന്റെ ഗുണങ്ങൾ താഴെ പറയുന്നവയാണ്.
- വലിയ തുക നിക്ഷേപിക്കുക: വ്യക്തികൾക്ക് മ്യൂച്വൽ ഫണ്ടുകളിൽ വലിയ തുക നിക്ഷേപിക്കാനും ഫണ്ടുകൾ നിഷ്ക്രിയമായി സൂക്ഷിക്കുന്നതിനുപകരം ഉയർന്ന വരുമാനം നേടാനും കഴിയും.
- ദീർഘകാലത്തേക്ക് അനുയോജ്യം: ദീർഘകാല നിക്ഷേപങ്ങൾക്ക്, പ്രത്യേകിച്ച് ഇക്വിറ്റി ഫണ്ടുകളുടെ കാര്യത്തിൽ, ലംപ് സം നിക്ഷേപ രീതി നല്ലതാണ്. എന്നിരുന്നാലും, ഡെറ്റ് ഫണ്ടുകളുടെ കാര്യത്തിൽ, കാലാവധി ഹ്രസ്വമോ ഇടത്തരമോ ആകാം
- സൗകര്യം: പേയ്മെന്റ് ഒരു തവണ മാത്രമേ ചെയ്യുന്നുള്ളൂ എന്നതിനാലും കൃത്യമായ ഇടവേളകളിൽ കുറയ്ക്കാത്തതിനാലും ഒറ്റത്തവണ നിക്ഷേപ രീതി സൗകര്യപ്രദമാണ്.
ദോഷങ്ങൾ
ലംപ് സം നിക്ഷേപത്തിന്റെ ദോഷങ്ങൾ ഇവയാണ്:
- ക്രമരഹിതമായ നിക്ഷേപം: ലംപ് സം നിക്ഷേപം സ്ഥിരമായ സമ്പാദ്യശീലം വളർത്തിയെടുക്കാത്തതിനാൽ നിക്ഷേപകന്റെ സ്ഥിരമായ സമ്പാദ്യം ഉറപ്പാക്കുന്നില്ല.
- ഉയർന്ന അപകടസാധ്യത: ലംപ് സം നിക്ഷേപത്തിൽ, സമയക്രമം നോക്കേണ്ടത് പ്രധാനമാണ്. കാരണം, ലംപ്സം മോഡിൽ നിക്ഷേപം ഒരു തവണ മാത്രമേ ചെയ്യുന്നുള്ളൂ, കൃത്യമായ ഇടവേളകളിൽ അല്ല. അതിനാൽ, വ്യക്തികൾ സമയം കണക്കാക്കിയില്ലെങ്കിൽ, അവർ നഷ്ടത്തിലായേക്കാം.
ഉപസംഹാരം
അതിനാൽ, മുകളിലുള്ള പോയിന്ററുകളിൽ നിന്ന്, മ്യൂച്വൽ ഫണ്ടുകളിൽ നിക്ഷേപിക്കാനുള്ള ഒരു നല്ല മാർഗമാണ് ലംപ്സം മോഡ് എന്ന് പറയാം. എന്നിരുന്നാലും, സ്കീമിൽ ഒറ്റത്തവണ തുക നിക്ഷേപിക്കുമ്പോൾ വ്യക്തികൾ ആത്മവിശ്വാസം പുലർത്തേണ്ടതുണ്ട്. ഇല്ലെങ്കിൽ, അവർക്ക് നിക്ഷേപത്തിന്റെ SIP മോഡ് തിരഞ്ഞെടുക്കാം. കൂടാതെ, നിക്ഷേപം നടത്തുന്നതിന് മുമ്പ് ആളുകൾ സ്കീമിന്റെ രീതികൾ മനസ്സിലാക്കണം. ആവശ്യമെങ്കിൽ, അവർക്ക് ഒരു ഉപദേശം പോലും നൽകാംസാമ്പത്തിക ഉപദേഷ്ടാവ്. അവരുടെ പണം സുരക്ഷിതമാണെന്നും അവരുടെ ലക്ഷ്യങ്ങൾ കൃത്യസമയത്ത് പൂർത്തീകരിക്കപ്പെടുന്നുവെന്നും ഉറപ്പാക്കാൻ ഇത് അവരെ സഹായിക്കും.
ഇവിടെ നൽകിയിരിക്കുന്ന വിവരങ്ങൾ കൃത്യമാണെന്ന് ഉറപ്പാക്കാൻ എല്ലാ ശ്രമങ്ങളും നടത്തിയിട്ടുണ്ട്. എന്നിരുന്നാലും, ഡാറ്റയുടെ കൃത്യത സംബന്ധിച്ച് യാതൊരു ഉറപ്പും നൽകുന്നില്ല. എന്തെങ്കിലും നിക്ഷേപം നടത്തുന്നതിന് മുമ്പ് സ്കീം വിവര രേഖ ഉപയോഗിച്ച് പരിശോധിക്കുക.
You Might Also Like


AMFI Registration No. 112358 | CIN: U74999MH2016PTC282153
Shepard Technologies Pvt. Ltd. (with ARN code 112358) makes no warranties or representations, express or implied, on products offered through the platform. It accepts no liability for any damages or losses, however caused, in connection with the use of, or on the reliance of its product or related services. Terms and conditions of the website are applicable.
©2026 Shepard Technologies Private Limited. All Rights Reserved
Research Highlights for SBI Healthcare Opportunities Fund