What are Money Market Funds?
A money market fund (MMF) is a type of fixed income mutual fund that invests in debt securities. But, before we start with money market funds, it's important to understand what is a fixed income instrument? Well, as the name denotes, a fixed income instrument is something that generates a specified amount of income over a certain period. The investor is given a fixed claim on the assets held by the issuer, fixed income instruments are considered low-risk and low-yield investments. Essentially, fixed income instruments are nothing, but a way of borrowing funds (where the borrowing is done by the issuer).
Fixed Income Vs Stocks
For starters, fixed income gives economic rights to the holder, which includes the right to receive interest payments and the return of all or part of capital invested at a given date. In contrast, the shareholder (stock owner) receives dividends from the issuer, but the company is not bound by any law to pay dividends. Also, another important difference is that the fixed income holder is a creditor of the company that issues the security, while a shareholder is a partner, owning a part of the capital stock. Here it’s important to understand that if the company goes bust, the creditors (bondholders) have priority over shareholders (equity holders).
Types of Fixed Income Instruments
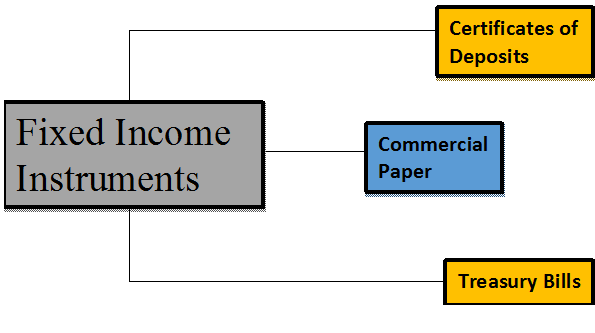
There are different fixed income instruments that fall under money market instruments, to name some of them:
Certificates of Deposits (CDs)
Time deposits like term deposits are commonly offered to consumers by banks (scheduled commercial banks) & all India financial institutions. The difference between this and a term deposit in a Bank is that CDs can’t be withdrawn.
Commercial Paper (CPs)
Commercial papers are usually known as promissory notes which are unsecured and are generally issued by companies and financial institutions, at a discounted rate from their face value. The fixed maturity for commercial papers is 1 to 270 days. The purposes for which they are issued are - for inventory financing, accounts receivables, and settling short-term liabilities or loans.
Treasury Bills (T-Bills)
Treasury bills were first issued by the Indian government in 1917. Treasury bills are short-term financial instruments that are issued by the Central Bank of the country. It is one of the safest money market instruments as it is void of market risks (since the risk is sovereign or in this case the Government of India), though the return on investments is not that huge. Treasury bills are circulated by the primary as well as the secondary markets. The maturity periods for treasury bills are respectively 3-month, 6-month, and 1-year.
There are lots of other fixed income instruments such as repurchase agreements (repos), asset-backed securities etc., that also exist in the Indian fixed income market, but the above are the more common ones.
Talk to our investment specialist
Why to Invest in Money Market Mutual Funds?
- Securities in the money market are relatively low risk.
- Money market funds are considered to be the safe and secure of all Mutual Fund investments.
- Considering money market funds, it’s easy to invest in a money market account. Investing through Mutual Funds investors can open an account, make deposits and withdrawals virtually at their convenience.
- Money market funds are considered to be one of the least volatile types of all mutual fund investments.
- The performance of money market funds is closely tied to the interest rates set by the Reserve Bank of India, the Central Bank of India. So, when RBI raises rates in the market, yields increase, and money market funds are able to give good returns.
Money Market Instruments & Bonds: The Difference
Bonds have a maturity period of more than one year which differentiates it from other debt securities like commercial papers, treasury bills and other money market instruments which typically have a maturity period of less than one year.
What is Money Market?
Money market generally refers to a section of the financial market where financial instruments with smaller maturities (less than a year) and high liquidity are traded. India has a very active money market, where a host of instruments are traded. Here you have Mutual Fund companies, government banks and various other large domestic institutions participating. The money market has become a component of the financial market for buying and selling of securities of short-term duration, such as commercial papers and treasury bills.
Money Market Rates
The money market rates are the interest rates offered by short-term money market instruments. These instruments have a maturity ranging from 1 day to one year. The money market rates vary over many complex instruments such as treasury bills, call money, commercial paper (CP), certificates of deposits (CDs), repos, etc. The Reserve Bank of India (RBI) is largely the governing authority over the money markets.
An example of the money market rates of various instruments as given on the RBI site as of 28th Feb 2017 is below for reference.
| Volume (One Leg) | Weighted Average Rate | Range | |
|---|---|---|---|
| A. Overnight Segment (I+II+III+IV) | 553,584.29 | 6.64 | 4.60-6.86 |
| I. Call Money | 16,300.98 | 6.67 | 4.60-6.85 |
| II. Triparty Repo | 376,743.10 | 6.64 | 6.56-6.80 |
| III. Market Repo | 160,540.21 | 6.65 | 6.00-6.86 |
| IV. Repo in Corporate Bond | 0.00 | - | - |
| B. Term Segment | |||
| I. Notice Money** | 109.00 | 6.27 | 6.00-6.70 |
| II. Term Money@@ | 351.00 | - | 6.40-7.00 |
| III. Triparty Repo | 55.00 | 6.60 | 6.60-6.60 |
| IV. Market Repo | 1,075.00 | 6.76 | 6.75-6.85 |
| V. Repo in Corporate Bond | 0.00 | - | - |
Source: Money Market Operations, RBI Date: 27 Feb 2023
Mutual Fund Companies Offering Money Market Funds
As we have learnt about various types of instruments above, it’s equally important to know how an investor could invest in money market funds. There are 44 AMCs (Asset Managment Companies) in India, most of them offering money market funds (mainly Liquid Funds and ultra-short funds for investors). Investors can also invest via distributors like banks and brokers. Investing in money market funds requires one to follow the respective procedure and the relevant applications. The terms & conditions of debt mutual funds may vary, therefore, it’s important to get an overall knowledge and then choose the one that meets your needs. Moreover, before investing into any money market mutual funds carefully consider its investment objectives, risks, returns, and expenses.
Factors to Consider for Investing in MMFs
Here are some important aspects that you must consider before investing in money market funds in India:
a. Risks and Returns
Money Market Funds are debt funds and hence carry all the risks applicable to debt funds like interest rate risk and credit risk. Additionally, the fund manager might invest in instruments with a slightly higher risk component to increase returns. Usually, money market funds tend to offer better returns than a regular Savings Account. The Net Asset Value or NAV of these funds changes with a change in the interest rate regime.
b. Expense Ratio
Since the returns are not very high, the expense ratio plays an important role in determining your earnings from a money market fund. Expense Ratio is a small percentage of the total assets of the fund charged by the fund house towards fund management services. Ideally, you should look for funds with a lower expense ratio to maximize your returns.
c. Invest according to your Investment Plan
Usually, money market funds are recommended to investors with an investment horizon of 90-365 days. These schemes can help you diversify your Portfolio and help invest surplus cash while maintaining liquidity. Ensure that you invest according to your Investment plan.
d. Taxation
In the case of Money Market Funds, the taxation rules are as follows:
Capital Gains Tax
If you hold the units of the scheme for a period of up to three years, then the Capital Gains earned by you are called short-term capital gains or STCG. STCG is added to your taxable income and taxed as per the applicable income tax slab. If you hold the units of the scheme for more than three years, then the capital gains earned by you are called long-term capital gains or LTCG. It is taxed at 20% with indexation benefits.
Fund Selection Methodology used to find 5 funds
Best Money Market Funds to Invest in FY 26 - 27
Some of the best money market funds in India are as follows-
Fund NAV Net Assets (Cr) 3 MO (%) 6 MO (%) 1 YR (%) 3 YR (%) 2024 (%) Debt Yield (YTM) Mod. Duration Eff. Maturity UTI Money Market Fund Growth ₹3,293.79
↑ 1.77 ₹18,611 1.5 3.3 6.2 7.3 7.5 7.58% 6M 20D 6M 20D Tata Money Market Fund Growth ₹5,042.11
↑ 2.65 ₹33,030 1.5 3.3 6.1 7.3 7.4 7.79% 7M 1D 7M 1D Aditya Birla Sun Life Money Manager Fund Growth ₹395.043
↑ 0.21 ₹27,550 1.5 3.3 6.1 7.3 7.4 7.94% 7M 28D 8M 1D Kotak Money Market Scheme Growth ₹4,794.56
↑ 2.58 ₹31,606 1.5 3.3 6.1 7.2 7.4 7.71% 7M 6D 7M 6D Franklin India Savings Fund Growth ₹53.5552
↑ 0.03 ₹4,443 1.5 3.2 6.1 7.2 7.4 7.76% 4M 28D 6M 25D Note: Returns up to 1 year are on absolute basis & more than 1 year are on CAGR basis. as on 17 Jul 26 Research Highlights & Commentary of 5 Funds showcased
Commentary UTI Money Market Fund Tata Money Market Fund Aditya Birla Sun Life Money Manager Fund Kotak Money Market Scheme Franklin India Savings Fund Point 1 Bottom quartile AUM (₹18,611 Cr). Highest AUM (₹33,030 Cr). Lower mid AUM (₹27,550 Cr). Upper mid AUM (₹31,606 Cr). Bottom quartile AUM (₹4,443 Cr). Point 2 Established history (17+ yrs). Established history (23+ yrs). Established history (20+ yrs). Established history (23+ yrs). Oldest track record among peers (24 yrs). Point 3 Rating: 4★ (upper mid). Rating: 3★ (bottom quartile). Top rated. Rating: 4★ (lower mid). Rating: 3★ (bottom quartile). Point 4 Risk profile: Low. Risk profile: Low. Risk profile: Low. Risk profile: Low. Risk profile: Moderately Low. Point 5 1Y return: 6.16% (top quartile). 1Y return: 6.13% (upper mid). 1Y return: 6.12% (lower mid). 1Y return: 6.12% (bottom quartile). 1Y return: 6.10% (bottom quartile). Point 6 1M return: 0.65% (lower mid). 1M return: 0.64% (bottom quartile). 1M return: 0.67% (top quartile). 1M return: 0.65% (bottom quartile). 1M return: 0.65% (upper mid). Point 7 Sharpe: 0.35 (upper mid). Sharpe: 0.48 (top quartile). Sharpe: 0.19 (bottom quartile). Sharpe: 0.24 (bottom quartile). Sharpe: 0.24 (lower mid). Point 8 Information ratio: 0.00 (top quartile). Information ratio: 0.00 (upper mid). Information ratio: 0.00 (lower mid). Information ratio: 0.00 (bottom quartile). Information ratio: 0.00 (bottom quartile). Point 9 Yield to maturity (debt): 7.58% (bottom quartile). Yield to maturity (debt): 7.79% (upper mid). Yield to maturity (debt): 7.94% (top quartile). Yield to maturity (debt): 7.71% (bottom quartile). Yield to maturity (debt): 7.76% (lower mid). Point 10 Modified duration: 0.56 yrs (upper mid). Modified duration: 0.59 yrs (lower mid). Modified duration: 0.66 yrs (bottom quartile). Modified duration: 0.60 yrs (bottom quartile). Modified duration: 0.41 yrs (top quartile). UTI Money Market Fund
Tata Money Market Fund
Aditya Birla Sun Life Money Manager Fund
Kotak Money Market Scheme
Franklin India Savings Fund
To provide highest possible current income consistent with preservation of capital and providing liquidity from investing in a diversified portfolio of short term money market securities. Below is the key information for UTI Money Market Fund Returns up to 1 year are on (Erstwhile Tata Liquid Fund) To create a highly liquid portfolio of good quality debt as well as money market instruments so as to provide reasonable returns and high liquidity to the unitholders. Research Highlights for Tata Money Market Fund Below is the key information for Tata Money Market Fund Returns up to 1 year are on (Erstwhile Aditya Birla Sun Life Floating Rate Fund - Short Term) The primary objective of the schemes is to generate regular income through investment in a portfolio comprising substantially of floating rate debt / money market instruments. The schemes may invest a portion of its net assets in fixed rate debt securities and money market instruments. Research Highlights for Aditya Birla Sun Life Money Manager Fund Below is the key information for Aditya Birla Sun Life Money Manager Fund Returns up to 1 year are on (Erstwhile Kotak Floater Short Term Fund) To reduce the interest rate risk associated with investments in fixed rate instruments by investing predominantly in floating rate securities, money market instruments and using appropriate derivatives. Research Highlights for Kotak Money Market Scheme Below is the key information for Kotak Money Market Scheme Returns up to 1 year are on (Erstwhile Franklin India Savings Plus Fund Retail Option) Aims to provide income consistent with the prudent risk from a portfolio comprising substantially of floating rate debt instruments, fixed rate debt instruments swapped for floating rate returns, and also fixed rate instruments and money market instruments. Research Highlights for Franklin India Savings Fund Below is the key information for Franklin India Savings Fund Returns up to 1 year are on 1. UTI Money Market Fund
UTI Money Market Fund
Growth Launch Date 13 Jul 09 NAV (17 Jul 26) ₹3,293.79 ↑ 1.77 (0.05 %) Net Assets (Cr) ₹18,611 on 31 May 26 Category Debt - Money Market AMC UTI Asset Management Company Ltd Rating ☆☆☆☆ Risk Low Expense Ratio 0.25 Sharpe Ratio 0.35 Information Ratio 0 Alpha Ratio 0 Min Investment 10,000 Min SIP Investment 500 Exit Load NIL Yield to Maturity 7.58% Effective Maturity 6 Months 20 Days Modified Duration 6 Months 20 Days Growth of 10,000 investment over the years.
Date Value 30 Jun 21 ₹10,000 30 Jun 22 ₹10,381 30 Jun 23 ₹11,091 30 Jun 24 ₹11,922 30 Jun 25 ₹12,901 30 Jun 26 ₹13,717 Returns for UTI Money Market Fund
absolute basis & more than 1 year are on CAGR (Compound Annual Growth Rate) basis. as on 17 Jul 26 Duration Returns 1 Month 0.7% 3 Month 1.5% 6 Month 3.3% 1 Year 6.2% 3 Year 7.3% 5 Year 6.5% 10 Year 15 Year Since launch 7.3% Historical performance (Yearly) on absolute basis
Year Returns 2024 7.5% 2023 7.7% 2022 7.4% 2021 4.9% 2020 3.7% 2019 6% 2018 8% 2017 7.8% 2016 6.7% 2015 7.7% Fund Manager information for UTI Money Market Fund
Name Since Tenure Anurag Mittal 1 Dec 21 4.58 Yr. Amit Sharma 7 Jul 17 8.99 Yr. Data below for UTI Money Market Fund as on 31 May 26
Asset Allocation
Asset Class Value Cash 86.17% Debt 13.52% Other 0.31% Debt Sector Allocation
Sector Value Corporate 46.48% Cash Equivalent 35.25% Government 17.97% Credit Quality
Rating Value AAA 100% Top Securities Holdings / Portfolio
Name Holding Value Quantity India (Republic of)
- | -4% ₹654 Cr 6,629,850,000 Indusind Bank Ltd.
Debentures | -2% ₹338 Cr 3,500,000,000
↑ 3,500,000,000 Tbill
Sovereign Bonds | -2% ₹297 Cr 3,000,000,000 Tbill
Sovereign Bonds | -2% ₹296 Cr 3,000,000,000 5.74% Govt Stock 2026
Sovereign Bonds | -2% ₹280 Cr 2,800,000,000 Tbill
Sovereign Bonds | -1% ₹248 Cr 2,500,000,000 Tbill
Sovereign Bonds | -1% ₹198 Cr 2,000,000,000 Indian Bank
Domestic Bonds | -1% ₹195 Cr 2,000,000,000 Axis Bank Ltd.
Debentures | -1% ₹191 Cr 2,000,000,000
↑ 2,000,000,000 Indian Overseas Bank
Debentures | -1% ₹190 Cr 2,000,000,000 2. Tata Money Market Fund
Tata Money Market Fund
Growth Launch Date 22 May 03 NAV (17 Jul 26) ₹5,042.11 ↑ 2.65 (0.05 %) Net Assets (Cr) ₹33,030 on 31 May 26 Category Debt - Money Market AMC Tata Asset Management Limited Rating ☆☆☆ Risk Low Expense Ratio 0.44 Sharpe Ratio 0.48 Information Ratio 0 Alpha Ratio 0 Min Investment 5,000 Min SIP Investment 500 Exit Load NIL Yield to Maturity 7.79% Effective Maturity 7 Months 1 Day Modified Duration 7 Months 1 Day Growth of 10,000 investment over the years.
Date Value 30 Jun 21 ₹10,000 30 Jun 22 ₹10,373 30 Jun 23 ₹11,077 30 Jun 24 ₹11,911 30 Jun 25 ₹12,877 30 Jun 26 ₹13,686 Returns for Tata Money Market Fund
absolute basis & more than 1 year are on CAGR (Compound Annual Growth Rate) basis. as on 17 Jul 26 Duration Returns 1 Month 0.6% 3 Month 1.5% 6 Month 3.3% 1 Year 6.1% 3 Year 7.3% 5 Year 6.5% 10 Year 15 Year Since launch 6.7% Historical performance (Yearly) on absolute basis
Year Returns 2024 7.4% 2023 7.7% 2022 7.4% 2021 4.8% 2020 3.9% 2019 6.4% 2018 8.1% 2017 -0.1% 2016 6.7% 2015 7.6% Fund Manager information for Tata Money Market Fund
Name Since Tenure Amit Somani 16 Oct 13 12.71 Yr. Harsh Dave 1 Jun 26 0.08 Yr. Data below for Tata Money Market Fund as on 31 May 26
Asset Allocation
Asset Class Value Cash 87.56% Debt 12.11% Other 0.32% Debt Sector Allocation
Sector Value Corporate 46.25% Cash Equivalent 37.93% Government 15.5% Credit Quality
Rating Value AAA 100% Top Securities Holdings / Portfolio
Name Holding Value Quantity India (Republic of)
- | -3% ₹1,000 Cr 100,000,000
↑ 100,000,000 Indian Bank
Domestic Bonds | -3% ₹958 Cr 19,500 Indian Overseas Bank
Debentures | -2% ₹666 Cr 14,000 Equitas Small Finance Bank Ltd.
Debentures | -2% ₹567 Cr 12,000 India (Republic of)
- | -2% ₹527 Cr 53,000,000 7.86% Karnataka Sdl 2027
Sovereign Bonds | -2% ₹491 Cr 48,500,000
↑ 48,500,000 Karur Vysya Bank Ltd.
Debentures | -2% ₹491 Cr 10,000 Tbill
Sovereign Bonds | -1% ₹445 Cr 45,000,000 India (Republic of)
- | -1% ₹400 Cr 40,500,000 India (Republic of)
- | -1% ₹302 Cr 30,500,000
↓ -25,000,000 3. Aditya Birla Sun Life Money Manager Fund
Aditya Birla Sun Life Money Manager Fund
Growth Launch Date 13 Oct 05 NAV (17 Jul 26) ₹395.043 ↑ 0.21 (0.05 %) Net Assets (Cr) ₹27,550 on 31 May 26 Category Debt - Money Market AMC Birla Sun Life Asset Management Co Ltd Rating ☆☆☆☆☆ Risk Low Expense Ratio 0.35 Sharpe Ratio 0.19 Information Ratio 0 Alpha Ratio 0 Min Investment 1,000 Min SIP Investment 1,000 Exit Load NIL Yield to Maturity 7.94% Effective Maturity 8 Months 1 Day Modified Duration 7 Months 28 Days Growth of 10,000 investment over the years.
Date Value 30 Jun 21 ₹10,000 30 Jun 22 ₹10,373 30 Jun 23 ₹11,087 30 Jun 24 ₹11,925 30 Jun 25 ₹12,891 30 Jun 26 ₹13,700 Returns for Aditya Birla Sun Life Money Manager Fund
absolute basis & more than 1 year are on CAGR (Compound Annual Growth Rate) basis. as on 17 Jul 26 Duration Returns 1 Month 0.7% 3 Month 1.5% 6 Month 3.3% 1 Year 6.1% 3 Year 7.3% 5 Year 6.5% 10 Year 15 Year Since launch 6.8% Historical performance (Yearly) on absolute basis
Year Returns 2024 7.4% 2023 7.8% 2022 7.4% 2021 4.8% 2020 3.8% 2019 6.6% 2018 8% 2017 7.9% 2016 6.8% 2015 7.7% Fund Manager information for Aditya Birla Sun Life Money Manager Fund
Name Since Tenure Kaustubh Gupta 15 Jul 11 14.97 Yr. Anuj Jain 22 Mar 21 5.28 Yr. Mohit Sharma 1 Apr 17 9.25 Yr. Data below for Aditya Birla Sun Life Money Manager Fund as on 31 May 26
Asset Allocation
Asset Class Value Cash 69.19% Debt 30.52% Other 0.29% Debt Sector Allocation
Sector Value Corporate 51.26% Cash Equivalent 33.61% Government 14.84% Credit Quality
Rating Value AAA 100% Top Securities Holdings / Portfolio
Name Holding Value Quantity Indusind Bank Ltd.
Debentures | -5% ₹1,383 Cr 29,000 Axis Bank Ltd.
Debentures | -3% ₹917 Cr 19,000 Federal Bank Ltd.
Debentures | -3% ₹905 Cr 19,000 Gujarat State Development Loans
Sovereign Bonds | -3% ₹797 Cr 79,327,600 Karur Vysya Bank Ltd.
Debentures | -2% ₹475 Cr 10,000 Tbill
Sovereign Bonds | -1% ₹394 Cr 40,000,000 7.49% Gujarat Sgs 2026
Sovereign Bonds | -1% ₹327 Cr 32,500,000 7.43% Gujarat Sgs 2027
Sovereign Bonds | -1% ₹247 Cr 24,500,000 Tbill
Sovereign Bonds | -1% ₹245 Cr 25,000,000 Karur Vysya Bank Ltd.
Debentures | -1% ₹242 Cr 5,000 4. Kotak Money Market Scheme
Kotak Money Market Scheme
Growth Launch Date 14 Jul 03 NAV (17 Jul 26) ₹4,794.56 ↑ 2.58 (0.05 %) Net Assets (Cr) ₹31,606 on 31 May 26 Category Debt - Money Market AMC Kotak Mahindra Asset Management Co Ltd Rating ☆☆☆☆ Risk Low Expense Ratio 0.36 Sharpe Ratio 0.24 Information Ratio 0 Alpha Ratio 0 Min Investment 5,000 Min SIP Investment 1,000 Exit Load NIL Yield to Maturity 7.71% Effective Maturity 7 Months 6 Days Modified Duration 7 Months 6 Days Growth of 10,000 investment over the years.
Date Value 30 Jun 21 ₹10,000 30 Jun 22 ₹10,382 30 Jun 23 ₹11,079 30 Jun 24 ₹11,905 30 Jun 25 ₹12,872 30 Jun 26 ₹13,680 Returns for Kotak Money Market Scheme
absolute basis & more than 1 year are on CAGR (Compound Annual Growth Rate) basis. as on 17 Jul 26 Duration Returns 1 Month 0.7% 3 Month 1.5% 6 Month 3.3% 1 Year 6.1% 3 Year 7.2% 5 Year 6.5% 10 Year 15 Year Since launch 7% Historical performance (Yearly) on absolute basis
Year Returns 2024 7.4% 2023 7.7% 2022 7.3% 2021 4.9% 2020 3.7% 2019 5.7% 2018 8% 2017 7.7% 2016 6.7% 2015 7.7% Fund Manager information for Kotak Money Market Scheme
Name Since Tenure Deepak Agrawal 1 Nov 06 19.67 Yr. Manu Sharma 1 Nov 22 3.66 Yr. Data below for Kotak Money Market Scheme as on 31 May 26
Asset Allocation
Asset Class Value Cash 87.94% Debt 11.75% Other 0.31% Debt Sector Allocation
Sector Value Corporate 46.99% Cash Equivalent 33.44% Government 19.26% Credit Quality
Rating Value AAA 100% Top Securities Holdings / Portfolio
Name Holding Value Quantity India (Republic of)
- | -4% ₹1,332 Cr 135,000,000 Tbill
Sovereign Bonds | -3% ₹988 Cr 100,000,000 Tbill
Sovereign Bonds | -2% ₹742 Cr 75,000,000 Indusind Bank Ltd.
Debentures | -2% ₹715 Cr 75,000 Punjab National Bank
Debentures | -2% ₹478 Cr 50,000 06/08/2026 Maturing 182 DTB
Sovereign Bonds | -1% ₹397 Cr 40,000,000
↓ -25,000,000 Tbill
Sovereign Bonds | -1% ₹371 Cr 37,500,000 Federal Bank Ltd.
Debentures | -1% ₹359 Cr 37,500 India (Republic of)
- | -1% ₹248 Cr 25,000,000
↓ -15,000,000 Karur Vysya Bank Ltd.
Debentures | -1% ₹238 Cr 25,000 5. Franklin India Savings Fund
Franklin India Savings Fund
Growth Launch Date 11 Feb 02 NAV (17 Jul 26) ₹53.5552 ↑ 0.03 (0.05 %) Net Assets (Cr) ₹4,443 on 31 May 26 Category Debt - Money Market AMC Franklin Templeton Asst Mgmt(IND)Pvt Ltd Rating ☆☆☆ Risk Moderately Low Expense Ratio 0.3 Sharpe Ratio 0.24 Information Ratio 0 Alpha Ratio 0 Min Investment 10,000 Min SIP Investment 500 Exit Load NIL Yield to Maturity 7.76% Effective Maturity 6 Months 25 Days Modified Duration 4 Months 28 Days Growth of 10,000 investment over the years.
Date Value 30 Jun 21 ₹10,000 30 Jun 22 ₹10,345 30 Jun 23 ₹11,025 30 Jun 24 ₹11,836 30 Jun 25 ₹12,805 30 Jun 26 ₹13,606 Returns for Franklin India Savings Fund
absolute basis & more than 1 year are on CAGR (Compound Annual Growth Rate) basis. as on 17 Jul 26 Duration Returns 1 Month 0.7% 3 Month 1.5% 6 Month 3.2% 1 Year 6.1% 3 Year 7.2% 5 Year 6.4% 10 Year 15 Year Since launch 7.1% Historical performance (Yearly) on absolute basis
Year Returns 2024 7.4% 2023 7.7% 2022 7.3% 2021 4.4% 2020 3.6% 2019 6% 2018 8.5% 2017 7.5% 2016 7.2% 2015 8.1% Fund Manager information for Franklin India Savings Fund
Name Since Tenure Rahul Goswami 6 Oct 23 2.73 Yr. Rohan Maru 10 Oct 24 1.72 Yr. Chandni Gupta 30 Apr 24 2.17 Yr. Data below for Franklin India Savings Fund as on 31 May 26
Asset Allocation
Asset Class Value Cash 97.16% Debt 2.57% Other 0.27% Debt Sector Allocation
Sector Value Cash Equivalent 45.27% Corporate 37.49% Government 16.97% Credit Quality
Rating Value AAA 100% Top Securities Holdings / Portfolio
Name Holding Value Quantity Axis Bank Ltd.
Debentures | -2% ₹96 Cr 2,000 India (Republic of)
- | -1% ₹50 Cr 5,000,000 Corporate Debt Market Development Fund Class A2
- | -0% ₹11 Cr 8,992 6.88% Westbengal Sdl 2026
Sovereign Bonds | -0% ₹5 Cr 500,000 Call, Cash & Other Assets
CBLO | -13% ₹510 Cr Bajaj Housing Finance Ltd.
Commercial Paper | -7% ₹285 Cr 6,000 Piramal Finance Limited
Commercial Paper | -7% ₹257 Cr 5,300 HDFC Bank Ltd
Certificate of Deposit | -6% ₹238 Cr 5,000 National Bank For Agriculture And Rural Development
Certificate of Deposit | -6% ₹220 Cr 4,600 Canara Bank
Certificate of Deposit | -5% ₹190 Cr 4,000
Conclusion
While we have learnt about money market instruments it's also important to know about debt mutual funds, their types, and classifications. Well, debt mutual funds are classified into general broad categories such as Liquid Funds, Ultra short term funds, Short Term Funds, Long Term Income Funds and Gilt Funds.
However, to invest in money market funds, it’s very important to understand the situation of the economy, the direction of interest rates, and the expected direction of movement of yields in corporate debt as well as government debt when investing.
All efforts have been made to ensure the information provided here is accurate. However, no guarantees are made regarding correctness of data. Please verify with scheme information document before making any investment.


?")


AMFI Registration No. 112358 | CIN: U74999MH2016PTC282153
Shepard Technologies Pvt. Ltd. (with ARN code 112358) makes no warranties or representations, express or implied, on products offered through the platform. It accepts no liability for any damages or losses, however caused, in connection with the use of, or on the reliance of its product or related services. Terms and conditions of the website are applicable.
©2026 Shepard Technologies Private Limited. All Rights Reserved
Research Highlights for UTI Money Market Fund