Mutual Funds Vs Stocks
Mutual Funds or stock markets directly – where to invest, is one of the oldest debates when it comes to personal wealth management. Mutual funds allow you to invest a certain amount in a fund where the fund managers use their expertise to invest a client’s money in a variety of stocks to achieve the highest rate of return. Investing in stock markets gives you greater control over the investment on shares is made by the user. However, it makes them more prone to risks as they have to directly deal with the markets.
Difference: Mutual Funds Vs Stocks/Shares
1. Understanding Mutual Funds and Stocks
When compared on a risk factor, stocks happen to be far riskier than mutual funds. The risk in mutual funds is spread across and hence reduced with the pooling in of diverse stocks. With stock,s one has to extensive research before investing, especially if you are a novice investor. Visit fincash for more details on the various areas of investments. In the case of mutual funds, the research is done, and the fund is managed by a mutual fund manager.

This service though is not free and comes with an annual management fee that is charged by the fund house under Total Expense Ration (TER).
2. When investing as a beginner
If you are a new investor with little or no experience in the financial markets, it is advisable to start with mutual funds as not only the risk is comparatively lesser but also because the decisions are made by an expert. These professionals have the insight to analyze and interpret financial data to gauge the outlook of a prospective investment.
3. Associated Costs
Though you have to pay a fee to mutual fund managers unlike in the case of stocks that you buy individually, the economies of scale also come into play. It is true that active management of funds is an affair that does not come free of cost. But the truth is that due to their large size, mutual funds pay only a small fraction of the brokerage charges that an individual shareholder pays for brokerage. Individual investors also have to pay the charges for DEMAT which is not needed in the case of mutual funds.
4. Risk and Return
It is already established that mutual funds have the advantage of reducing the risk by diversifying a Portfolio.
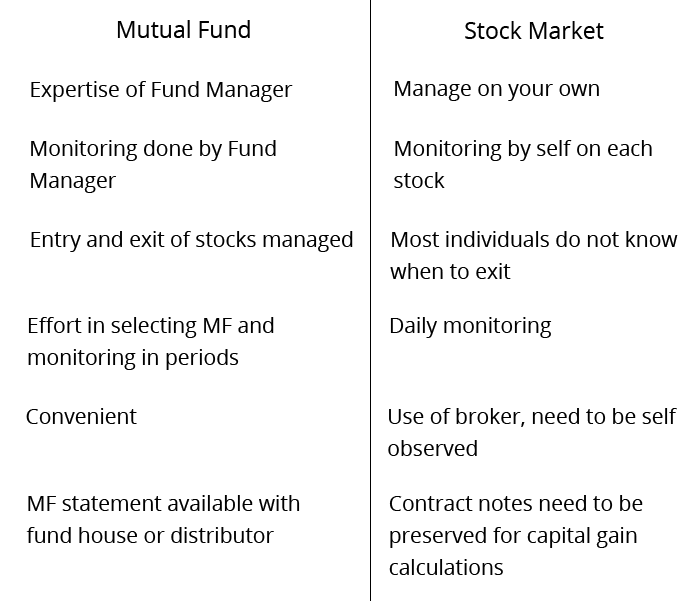
Stocks on the other hand are vulnerable to the market conditions and the performance of one stock can’t compensate for the other.
5. Short Term Capital Gain
Remember when investing in stocks, you will be liable to pay 15 percent tax on your short term Capital Gains (STCG) if you sell your stocks within a span of one year. On the other hand, there is no tax on capital gains on the stocks that are sold by the fund. This can mean substantial benefits for you. The tax saved is also available for you to invest it further thus making way for further income generation through investment. But you will have to hold on to your equity for more than a year in order to avoid paying that short-term capital gains tax.
6. Long Term Capital Gain
Long Term Capital Gain (LTCG) is taxed at 10% for gains exceeding 1 Lakh gain (As announced in Budget of 2018). which means one has to pay tax on gains incurred in period over an year (Long term) if amount exceeds 1 Lakhs in a year at a flat rate of 10%.
7. Control on your investment
In the case of mutual funds, the decision pertaining to the choice of stocks and their trading is solely in the hands of the funds manager. You do not have control over which stock is to be picked and for what duration. As an investor, if you invest in Mutual Funds you do not have the option to exit from some stocks that are in your portfolio. The decisions pertaining to the fate of the stocks rest in the hands of the fund manager. This way, an individual investing in stocks has more control over their investment than an investor who invests in mutual funds.
8. Diversification
A well-diversified portfolio should include at least 25 to 30 stocks but that would be a huge ask for a small investor. With mutual funds, investors with small funds can also get a diversified portfolio. Buying units of a fund allows you to invest in multiple stocks without having to invest a huge corpus.
Talk to our investment specialist
9. Time and Research
When you invest directly, you will need to invest a lot more time and research into your stock while in the case of mutual funds you can be passive. The fund manager is the one who invests his time to manage your portfolio.
10. Investment Tracking
With an investment in mutual funds, you have the benefit of a fund manager who has extensive expertise and experience in the field. Whether it is picking the stocks or monitoring them and making allocations, you do not have to worry about any of it. This service is not available in the case of stock investments. You are responsible for picking and tracking your investment.
11. Investment Horizon
When investing in mutual funds, remember that you will have to give the funds at least 8-10 years to generate good returns as these have a longer-term growth trajectory. In the case of stocks, you can get quick and good returns if you choose the right stocks and sell them at the right time.
Despite all of this if the stock market and its intricacies are something that an individual is familiar with, they can invest directly. They must be ready to play a long term game where a stock doesn’t provide immediate returns and must also have an increased appetite for risk. Unlike investors in mutual funds, they do not have the expertise on Smart investment which fund managers can provide. Even in the best of times, investment in stocks is a risk. In comparatively tougher times, it is better to invest in mutual funds due to the advantage of portfolio diversification, professional management and constant monitoring.
The choice between mutual funds or stocks generally boils down to personal factors like trust and an individual’s ability to take risks. It is a decision to be taken with the utmost of thought with all the options carefully weighed down. However what is important for an individual is the decision to plunge into personal wealth management and attempt to make their savings useful through either mutual funds or stocks, rather than simply sitting on it.
Fund Selection Methodology used to find 3 funds
Top Equity MF investments FY 26 - 27
Fund NAV Net Assets (Cr) 3 MO (%) 6 MO (%) 1 YR (%) 3 YR (%) 5 YR (%) 2024 (%) SBI PSU Fund Growth ₹35.3653
↑ 0.08 ₹5,817 6.1 13.9 21.8 32.7 28.4 11.3 ICICI Prudential Infrastructure Fund Growth ₹195.39
↓ -0.45 ₹8,134 -1.7 2 9.7 25.3 27.7 6.7 Invesco India PSU Equity Fund Growth ₹66.66
↓ -0.26 ₹1,449 1.5 8 19.7 31.1 26.8 10.3 Note: Returns up to 1 year are on absolute basis & more than 1 year are on CAGR basis. as on 6 Feb 26 Research Highlights & Commentary of 3 Funds showcased
Commentary SBI PSU Fund ICICI Prudential Infrastructure Fund Invesco India PSU Equity Fund Point 1 Lower mid AUM (₹5,817 Cr). Highest AUM (₹8,134 Cr). Bottom quartile AUM (₹1,449 Cr). Point 2 Established history (15+ yrs). Oldest track record among peers (20 yrs). Established history (16+ yrs). Point 3 Rating: 2★ (bottom quartile). Top rated. Rating: 3★ (lower mid). Point 4 Risk profile: High. Risk profile: High. Risk profile: High. Point 5 5Y return: 28.40% (upper mid). 5Y return: 27.73% (lower mid). 5Y return: 26.81% (bottom quartile). Point 6 3Y return: 32.69% (upper mid). 3Y return: 25.28% (bottom quartile). 3Y return: 31.06% (lower mid). Point 7 1Y return: 21.79% (upper mid). 1Y return: 9.66% (bottom quartile). 1Y return: 19.66% (lower mid). Point 8 Alpha: -0.22 (lower mid). Alpha: 0.00 (upper mid). Alpha: -1.90 (bottom quartile). Point 9 Sharpe: 0.33 (upper mid). Sharpe: 0.12 (bottom quartile). Sharpe: 0.27 (lower mid). Point 10 Information ratio: -0.47 (bottom quartile). Information ratio: 0.00 (upper mid). Information ratio: -0.37 (lower mid). SBI PSU Fund
ICICI Prudential Infrastructure Fund
Invesco India PSU Equity Fund
*Below is the list of best mutual funds based on 5 year CAGR/Annualized and AUM > 100 Crore.
The objective of the scheme would be to provide investors with opportunities for long-term growth in capital along with the liquidity of an open-ended scheme through an active management of investments in a diversified basket of equity stocks of domestic Public Sector Undertakings and in debt and money market instruments issued by PSUs AND others. Research Highlights for SBI PSU Fund Below is the key information for SBI PSU Fund Returns up to 1 year are on To generate capital appreciation and income distribution to unit holders by investing predominantly in equity/equity related securities of the companies belonging to the infrastructure development and balance in debt securities and money market instruments. Research Highlights for ICICI Prudential Infrastructure Fund Below is the key information for ICICI Prudential Infrastructure Fund Returns up to 1 year are on To generate capital appreciation by investing in Equity and Equity Related Instruments of companies where the Central / State Government(s) has majority shareholding or management control or has powers to appoint majority of directors. However, there is no assurance or guarantee that the investment objective of the Scheme will be achieved. The Scheme does not assure or guarantee any returns. Research Highlights for Invesco India PSU Equity Fund Below is the key information for Invesco India PSU Equity Fund Returns up to 1 year are on 1. SBI PSU Fund
SBI PSU Fund
Growth Launch Date 7 Jul 10 NAV (06 Feb 26) ₹35.3653 ↑ 0.08 (0.22 %) Net Assets (Cr) ₹5,817 on 31 Dec 25 Category Equity - Sectoral AMC SBI Funds Management Private Limited Rating ☆☆ Risk High Expense Ratio 1.89 Sharpe Ratio 0.33 Information Ratio -0.47 Alpha Ratio -0.22 Min Investment 5,000 Min SIP Investment 500 Exit Load 0-1 Years (1%),1 Years and above(NIL) Growth of 10,000 investment over the years.
Date Value 31 Jan 21 ₹10,000 31 Jan 22 ₹14,656 31 Jan 23 ₹17,067 31 Jan 24 ₹30,032 31 Jan 25 ₹32,242 31 Jan 26 ₹38,028 Returns for SBI PSU Fund
absolute basis & more than 1 year are on CAGR (Compound Annual Growth Rate) basis. as on 6 Feb 26 Duration Returns 1 Month 2.2% 3 Month 6.1% 6 Month 13.9% 1 Year 21.8% 3 Year 32.7% 5 Year 28.4% 10 Year 15 Year Since launch 8.4% Historical performance (Yearly) on absolute basis
Year Returns 2024 11.3% 2023 23.5% 2022 54% 2021 29% 2020 32.4% 2019 -10% 2018 6% 2017 -23.8% 2016 21.9% 2015 16.2% Fund Manager information for SBI PSU Fund
Name Since Tenure Rohit Shimpi 1 Jun 24 1.59 Yr. Data below for SBI PSU Fund as on 31 Dec 25
Equity Sector Allocation
Sector Value Financial Services 35.24% Utility 29.32% Energy 13.87% Industrials 12% Basic Materials 6.69% Asset Allocation
Asset Class Value Cash 2.8% Equity 97.11% Debt 0.08% Top Securities Holdings / Portfolio
Name Holding Value Quantity State Bank of India (Financial Services)
Equity, Since 31 Jul 10 | SBIN17% ₹975 Cr 9,927,500 Bharat Electronics Ltd (Industrials)
Equity, Since 30 Jun 24 | BEL9% ₹518 Cr 12,975,000 NTPC Ltd (Utilities)
Equity, Since 31 Jul 10 | 5325559% ₹509 Cr 15,443,244
↑ 900,000 GAIL (India) Ltd (Utilities)
Equity, Since 31 May 24 | 5321559% ₹502 Cr 29,150,000
↑ 3,400,000 Power Grid Corp Of India Ltd (Utilities)
Equity, Since 31 Jul 10 | 5328988% ₹467 Cr 17,635,554
↑ 1,100,000 Bharat Petroleum Corp Ltd (Energy)
Equity, Since 31 Aug 24 | 5005476% ₹372 Cr 9,700,000 Bank of Baroda (Financial Services)
Equity, Since 31 Aug 24 | 5321346% ₹325 Cr 11,000,000 NMDC Ltd (Basic Materials)
Equity, Since 31 Oct 23 | 5263714% ₹232 Cr 27,900,000 Indian Bank (Financial Services)
Equity, Since 30 Jun 21 | 5328143% ₹203 Cr 2,427,235 Oil India Ltd (Energy)
Equity, Since 31 Mar 24 | OIL3% ₹163 Cr 3,850,000 2. ICICI Prudential Infrastructure Fund
ICICI Prudential Infrastructure Fund
Growth Launch Date 31 Aug 05 NAV (06 Feb 26) ₹195.39 ↓ -0.45 (-0.23 %) Net Assets (Cr) ₹8,134 on 31 Dec 25 Category Equity - Sectoral AMC ICICI Prudential Asset Management Company Limited Rating ☆☆☆ Risk High Expense Ratio 1.89 Sharpe Ratio 0.12 Information Ratio 0 Alpha Ratio 0 Min Investment 5,000 Min SIP Investment 100 Exit Load 0-1 Years (1%),1 Years and above(NIL) Growth of 10,000 investment over the years.
Date Value 31 Jan 21 ₹10,000 31 Jan 22 ₹16,042 31 Jan 23 ₹19,152 31 Jan 24 ₹29,825 31 Jan 25 ₹34,393 31 Jan 26 ₹36,891 Returns for ICICI Prudential Infrastructure Fund
absolute basis & more than 1 year are on CAGR (Compound Annual Growth Rate) basis. as on 6 Feb 26 Duration Returns 1 Month -2.1% 3 Month -1.7% 6 Month 2% 1 Year 9.7% 3 Year 25.3% 5 Year 27.7% 10 Year 15 Year Since launch 15.7% Historical performance (Yearly) on absolute basis
Year Returns 2024 6.7% 2023 27.4% 2022 44.6% 2021 28.8% 2020 50.1% 2019 3.6% 2018 2.6% 2017 -14% 2016 40.8% 2015 2% Fund Manager information for ICICI Prudential Infrastructure Fund
Name Since Tenure Ihab Dalwai 3 Jun 17 8.59 Yr. Sharmila D’mello 30 Jun 22 3.51 Yr. Data below for ICICI Prudential Infrastructure Fund as on 31 Dec 25
Equity Sector Allocation
Sector Value Industrials 46.72% Financial Services 13.08% Basic Materials 11.19% Utility 10.14% Energy 8.12% Real Estate 4.42% Consumer Cyclical 1.99% Communication Services 0.86% Asset Allocation
Asset Class Value Cash 3.15% Equity 96.85% Top Securities Holdings / Portfolio
Name Holding Value Quantity Larsen & Toubro Ltd (Industrials)
Equity, Since 30 Nov 09 | LT9% ₹717 Cr 1,755,704 InterGlobe Aviation Ltd (Industrials)
Equity, Since 28 Feb 23 | INDIGO7% ₹565 Cr 1,116,358
↑ 891,940 NTPC Ltd (Utilities)
Equity, Since 29 Feb 16 | 5325554% ₹342 Cr 10,376,448
↓ -600,000 Adani Ports & Special Economic Zone Ltd (Industrials)
Equity, Since 31 May 24 | ADANIPORTS3% ₹250 Cr 1,700,000
↓ -154,934 AIA Engineering Ltd (Industrials)
Equity, Since 28 Feb 21 | AIAENG3% ₹246 Cr 612,120
↓ -57,631 Reliance Industries Ltd (Energy)
Equity, Since 31 Jul 23 | RELIANCE3% ₹240 Cr 1,529,725 Kalpataru Projects International Ltd (Industrials)
Equity, Since 30 Sep 06 | KPIL3% ₹230 Cr 1,911,120
↑ 107,554 Axis Bank Ltd (Financial Services)
Equity, Since 31 Dec 20 | 5322153% ₹214 Cr 1,683,557 IndusInd Bank Ltd (Financial Services)
Equity, Since 31 Oct 24 | INDUSINDBK3% ₹209 Cr 2,424,016 NCC Ltd (Industrials)
Equity, Since 31 Aug 21 | NCC3% ₹209 Cr 13,053,905 3. Invesco India PSU Equity Fund
Invesco India PSU Equity Fund
Growth Launch Date 18 Nov 09 NAV (06 Feb 26) ₹66.66 ↓ -0.26 (-0.39 %) Net Assets (Cr) ₹1,449 on 31 Dec 25 Category Equity - Sectoral AMC Invesco Asset Management (India) Private Ltd Rating ☆☆☆ Risk High Expense Ratio 2.14 Sharpe Ratio 0.27 Information Ratio -0.37 Alpha Ratio -1.9 Min Investment 5,000 Min SIP Investment 500 Exit Load 0-1 Years (1%),1 Years and above(NIL) Growth of 10,000 investment over the years.
Date Value 31 Jan 21 ₹10,000 31 Jan 22 ₹13,872 31 Jan 23 ₹15,622 31 Jan 24 ₹26,577 31 Jan 25 ₹29,948 31 Jan 26 ₹35,297 Returns for Invesco India PSU Equity Fund
absolute basis & more than 1 year are on CAGR (Compound Annual Growth Rate) basis. as on 6 Feb 26 Duration Returns 1 Month -1.1% 3 Month 1.5% 6 Month 8% 1 Year 19.7% 3 Year 31.1% 5 Year 26.8% 10 Year 15 Year Since launch 12.4% Historical performance (Yearly) on absolute basis
Year Returns 2024 10.3% 2023 25.6% 2022 54.5% 2021 20.5% 2020 31.1% 2019 6.1% 2018 10.1% 2017 -16.9% 2016 24.3% 2015 17.9% Fund Manager information for Invesco India PSU Equity Fund
Name Since Tenure Hiten Jain 1 Jul 25 0.5 Yr. Sagar Gandhi 1 Jul 25 0.5 Yr. Data below for Invesco India PSU Equity Fund as on 31 Dec 25
Equity Sector Allocation
Sector Value Industrials 31.01% Financial Services 29.88% Utility 19.12% Energy 13.49% Basic Materials 3.52% Consumer Cyclical 1.22% Asset Allocation
Asset Class Value Cash 1.76% Equity 98.24% Top Securities Holdings / Portfolio
Name Holding Value Quantity State Bank of India (Financial Services)
Equity, Since 28 Feb 21 | SBIN9% ₹136 Cr 1,387,617
↓ -38,697 Bharat Electronics Ltd (Industrials)
Equity, Since 31 Mar 17 | BEL8% ₹120 Cr 2,997,692 Bharat Petroleum Corp Ltd (Energy)
Equity, Since 30 Sep 18 | 5005477% ₹104 Cr 2,717,009
↓ -184,556 Indian Bank (Financial Services)
Equity, Since 30 Jun 21 | 5328147% ₹97 Cr 1,157,444
↑ 76,826 NTPC Green Energy Ltd (Utilities)
Equity, Since 30 Nov 24 | NTPCGREEN6% ₹86 Cr 9,129,820
↑ 339,034 Hindustan Aeronautics Ltd Ordinary Shares (Industrials)
Equity, Since 31 May 22 | HAL6% ₹86 Cr 196,158 Bank of Baroda (Financial Services)
Equity, Since 30 Jun 21 | 5321345% ₹66 Cr 2,244,222
↑ 127,830 Bharat Dynamics Ltd Ordinary Shares (Industrials)
Equity, Since 31 May 22 | BDL5% ₹65 Cr 445,685
↑ 21,640 Dredging Corp of India Ltd (Industrials)
Equity, Since 31 Jul 25 | DREDGECORP4% ₹64 Cr 646,300 NTPC Ltd (Utilities)
Equity, Since 31 May 19 | 5325554% ₹59 Cr 1,801,543
↓ -223,420
How to Invest in Mutual Funds Online?
Open Free Investment Account for Lifetime at Fincash.com.
Complete your Registration and KYC Process
Upload Documents (PAN, Aadhaar, etc.). And, You are Ready to Invest!
All efforts have been made to ensure the information provided here is accurate. However, no guarantees are made regarding correctness of data. Please verify with scheme information document before making any investment.








Clarified my doubts