SIP Vs FD
Which is a Better Investment Option?
Individuals are always in a catch 22 situation when it comes to choosing between FD and SIP for investment. SIP is a mode of investment in Mutual Funds through which individuals can deposit small amounts at regular intervals. FD, on the other hand, is an investment avenue where people deposit a certain amount for a fixed tenure and get back the amount with interest during maturity. So, let us understand which is better between FD and SIP, SIP return calculator, Top SIP to invest, and much more.
What is a Systematic Investment Plan or SIP?
Systematic Investment plan or SIP is an investment mode in Mutual Funds which allows people to deposit small amount at regular intervals. SIP can also be referred to as a goal-based investment. SIP is one of the beauties of Mutual Funds through which people can invest as per their convenience. Through SIP people can plan to achieve many objectives like purchasing a house, purchasing a vehicle, planning for higher education, and much more. Though SIP mode of investment is available in many schemes, however, it is generally referred in the context of Equity Funds.

People can start their SIP investment with the amount as low as INR 500.
What is a Fixed Deposit or FD?
Fixed Deposit of FD refers to an investment avenue which is generally offered by banks and Post Office. In case of FD, people need to deposit a considerable amount as a one-time payment for a fixed time frame. Here, people get back their investment amount at the end of the tenure. However, people cannot break the FD during the tenure and if they try to break they need to pay some charges to the Bank. The FD income earns interest on the investment. This interest income earned is taxable in the hands of investors.
Which One to Choose?
Since SIP is an investment mode in Mutual Funds while FD is an investment avenue it itself; both of them show different characteristics. So, let us understand the differences between both of them.
Minimum Investment
The minimum investment in Mutual Funds through SIP mode of investment starts with INR 500. Therefore, it can be ensured that it does not pinch people’s pockets much. Moreover, the frequency of SIP can also be set as monthly or quarterly as per people’s convenience. On the other hand, in FD the minimum investment amount ranges between INR 1,000-10,0000. Since FD investment is through lump sum mode, therefore, people do not keep on Investing the amount.
Tenure
FDs being a traditional investment avenue are considered for both short-term and long-term investment. The tenure of FD can be 6 months, 1 year and can go up to 5 years. On the contrary, SIP is generally chosen for long-term investment. Since SIP is generally referred in the context of equity funds, the long-term investment would help you to earn maximum revenues. In addition, people can enjoy maximum benefits if they are held longer.
Returns
The returns on FD is fixed in the form of interest which does not change over a period of time. For the Financial Year 2017-18, the FD rates range between 6%-7% approximately if the investment is kept for one year. On the contrary, in case of SIP, the returns are not fixed as the returns are dependent on the performance of the underlying equity shares. However, if the Mutual Funds are held for a period of more than five years have given historical returns of more than 15%.
Talk to our investment specialist
Risk Appetite
The risk-appetite of FD is considered to be less as compared to SIP. FDs are generally offered by banks. On the other hand, the risk appetite of SIP is more than the FD. However, if the SIP is held for a longer-tenure, the probabilities of loss reduces.
Liquidity
The liquidity in case of SIP is more as compared to FD. In case of SIP, if people redeem their investment they can get the money back in T+3 days for equity funds. However, in case of debt funds, the settlement period is T+1 days. However, in case of fixed deposits, it is not easy to redeem it. Even if people try for premature withdrawals, they need to pay some charges to the bank.
Taxation
The taxation rules in case of Mutual Funds and FDs both are different. In case of FDs, for the Financial year 2017-18, the interest earned is charged as per the individual’s regular tax slabs. However, as SIP is generally with respect to equity funds, therefore the tax rules related to equity funds are explained as follows.
For the Financial Year 2017-18, if the equity funds are sold after one year from the date of purchase, they are applicable for long-term Capital Gains which is not taxable. However, if these funds are sold before one year from the date of purchase then; it is subject to short-term capital gain which is charged at a flat rate of 15% irrespective of the individual’s tax slab.
Characteristics
SIP has a lot of features such as rupee cost averaging, the Power of Compounding, and so on, which is not available in case of an FD. So, let us see what do these characteristics mean.
1. Rupee Cost Averaging
In case of SIP, people invest in Mutual Fund units at regular time periods when the markets are showing different price behaviour. Therefore, when the markets are showing a downtrend, people can purchase more units and vice versa. Therefore, the purchase price of units gets averaged out due to SIP. However, in case of FD, this feature is not available as the amount is deposited for only one time.
2. Power of Compounding
SIP is applicable to compounding. Compounding refers to the compound interest where the interest amount is calculated on the principal amount and already accumulated interest. In case of FD, the interest amount is also subject to compounding.
3. Disciplined Savings Habit
SIP develops disciplined savings habit among individuals as people need to deposit money at regular intervals. On the contrary, in FD as people deposit the money only once, they may or may not develop a disciplined savings habit.
The table given below summarizes the differences between SIP and Fixed Deposits.
| Parameters | SIP | Fixed Deposits |
|---|---|---|
| Returns | Varies as per the Fund’s performance | Predetermined |
| Minimum Investment | Starts from INR 500 | Ranges between INR 1,000 – 10,000 |
| Tenure | Generally used for long-term | Both Short and Long-term tenure |
| Risk | High | Low |
| Liquidity | High | Low |
| Taxation | Short-term: Taxed at a Flat Rate of 15% Long-term: Not Taxed | Taxed as per individual’s slab rates |
| Features | Rupee Cost Averaging, Power of Compounding, & Disciplined Savings Habit | Power of Compounding |
Fund Selection Methodology used to find 5 funds
Best SIP to Invest for FY 26 - 27
Fund NAV Net Assets (Cr) Min SIP Investment 3 MO (%) 6 MO (%) 1 YR (%) 3 YR (%) 5 YR (%) 2024 (%) DSP Natural Resources and New Energy Fund Growth ₹105.693
↑ 0.13 ₹2,401 500 -5.6 2.5 17.7 19 15.5 17.5 Aditya Birla Sun Life Small Cap Fund Growth ₹95.4591
↓ -0.63 ₹5,731 1,000 7.7 17.3 11.3 15.1 12.6 -3.7 Invesco India Growth Opportunities Fund Growth ₹109.44
↓ -0.11 ₹11,164 100 10.2 15.1 8.2 23 17.4 4.7 Aditya Birla Sun Life Banking And Financial Services Fund Growth ₹62.75
↓ -0.07 ₹3,676 1,000 2.1 -1 4 10.4 11.4 17.5 Kotak Equity Opportunities Fund Growth ₹350.536
↓ -0.78 ₹31,263 1,000 1.8 0.6 3.8 13.9 14.1 5.6 Note: Returns up to 1 year are on absolute basis & more than 1 year are on CAGR basis. as on 27 Jul 26 Research Highlights & Commentary of 5 Funds showcased
Commentary DSP Natural Resources and New Energy Fund Aditya Birla Sun Life Small Cap Fund Invesco India Growth Opportunities Fund Aditya Birla Sun Life Banking And Financial Services Fund Kotak Equity Opportunities Fund Point 1 Bottom quartile AUM (₹2,401 Cr). Lower mid AUM (₹5,731 Cr). Upper mid AUM (₹11,164 Cr). Bottom quartile AUM (₹3,676 Cr). Highest AUM (₹31,263 Cr). Point 2 Established history (18+ yrs). Established history (19+ yrs). Established history (18+ yrs). Established history (12+ yrs). Oldest track record among peers (21 yrs). Point 3 Top rated. Rating: 5★ (upper mid). Rating: 5★ (lower mid). Rating: 5★ (bottom quartile). Rating: 5★ (bottom quartile). Point 4 Risk profile: High. Risk profile: Moderately High. Risk profile: Moderately High. Risk profile: High. Risk profile: Moderately High. Point 5 5Y return: 15.53% (upper mid). 5Y return: 12.57% (bottom quartile). 5Y return: 17.44% (top quartile). 5Y return: 11.42% (bottom quartile). 5Y return: 14.05% (lower mid). Point 6 3Y return: 19.00% (upper mid). 3Y return: 15.09% (lower mid). 3Y return: 23.04% (top quartile). 3Y return: 10.36% (bottom quartile). 3Y return: 13.88% (bottom quartile). Point 7 1Y return: 17.72% (top quartile). 1Y return: 11.28% (upper mid). 1Y return: 8.24% (lower mid). 1Y return: 3.98% (bottom quartile). 1Y return: 3.83% (bottom quartile). Point 8 Alpha: 0.00 (bottom quartile). Alpha: 0.00 (bottom quartile). Alpha: 6.78 (top quartile). Alpha: 3.47 (upper mid). Alpha: 0.20 (lower mid). Point 9 Sharpe: 0.72 (top quartile). Sharpe: 0.22 (upper mid). Sharpe: 0.12 (lower mid). Sharpe: -0.06 (bottom quartile). Sharpe: -0.19 (bottom quartile). Point 10 Information ratio: 0.00 (lower mid). Information ratio: 0.00 (bottom quartile). Information ratio: 1.15 (top quartile). Information ratio: 0.24 (upper mid). Information ratio: -0.05 (bottom quartile). DSP Natural Resources and New Energy Fund
Aditya Birla Sun Life Small Cap Fund
Invesco India Growth Opportunities Fund
Aditya Birla Sun Life Banking And Financial Services Fund
Kotak Equity Opportunities Fund
To seek to generate capital appreciation and provide long term growth opportunities by investing in equity and equity related securities of companies domiciled in India whose predominant economic activity is in the (a) discovery, development, production, or distribution of natural resources, viz., energy, mining etc; (b) alternative energy and energy technology sectors, with emphasis given to renewable energy, automotive and on-site power generation, energy storage and enabling energy technologies. also invest a certain portion of its corpus in the equity and equity related securities of companies domiciled overseas, which are principally engaged in the discovery, development, production or distribution of natural resources and alternative energy and/or the units shares of Merrill Lynch international Investment Funds New Energy Fund, Merrill Lynch International Investment Funds World Energy Fund and similar other overseas mutual fund schemes. Below is the key information for DSP Natural Resources and New Energy Fund Returns up to 1 year are on (Erstwhile Aditya Birla Sun Life Small & Midcap Fund) An Open ended Small and Mid Cap Equity Scheme with an objective to generate consistent long-term capital appreciation by investing predominantly in equity and equity related securities of companies considered to be small and midcap. The Scheme may also invest a certain portion of its corpus in fixed income securities including money market instruments, in order to meet liquidity requirements from time to time. Research Highlights for Aditya Birla Sun Life Small Cap Fund Below is the key information for Aditya Birla Sun Life Small Cap Fund Returns up to 1 year are on (Erstwhile Invesco India Growth Fund) The investment objective of the Scheme is to generate long-term capital growth from a diversified portfolio of predominantly equity and equity-related securities. However, there can be no assurance that the objectives of the scheme will be achieved. Research Highlights for Invesco India Growth Opportunities Fund Below is the key information for Invesco India Growth Opportunities Fund Returns up to 1 year are on The primary investment objective of the Scheme is to generate long-term capital appreciation to unit holders from a portfolio that is invested predominantly in equity and equity related securities of companies engaged in banking and financial services. The Scheme does not guarantee/indicate any returns. There can be no assurance that the schemes’ objectives will be achieved. Research Highlights for Aditya Birla Sun Life Banking And Financial Services Fund Below is the key information for Aditya Birla Sun Life Banking And Financial Services Fund Returns up to 1 year are on (Erstwhile Kotak Opportunities Scheme) To generate capital appreciation from a diversified portfolio of equity and equity
related securities. However, there is no assurance that the objective of the scheme will be realized. Research Highlights for Kotak Equity Opportunities Fund Below is the key information for Kotak Equity Opportunities Fund Returns up to 1 year are on 1. DSP Natural Resources and New Energy Fund
DSP Natural Resources and New Energy Fund
Growth Launch Date 25 Apr 08 NAV (27 Jul 26) ₹105.693 ↑ 0.13 (0.12 %) Net Assets (Cr) ₹2,401 on 30 Jun 26 Category Equity - Sectoral AMC DSP BlackRock Invmt Managers Pvt. Ltd. Rating ☆☆☆☆☆ Risk High Expense Ratio 1.99 Sharpe Ratio 0.72 Information Ratio 0 Alpha Ratio 0 Min Investment 1,000 Min SIP Investment 500 Exit Load 0-12 Months (1%),12 Months and above(NIL) Growth of 10,000 investment over the years.
Date Value 30 Jun 21 ₹10,000 30 Jun 22 ₹9,075 30 Jun 23 ₹11,543 30 Jun 24 ₹18,057 30 Jun 25 ₹17,551 30 Jun 26 ₹20,524 Returns for DSP Natural Resources and New Energy Fund
absolute basis & more than 1 year are on CAGR (Compound Annual Growth Rate) basis. as on 27 Jul 26 Duration Returns 1 Month 0.2% 3 Month -5.6% 6 Month 2.5% 1 Year 17.7% 3 Year 19% 5 Year 15.5% 10 Year 15 Year Since launch 13.8% Historical performance (Yearly) on absolute basis
Year Returns 2024 17.5% 2023 13.9% 2022 31.2% 2021 9.8% 2020 42.8% 2019 11.5% 2018 4.4% 2017 -15.3% 2016 43.1% 2015 43.1% Fund Manager information for DSP Natural Resources and New Energy Fund
Name Since Tenure Rohit Singhania 1 Jul 12 14.01 Yr. Data below for DSP Natural Resources and New Energy Fund as on 30 Jun 26
Equity Sector Allocation
Sector Value Energy 48.2% Basic Materials 31.91% Utility 6.09% Industrials 1.57% Technology 0.89% Consumer Cyclical 0.03% Asset Allocation
Asset Class Value Cash 11.3% Equity 88.7% Debt 0% Top Securities Holdings / Portfolio
Name Holding Value Quantity BGF World Energy I2
Investment Fund | -9% ₹226 Cr 602,478 Jindal Steel Ltd (Basic Materials)
Equity, Since 31 Mar 20 | JINDALSTEL7% ₹182 Cr 1,511,761 Tata Steel Ltd (Basic Materials)
Equity, Since 31 Aug 16 | TATASTEEL7% ₹177 Cr 8,510,930
↓ -1,145,482 Bharat Petroleum Corp Ltd (Energy)
Equity, Since 31 Aug 08 | BPCL7% ₹176 Cr 5,912,435
↑ 2,432,211 Hindustan Petroleum Corp Ltd (Energy)
Equity, Since 31 Aug 13 | HINDPETRO6% ₹142 Cr 3,602,448
↑ 2,042,352 Indian Oil Corp Ltd (Energy)
Equity, Since 31 May 25 | IOC6% ₹140 Cr 9,973,891
↑ 3,105,589 Oil & Natural Gas Corp Ltd (Energy)
Equity, Since 31 May 20 | ONGC6% ₹136 Cr 5,107,299
↓ -798,433 Hindustan Zinc Ltd (Basic Materials)
Equity, Since 31 Mar 09 | HINDZINC5% ₹118 Cr 1,866,806 Hindalco Industries Ltd (Basic Materials)
Equity, Since 31 Oct 15 | HINDALCO5% ₹114 Cr 1,008,716 Reliance Industries Ltd (Energy)
Equity, Since 31 Aug 08 | RELIANCE4% ₹106 Cr 800,748
↑ 442,666 2. Aditya Birla Sun Life Small Cap Fund
Aditya Birla Sun Life Small Cap Fund
Growth Launch Date 31 May 07 NAV (28 Jul 26) ₹95.4591 ↓ -0.63 (-0.66 %) Net Assets (Cr) ₹5,731 on 30 Jun 26 Category Equity - Small Cap AMC Birla Sun Life Asset Management Co Ltd Rating ☆☆☆☆☆ Risk Moderately High Expense Ratio 1.89 Sharpe Ratio 0.22 Information Ratio 0 Alpha Ratio 0 Min Investment 1,000 Min SIP Investment 1,000 Exit Load 0-365 Days (1%),365 Days and above(NIL) Growth of 10,000 investment over the years.
Date Value 30 Jun 21 ₹10,000 30 Jun 22 ₹9,211 30 Jun 23 ₹11,875 30 Jun 24 ₹17,289 30 Jun 25 ₹17,534 30 Jun 26 ₹19,028 Returns for Aditya Birla Sun Life Small Cap Fund
absolute basis & more than 1 year are on CAGR (Compound Annual Growth Rate) basis. as on 27 Jul 26 Duration Returns 1 Month 1.3% 3 Month 7.7% 6 Month 17.3% 1 Year 11.3% 3 Year 15.1% 5 Year 12.6% 10 Year 15 Year Since launch 12.4% Historical performance (Yearly) on absolute basis
Year Returns 2024 -3.7% 2023 21.5% 2022 39.4% 2021 -6.5% 2020 51.4% 2019 19.8% 2018 -11.5% 2017 -22.6% 2016 56.7% 2015 9.7% Fund Manager information for Aditya Birla Sun Life Small Cap Fund
Name Since Tenure Abhinav Khandelwal 31 Oct 24 1.67 Yr. Dhaval Joshi 21 Nov 22 3.61 Yr. Data below for Aditya Birla Sun Life Small Cap Fund as on 30 Jun 26
Equity Sector Allocation
Sector Value Financial Services 20.62% Consumer Cyclical 17.55% Industrials 14.54% Health Care 12.54% Basic Materials 12.37% Consumer Defensive 8.35% Real Estate 3.63% Technology 3.07% Utility 1.47% Communication Services 0.77% Asset Allocation
Asset Class Value Cash 5.08% Equity 94.92% Top Securities Holdings / Portfolio
Name Holding Value Quantity Navin Fluorine International Ltd (Basic Materials)
Equity, Since 31 Jul 20 | NAVINFLUOR3% ₹164 Cr 230,000 Sai Life Sciences Ltd (Healthcare)
Equity, Since 30 Jun 25 | SAILIFE3% ₹149 Cr 1,286,665 TD Power Systems Ltd (Industrials)
Equity, Since 30 Jun 23 | TDPOWERSYS3% ₹145 Cr 1,096,068
↓ -216,876 Multi Commodity Exchange of India Ltd (Financial Services)
Equity, Since 31 Dec 24 | MCX3% ₹141 Cr 478,000 Arvind Ltd (Consumer Cyclical)
Equity, Since 30 Nov 24 | ARVIND2% ₹129 Cr 2,726,165
↑ 84,152 Radico Khaitan Ltd (Consumer Defensive)
Equity, Since 31 May 20 | RADICO2% ₹115 Cr 327,373 CCL Products (India) Ltd (Consumer Defensive)
Equity, Since 31 May 20 | CCL2% ₹112 Cr 1,060,480 PNB Housing Finance Ltd (Financial Services)
Equity, Since 31 Aug 24 | PNBHOUSING2% ₹111 Cr 1,081,130 Shaily Engineering Plastics Ltd (Basic Materials)
Equity, Since 31 Oct 25 | 5014232% ₹108 Cr 361,012
↑ 1,012 Ujjivan Small Finance Bank Ltd Ordinary Shares (Financial Services)
Equity, Since 31 Mar 25 | 5429042% ₹103 Cr 18,907,129
↑ 1,800,000 3. Invesco India Growth Opportunities Fund
Invesco India Growth Opportunities Fund
Growth Launch Date 9 Aug 07 NAV (28 Jul 26) ₹109.44 ↓ -0.11 (-0.10 %) Net Assets (Cr) ₹11,164 on 30 Jun 26 Category Equity - Large & Mid Cap AMC Invesco Asset Management (India) Private Ltd Rating ☆☆☆☆☆ Risk Moderately High Expense Ratio 1.82 Sharpe Ratio 0.12 Information Ratio 1.15 Alpha Ratio 6.78 Min Investment 5,000 Min SIP Investment 100 Exit Load 0-1 Years (1%),1 Years and above(NIL) Growth of 10,000 investment over the years.
Date Value 30 Jun 21 ₹10,000 30 Jun 22 ₹9,616 30 Jun 23 ₹12,058 30 Jun 24 ₹18,524 30 Jun 25 ₹21,406 30 Jun 26 ₹22,689 Returns for Invesco India Growth Opportunities Fund
absolute basis & more than 1 year are on CAGR (Compound Annual Growth Rate) basis. as on 27 Jul 26 Duration Returns 1 Month 1.8% 3 Month 10.2% 6 Month 15.1% 1 Year 8.2% 3 Year 23% 5 Year 17.4% 10 Year 15 Year Since launch 13.4% Historical performance (Yearly) on absolute basis
Year Returns 2024 4.7% 2023 37.5% 2022 31.6% 2021 -0.4% 2020 29.7% 2019 13.3% 2018 10.7% 2017 -0.2% 2016 39.6% 2015 3.3% Fund Manager information for Invesco India Growth Opportunities Fund
Name Since Tenure Aditya Khemani 9 Nov 23 2.64 Yr. Data below for Invesco India Growth Opportunities Fund as on 30 Jun 26
Equity Sector Allocation
Sector Value Financial Services 26.21% Health Care 18.9% Industrials 18.79% Consumer Cyclical 17.87% Real Estate 7.6% Basic Materials 4.07% Technology 2.71% Communication Services 1.71% Utility 1.37% Asset Allocation
Asset Class Value Cash 0.76% Equity 99.23% Top Securities Holdings / Portfolio
Name Holding Value Quantity Max Healthcare Institute Ltd Ordinary Shares (Healthcare)
Equity, Since 30 Nov 22 | MAXHEALTH7% ₹687 Cr 7,118,724
↑ 170,000 Eternal Ltd (Consumer Cyclical)
Equity, Since 30 Jun 23 | ETERNAL7% ₹684 Cr 27,307,479
↑ 2,577,787 InterGlobe Aviation Ltd (Industrials)
Equity, Since 31 Mar 24 | INDIGO6% ₹654 Cr 1,484,863
↑ 95,086 ICICI Bank Ltd (Financial Services)
Equity, Since 31 Dec 15 | ICICIBANK6% ₹646 Cr 5,141,398
↑ 511,565 Sai Life Sciences Ltd (Healthcare)
Equity, Since 31 Dec 24 | SAILIFE5% ₹497 Cr 4,283,799 Trent Ltd (Consumer Cyclical)
Equity, Since 28 Feb 22 | TRENT5% ₹460 Cr 1,089,122 Prestige Estates Projects Ltd (Real Estate)
Equity, Since 31 Dec 23 | PRESTIGE4% ₹452 Cr 3,304,450
↑ 174,545 ABB India Ltd (Industrials)
Equity, Since 30 Jun 23 | ABB4% ₹441 Cr 608,622
↑ 143,577 BSE Ltd (Financial Services)
Equity, Since 31 Oct 23 | BSE4% ₹396 Cr 955,364
↓ -149,234 L&T Finance Ltd (Financial Services)
Equity, Since 30 Apr 24 | LTF3% ₹325 Cr 11,339,315 4. Aditya Birla Sun Life Banking And Financial Services Fund
Aditya Birla Sun Life Banking And Financial Services Fund
Growth Launch Date 14 Dec 13 NAV (28 Jul 26) ₹62.75 ↓ -0.07 (-0.11 %) Net Assets (Cr) ₹3,676 on 30 Jun 26 Category Equity - Sectoral AMC Birla Sun Life Asset Management Co Ltd Rating ☆☆☆☆☆ Risk High Expense Ratio 1.99 Sharpe Ratio -0.06 Information Ratio 0.24 Alpha Ratio 3.47 Min Investment 1,000 Min SIP Investment 1,000 Exit Load 0-365 Days (1%),365 Days and above(NIL) Growth of 10,000 investment over the years.
Date Value 30 Jun 21 ₹10,000 30 Jun 22 ₹9,160 30 Jun 23 ₹12,518 30 Jun 24 ₹15,626 30 Jun 25 ₹17,373 30 Jun 26 ₹17,691 Returns for Aditya Birla Sun Life Banking And Financial Services Fund
absolute basis & more than 1 year are on CAGR (Compound Annual Growth Rate) basis. as on 27 Jul 26 Duration Returns 1 Month -1.3% 3 Month 2.1% 6 Month -1% 1 Year 4% 3 Year 10.4% 5 Year 11.4% 10 Year 15 Year Since launch 15.7% Historical performance (Yearly) on absolute basis
Year Returns 2024 17.5% 2023 8.7% 2022 21.7% 2021 11.5% 2020 16.8% 2019 1.1% 2018 14.9% 2017 -2.4% 2016 47.6% 2015 15.7% Fund Manager information for Aditya Birla Sun Life Banking And Financial Services Fund
Name Since Tenure Dhaval Gala 26 Aug 15 10.85 Yr. Data below for Aditya Birla Sun Life Banking And Financial Services Fund as on 30 Jun 26
Equity Sector Allocation
Sector Value Financial Services 95.86% Technology 1.2% Asset Allocation
Asset Class Value Cash 2.2% Equity 97.8% Top Securities Holdings / Portfolio
Name Holding Value Quantity ICICI Bank Ltd (Financial Services)
Equity, Since 31 Dec 13 | ICICIBANK13% ₹467 Cr 3,717,929 HDFC Bank Ltd (Financial Services)
Equity, Since 31 Dec 13 | HDFCBANK11% ₹377 Cr 5,058,496
↓ -350,000 Axis Bank Ltd (Financial Services)
Equity, Since 31 Oct 18 | AXISBANK9% ₹296 Cr 2,302,100 Bajaj Finance Ltd (Financial Services)
Equity, Since 30 Sep 16 | BAJFINANCE6% ₹194 Cr 2,137,250 State Bank of India (Financial Services)
Equity, Since 31 Oct 17 | SBIN5% ₹185 Cr 1,918,689 Shriram Finance Ltd (Financial Services)
Equity, Since 30 Jun 23 | SHRIRAMFIN5% ₹179 Cr 1,886,669 Kotak Mahindra Bank Ltd (Financial Services)
Equity, Since 31 Jan 19 | KOTAKBANK4% ₹129 Cr 3,346,665
↓ -200,000 AU Small Finance Bank Ltd (Financial Services)
Equity, Since 30 Nov 23 | AUBANK3% ₹103 Cr 1,046,861
↓ -300,000 Bank of Maharashtra (Financial Services)
Equity, Since 31 Dec 25 | MAHABANK3% ₹99 Cr 12,546,499 SBI Life Insurance Co Ltd (Financial Services)
Equity, Since 31 Mar 21 | SBILIFE3% ₹98 Cr 533,402 5. Kotak Equity Opportunities Fund
Kotak Equity Opportunities Fund
Growth Launch Date 9 Sep 04 NAV (28 Jul 26) ₹350.536 ↓ -0.78 (-0.22 %) Net Assets (Cr) ₹31,263 on 30 Jun 26 Category Equity - Large & Mid Cap AMC Kotak Mahindra Asset Management Co Ltd Rating ☆☆☆☆☆ Risk Moderately High Expense Ratio 1.6 Sharpe Ratio -0.19 Information Ratio -0.05 Alpha Ratio 0.2 Min Investment 5,000 Min SIP Investment 1,000 Exit Load 0-1 Years (1%),1 Years and above(NIL) Growth of 10,000 investment over the years.
Date Value 30 Jun 21 ₹10,000 30 Jun 22 ₹10,006 30 Jun 23 ₹12,789 30 Jun 24 ₹18,697 30 Jun 25 ₹19,334 30 Jun 26 ₹19,499 Returns for Kotak Equity Opportunities Fund
absolute basis & more than 1 year are on CAGR (Compound Annual Growth Rate) basis. as on 27 Jul 26 Duration Returns 1 Month 0.5% 3 Month 1.8% 6 Month 0.6% 1 Year 3.8% 3 Year 13.9% 5 Year 14.1% 10 Year 15 Year Since launch 17.7% Historical performance (Yearly) on absolute basis
Year Returns 2024 5.6% 2023 24.2% 2022 29.3% 2021 7% 2020 30.4% 2019 16.5% 2018 13.2% 2017 -5.6% 2016 34.9% 2015 9.6% Fund Manager information for Kotak Equity Opportunities Fund
Name Since Tenure Harsha Upadhyaya 4 Aug 12 13.91 Yr. Data below for Kotak Equity Opportunities Fund as on 30 Jun 26
Equity Sector Allocation
Sector Value Financial Services 30.64% Industrials 17.25% Consumer Cyclical 11.9% Basic Materials 11.28% Health Care 7.78% Technology 6.76% Energy 4.8% Utility 3.62% Communication Services 2.71% Consumer Defensive 0.92% Real Estate 0.79% Asset Allocation
Asset Class Value Cash 1.11% Equity 98.89% Other 0% Top Securities Holdings / Portfolio
Name Holding Value Quantity HDFC Bank Ltd (Financial Services)
Equity, Since 31 Jul 23 | HDFCBANK5% ₹1,452 Cr 19,500,000 State Bank of India (Financial Services)
Equity, Since 28 Feb 21 | SBIN4% ₹1,206 Cr 12,500,000 Bharat Electronics Ltd (Industrials)
Equity, Since 31 Oct 18 | BEL4% ₹1,150 Cr 28,000,000 Eternal Ltd (Consumer Cyclical)
Equity, Since 31 Aug 23 | ETERNAL3% ₹902 Cr 36,000,000 ICICI Bank Ltd (Financial Services)
Equity, Since 30 Sep 10 | ICICIBANK3% ₹879 Cr 7,000,000 BSE Ltd (Financial Services)
Equity, Since 30 Nov 25 | BSE3% ₹829 Cr 2,000,000 Axis Bank Ltd (Financial Services)
Equity, Since 31 Oct 12 | AXISBANK3% ₹798 Cr 6,200,000 Larsen & Toubro Ltd (Industrials)
Equity, Since 30 Sep 13 | LT3% ₹754 Cr 1,850,000 Bharti Airtel Ltd (Communication Services)
Equity, Since 28 Feb 21 | BHARTIARTL2% ₹695 Cr 3,800,000 Bharat Forge Ltd (Consumer Cyclical)
Equity, Since 31 Dec 20 | BHARATFORG2% ₹665 Cr 3,400,000
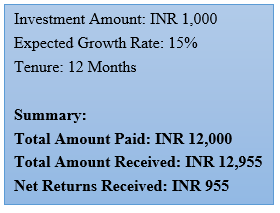
SIP Return Calculator
The returns of SIP keep on varying. However, assuming the historical rate of returns being 15%, let’s see how the SIP investment of INR 1,000 grows over a period of 12 months.
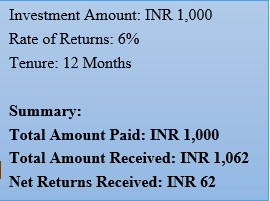
FD Calculator
The FD rates also keep on varying from bank to banks. However, assuming the interest rate to be 6%, let us see how the FD will perform over a period of 12 months if the investment amount is INR 1,000.
How to Invest in MF SIP Online?
Open Free Investment Account for Lifetime at Fincash.com.
Complete your Registration and KYC Process
Upload Documents (PAN, Aadhaar, etc.). And, You are Ready to Invest!
Conclusion: SIP or FD
To conclude, it can be said that SIP has more advantages as compared to FD. However, it is always advised to people that they understand a scheme’s functioning completely before investing. In addition, they can even consult a personal financial advisor to ensure that their investment is safe and their objectives are met.
All efforts have been made to ensure the information provided here is accurate. However, no guarantees are made regarding correctness of data. Please verify with scheme information document before making any investment.


")

AMFI Registration No. 112358 | CIN: U74999MH2016PTC282153
Shepard Technologies Pvt. Ltd. (with ARN code 112358) makes no warranties or representations, express or implied, on products offered through the platform. It accepts no liability for any damages or losses, however caused, in connection with the use of, or on the reliance of its product or related services. Terms and conditions of the website are applicable.
©2026 Shepard Technologies Private Limited. All Rights Reserved
Research Highlights for DSP Natural Resources and New Energy Fund