SIP vs RD
Which is Better Investment Option?
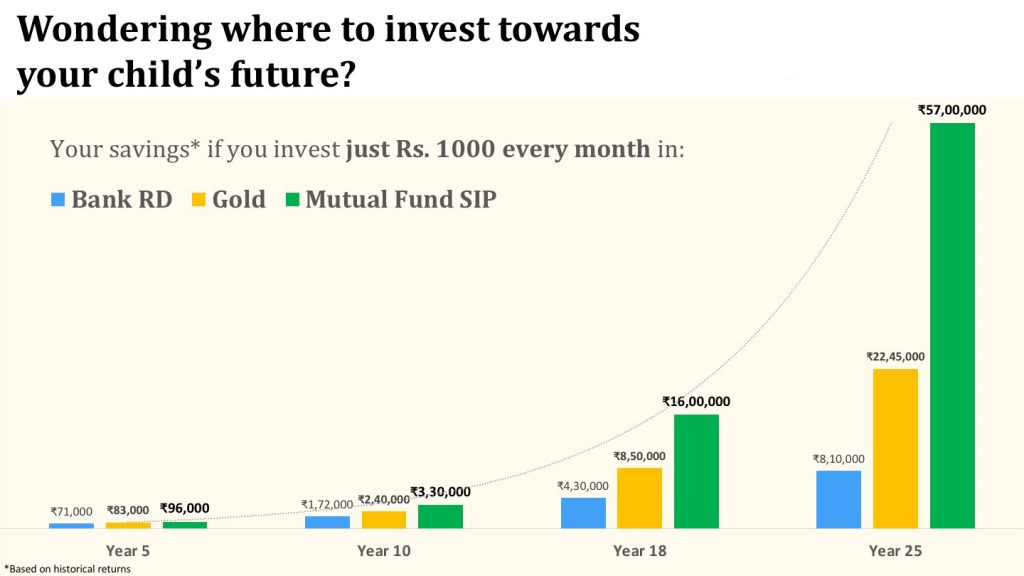
SIP vs RD? where to invest for better wealth creation? An ultimate approach to generate wealth is saving money every month. Typically, a Systematic Investment plan (SIP) and an RD (Recurring deposit) are two of the most efficient investment options in India to save money every month. Both SIP and RD enable investors to invest small sums of money in regular intervals to earn good returns. With a Systematic Investment Plan (SIP), the investors have to invest a small amount of money, either monthly or quarterly, to earn market-linked returns. While with an RD (Recurring Deposit), the investor invests fixed amount of money for a pre-decided period to yield fixed returns. Now, the investors can easily calculate SIP returns using a sip calculator and RD returns using an RD Calculator to estimate their investment needs.
In India, few of the most convenient periodic investment options include SIP, RD and PPF (SIP being the most popular one).
SIP Vs RD - Product Structure
Systematic Investment Plan (SIP)
A SIP is an Investing mode to invest a certain amount in Mutual Funds periodically. The minimum amount to invest in a Systematic Investment Plan is as less as INR 500. Usually, SIPs in equity are said to offer good returns because they are market linked and can give return commensurate to the market. As per various sources, the SIP returns over long periods can be as high as 12% to 22% p.a., which is much higher than the interest rates offered by an RD (Recurring Deposit). The only disadvantage of a SIP (Systematic Investment Plan) is that the SIP returns are volatile since they are market-linked, so the risk factor is much higher. However, when invested for long-term, SIPs are considered to offer good returns.
Recurring Deposit (RD)
A Recurring Deposit or RD is an investment scheme in which the investor has to choose an investment amount and the tenure of investment before investing. Under an RD, the investor has to invest monthly over the selected tenure to earn some interest and the invested amount. Generally, the interest rate of RD varies from 7% to 9% p.a. and is consequently higher for senior citizens. The RD return rate is much less than a Fixed Deposit and SIP because an RD earns interest of the entire 12 months only on the first deposit. On the second deposit in an RD, the interest is earned for 11 months, on the third deposit for 10 months and so on. So, there are no compounding benefits in an RD, unlike FD and SIP. The RD returns are fixed and can be calculated easily using an RD calculator. The major disadvantage of a Recurring Deposit is that it is not tax efficient. TDS (Tax Deducted at Source) is applicable on the interest income from RD.
Talk to our investment specialist
Fund Selection Methodology used to find 7 funds
Top 7 Performing Balanced Fund SIP
As Balanced Fund have less riskier than Equity Mutual Funds, Balanced Funds can give stable returns over extended period of time. List of funds below are based on last 3 Years annualized returns (CAGR) and funds having net assets over 500 Crore & Fund Age > 3 years.
(Erstwhile BOI AXA Mid Cap Equity And Debt Fund) The scheme's objective is to provide capital appreciation and income distribution to investors from a portfolio constituting of mid cap equity and equity related securities as well as fixed income securities.However there can be no assurance that the investment objectives of the Scheme will be realized Below is the key information for BOI AXA Mid and Small Cap Equity and Debt Fund Returns up to 1 year are on (Erstwhile ICICI Prudential Dynamic Plan) To generate capital appreciation by actively investing in equity and equity related securities. For defensive considerations, the Scheme may invest in debt, money market instruments and derivatives. The investment manager will have the discretion to take aggressive asset calls i.e. by staying 100% invested in equity market/equity related instruments at a given point of time and 0% at another, in which case, the fund may be invested in debt related instruments at its discretion. The AMC may choose to churn the portfolio of the Scheme in order to achieve the investment objective. The Scheme is suitable for investors seeking high returns and for those who are willing to take commensurate risks. Research Highlights for ICICI Prudential Multi-Asset Fund Below is the key information for ICICI Prudential Multi-Asset Fund Returns up to 1 year are on (Erstwhile SBI Magnum Monthly Income Plan Floater) To provide regular income, liquidity and attractive returns to investors in addition
to mitigating the impact of interest rate risk through an actively managed
portfolio of floating rate and fixed rate debt instruments, equity, money market
instruments and derivatives. Research Highlights for SBI Multi Asset Allocation Fund Below is the key information for SBI Multi Asset Allocation Fund Returns up to 1 year are on (Erstwhile Sundaram Balanced Fund) The scheme seeks to generate capital appreciation and current income through a judicious mix of investments in equities and fixed income securities. Research Highlights for Sundaram Equity Hybrid Fund Below is the key information for Sundaram Equity Hybrid Fund Returns up to 1 year are on (Erstwhile ICICI Prudential Balanced Fund) To generate long term capital appreciation and current income from a portfolio
that is invested in equity and equity related securities as well as in fixed income
securities. Research Highlights for ICICI Prudential Equity and Debt Fund Below is the key information for ICICI Prudential Equity and Debt Fund Returns up to 1 year are on (Erstwhile UTI Wealth Builder Fund) The objective of the Scheme is to achieve long term capital appreciation by investing predominantly in a diversified portfolio of equity and equity related instruments along with investments in Gold ETFs and Debt and Money Market Instruments. However, there can be no assurance that the investment objective of the Scheme will be achieved. Research Highlights for UTI Multi Asset Fund Below is the key information for UTI Multi Asset Fund Returns up to 1 year are on (Erstwhile IDFC Balanced Fund) The Fund seeks to generate long term capital appreciation along with current income by investing in a mix of equity and equity related securities, debt securities and money market instruments. There is no assurance or guarantee that the objectives of the scheme will be realised. Research Highlights for Bandhan Hybrid Equity Fund Below is the key information for Bandhan Hybrid Equity Fund Returns up to 1 year are on 1. BOI AXA Mid and Small Cap Equity and Debt Fund
BOI AXA Mid and Small Cap Equity and Debt Fund
Growth Launch Date 20 Jul 16 NAV (13 Jul 26) ₹42.03 ↑ 0.13 (0.31 %) Net Assets (Cr) ₹1,482 on 30 Apr 26 Category Hybrid - Hybrid Equity AMC BOI AXA Investment Mngrs Private Ltd Rating Risk Moderately High Expense Ratio 2.27 Sharpe Ratio 0.5 Information Ratio 0 Alpha Ratio 0 Min Investment 5,000 Min SIP Investment 1,000 Exit Load 0-1 Years (1%),1 Years and above(NIL) Growth of 10,000 investment over the years.
Date Value 30 Jun 21 ₹10,000 30 Jun 22 ₹9,742 30 Jun 23 ₹12,045 30 Jun 24 ₹18,301 30 Jun 25 ₹18,914 30 Jun 26 ₹20,302 Returns for BOI AXA Mid and Small Cap Equity and Debt Fund
absolute basis & more than 1 year are on CAGR (Compound Annual Growth Rate) basis. as on 13 Jul 26 Duration Returns 1 Month 3.7% 3 Month 10.1% 6 Month 11.5% 1 Year 9.3% 3 Year 18.9% 5 Year 14.7% 10 Year 15 Year Since launch 15.5% Historical performance (Yearly) on absolute basis
Year Returns 2025 -0.9% 2024 25.8% 2023 33.7% 2022 -4.8% 2021 54.5% 2020 31.1% 2019 -4.7% 2018 -14.2% 2017 47.1% 2016 Fund Manager information for BOI AXA Mid and Small Cap Equity and Debt Fund
Name Since Tenure Alok Singh 16 Feb 17 9.38 Yr. Data below for BOI AXA Mid and Small Cap Equity and Debt Fund as on 30 Apr 26
Asset Allocation
Asset Class Value Cash 9.83% Equity 78.48% Debt 11.69% Equity Sector Allocation
Sector Value Industrials 16.69% Financial Services 16.24% Basic Materials 13.91% Health Care 10.42% Consumer Cyclical 10.21% Technology 4.93% Consumer Defensive 3.01% Energy 0.98% Real Estate 0.9% Utility 0.77% Communication Services 0.42% Debt Sector Allocation
Sector Value Corporate 7.58% Cash Equivalent 7.09% Government 6.86% Credit Quality
Rating Value AA 8.71% AAA 91.29% Top Securities Holdings / Portfolio
Name Holding Value Quantity Abbott India Ltd (Healthcare)
Equity, Since 31 Jan 23 | ABBOTINDIA3% ₹40 Cr 15,000 Lloyds Metals & Energy Ltd (Basic Materials)
Equity, Since 28 Feb 25 | 5124553% ₹40 Cr 221,723 UNO Minda Ltd (Consumer Cyclical)
Equity, Since 31 Jul 19 | UNOMINDA2% ₹36 Cr 331,037 Aurobindo Pharma Ltd (Healthcare)
Equity, Since 31 Jan 26 | AUROPHARMA2% ₹34 Cr 240,000 Glenmark Pharmaceuticals Ltd (Healthcare)
Equity, Since 31 Jul 25 | GLENMARK2% ₹34 Cr 150,000 Indian Bank (Financial Services)
Equity, Since 31 Aug 23 | INDIANB2% ₹34 Cr 405,000 Nippon Life India Asset Management Ltd Ordinary Shares (Financial Services)
Equity, Since 31 Jan 24 | NAM-INDIA2% ₹33 Cr 300,000 Max Financial Services Ltd (Financial Services)
Equity, Since 28 Feb 26 | MFSL2% ₹32 Cr 191,000
↑ 21,000 Bank of Maharashtra (Financial Services)
Equity, Since 31 May 24 | MAHABANK2% ₹31 Cr 3,910,000 Bharat Dynamics Ltd Ordinary Shares (Industrials)
Equity, Since 31 Jul 24 | BDL2% ₹29 Cr 242,000 2. ICICI Prudential Multi-Asset Fund
ICICI Prudential Multi-Asset Fund
Growth Launch Date 31 Oct 02 NAV (10 Jul 26) ₹812.799 ↑ 5.18 (0.64 %) Net Assets (Cr) ₹84,165 on 31 May 26 Category Hybrid - Multi Asset AMC ICICI Prudential Asset Management Company Limited Rating ☆☆ Risk Moderately High Expense Ratio 1.47 Sharpe Ratio 0.18 Information Ratio 0 Alpha Ratio 0 Min Investment 5,000 Min SIP Investment 100 Exit Load 0-1 Years (1%),1 Years and above(NIL) Growth of 10,000 investment over the years.
Date Value 30 Jun 21 ₹10,000 30 Jun 22 ₹11,640 30 Jun 23 ₹14,219 30 Jun 24 ₹18,823 30 Jun 25 ₹21,063 30 Jun 26 ₹22,143 Returns for ICICI Prudential Multi-Asset Fund
absolute basis & more than 1 year are on CAGR (Compound Annual Growth Rate) basis. as on 13 Jul 26 Duration Returns 1 Month 3.5% 3 Month 1.6% 6 Month -0.1% 1 Year 6.9% 3 Year 16.2% 5 Year 17.4% 10 Year 15 Year Since launch 20.4% Historical performance (Yearly) on absolute basis
Year Returns 2025 18.6% 2024 16.1% 2023 24.1% 2022 16.8% 2021 34.7% 2020 9.9% 2019 7.7% 2018 -2.2% 2017 28.2% 2016 12.5% Fund Manager information for ICICI Prudential Multi-Asset Fund
Name Since Tenure Sankaran Naren 1 Feb 12 14.42 Yr. Manish Banthia 22 Jan 24 2.44 Yr. Akhil Kakkar 22 Jan 24 2.44 Yr. Sri Sharma 30 Apr 21 5.17 Yr. Gaurav Chikane 2 Aug 21 4.91 Yr. Sharmila D'Silva 31 Jul 22 3.92 Yr. Masoomi Jhurmarvala 4 Nov 24 1.65 Yr. Antariksha Banerjee 15 Jun 26 0.04 Yr. Data below for ICICI Prudential Multi-Asset Fund as on 31 May 26
Asset Allocation
Asset Class Value Cash 16.68% Equity 61.7% Debt 10.87% Other 10.74% Equity Sector Allocation
Sector Value Financial Services 22.64% Consumer Cyclical 12.36% Industrials 5.86% Consumer Defensive 5.41% Basic Materials 4.65% Technology 4.38% Health Care 3.13% Energy 2.78% Real Estate 2.25% Utility 2.1% Communication Services 2% Debt Sector Allocation
Sector Value Cash Equivalent 14.32% Corporate 7.18% Government 6.05% Credit Quality
Rating Value A 1.13% AA 24.49% AAA 72.52% Top Securities Holdings / Portfolio
Name Holding Value Quantity ICICI Pru Gold ETF
- | -11% ₹9,200 Cr 691,140,357
↑ 19,800,000 HDFC Bank Ltd (Financial Services)
Equity, Since 31 Jan 22 | HDFCBANK6% ₹4,834 Cr 64,922,283
↑ 13,682,715 ICICI Bank Ltd (Financial Services)
Equity, Since 31 May 06 | ICICIBANK3% ₹2,678 Cr 21,315,375 Bajaj Finserv Ltd (Financial Services)
Equity, Since 31 Jan 24 | BAJAJFINSV3% ₹2,236 Cr 12,533,749
↓ -421,423 Axis Bank Ltd (Financial Services)
Equity, Since 31 Dec 20 | AXISBANK2% ₹2,067 Cr 16,068,164
↓ -628,125 Infosys Ltd (Technology)
Equity, Since 31 Oct 19 | INFY2% ₹1,966 Cr 16,935,773
↓ -400,000 InterGlobe Aviation Ltd (Industrials)
Equity, Since 28 Feb 23 | INDIGO2% ₹1,822 Cr 4,135,656
↓ -361,200 ITC Ltd (Consumer Defensive)
Equity, Since 31 Mar 24 | ITC2% ₹1,683 Cr 58,664,918 Reliance Industries Ltd (Energy)
Equity, Since 31 Dec 20 | RELIANCE2% ₹1,587 Cr 12,011,792 Maruti Suzuki India Ltd (Consumer Cyclical)
Equity, Since 31 Aug 21 | MARUTI2% ₹1,506 Cr 1,147,022 3. SBI Multi Asset Allocation Fund
SBI Multi Asset Allocation Fund
Growth Launch Date 21 Dec 05 NAV (13 Jul 26) ₹66.8505 ↓ -0.01 (-0.02 %) Net Assets (Cr) ₹18,290 on 31 May 26 Category Hybrid - Multi Asset AMC SBI Funds Management Private Limited Rating ☆☆☆☆ Risk Moderate Expense Ratio 1.46 Sharpe Ratio 0.78 Information Ratio 0 Alpha Ratio 0 Min Investment 5,000 Min SIP Investment 500 Exit Load 0-12 Months (1%),12 Months and above(NIL) Growth of 10,000 investment over the years.
Date Value 30 Jun 21 ₹10,000 30 Jun 22 ₹10,098 30 Jun 23 ₹11,987 30 Jun 24 ₹15,440 30 Jun 25 ₹16,916 30 Jun 26 ₹18,817 Returns for SBI Multi Asset Allocation Fund
absolute basis & more than 1 year are on CAGR (Compound Annual Growth Rate) basis. as on 13 Jul 26 Duration Returns 1 Month 1.5% 3 Month 2.9% 6 Month 2.1% 1 Year 11.8% 3 Year 16.1% 5 Year 13.4% 10 Year 15 Year Since launch 9.7% Historical performance (Yearly) on absolute basis
Year Returns 2025 18.6% 2024 12.8% 2023 24.4% 2022 6% 2021 13% 2020 14.2% 2019 10.6% 2018 0.4% 2017 10.9% 2016 8.7% Fund Manager information for SBI Multi Asset Allocation Fund
Name Since Tenure Dinesh Balachandran 31 Oct 21 4.67 Yr. Mansi Sajeja 1 Dec 23 2.58 Yr. Vandna Soni 1 Jan 24 2.5 Yr. Data below for SBI Multi Asset Allocation Fund as on 31 May 26
Asset Allocation
Asset Class Value Cash 10.43% Equity 50.44% Debt 29.33% Other 9.8% Equity Sector Allocation
Sector Value Financial Services 13.27% Consumer Cyclical 5.88% Health Care 4.76% Real Estate 4.48% Utility 4.27% Energy 3.97% Basic Materials 3.94% Industrials 2.47% Consumer Defensive 2.36% Technology 2% Communication Services 1.98% Debt Sector Allocation
Sector Value Corporate 25.16% Cash Equivalent 9.53% Government 5.07% Credit Quality
Rating Value A 5.4% AA 52.44% AAA 42.16% Top Securities Holdings / Portfolio
Name Holding Value Quantity SBI Gold ETF
- | -6% ₹1,097 Cr 85,591,000 SBI Silver ETF
- | -4% ₹791 Cr 32,296,178 Brookfield India Real Estate Trust (Real Estate)
-, Since 30 Apr 25 | 5432613% ₹484 Cr 15,164,234 Bandhan Bank Ltd (Financial Services)
Equity, Since 30 Sep 24 | 5411532% ₹432 Cr 20,500,000 GAIL (India) Ltd (Utilities)
Equity, Since 31 Mar 21 | 5321552% ₹410 Cr 23,350,297 Indus Towers Ltd Ordinary Shares (Communication Services)
Equity, Since 31 Jan 26 | 5348162% ₹339 Cr 8,200,000 Biocon Ltd (Healthcare)
Equity, Since 30 Nov 24 | 5325232% ₹330 Cr 7,920,476 Syngene International Ltd (Healthcare)
Equity, Since 15 Mar 26 | 5392682% ₹317 Cr 7,000,000 ICICI Bank Ltd (Financial Services)
Equity, Since 15 Apr 22 | ICICIBANK2% ₹308 Cr 2,320,000 National Bank For Agriculture And Rural Development
Debentures | -2% ₹301 Cr 30,000 4. Sundaram Equity Hybrid Fund
Sundaram Equity Hybrid Fund
Growth Launch Date 23 Jun 00 NAV (31 Dec 21) ₹135.137 ↑ 0.78 (0.58 %) Net Assets (Cr) ₹1,954 on 30 Nov 21 Category Hybrid - Hybrid Equity AMC Sundaram Asset Management Company Ltd Rating ☆☆ Risk Moderately High Expense Ratio 2.18 Sharpe Ratio 2.64 Information Ratio -0.12 Alpha Ratio 5.81 Min Investment 5,000 Min SIP Investment 100 Exit Load 0-12 Months (1%),12 Months and above(NIL) Growth of 10,000 investment over the years.
Date Value 30 Jun 21 ₹10,000 Returns for Sundaram Equity Hybrid Fund
absolute basis & more than 1 year are on CAGR (Compound Annual Growth Rate) basis. as on 13 Jul 26 Duration Returns 1 Month 1.8% 3 Month 0.5% 6 Month 10.5% 1 Year 27.1% 3 Year 16% 5 Year 14.2% 10 Year 15 Year Since launch 12.8% Historical performance (Yearly) on absolute basis
Year Returns 2025 2024 2023 2022 2021 2020 2019 2018 2017 2016 Fund Manager information for Sundaram Equity Hybrid Fund
Name Since Tenure Data below for Sundaram Equity Hybrid Fund as on 30 Nov 21
Asset Allocation
Asset Class Value Equity Sector Allocation
Sector Value Debt Sector Allocation
Sector Value Credit Quality
Rating Value Top Securities Holdings / Portfolio
Name Holding Value Quantity 5. ICICI Prudential Equity and Debt Fund
ICICI Prudential Equity and Debt Fund
Growth Launch Date 3 Nov 99 NAV (13 Jul 26) ₹407.47 ↓ -0.26 (-0.06 %) Net Assets (Cr) ₹50,033 on 31 May 26 Category Hybrid - Hybrid Equity AMC ICICI Prudential Asset Management Company Limited Rating ☆☆☆☆ Risk Moderately High Expense Ratio 1.6 Sharpe Ratio -0.21 Information Ratio 1.77 Alpha Ratio 1.75 Min Investment 5,000 Min SIP Investment 100 Exit Load 0-1 Years (1%),1 Years and above(NIL) Growth of 10,000 investment over the years.
Date Value 30 Jun 21 ₹10,000 30 Jun 22 ₹11,521 30 Jun 23 ₹13,970 30 Jun 24 ₹19,252 30 Jun 25 ₹21,180 30 Jun 26 ₹21,663 Returns for ICICI Prudential Equity and Debt Fund
absolute basis & more than 1 year are on CAGR (Compound Annual Growth Rate) basis. as on 13 Jul 26 Duration Returns 1 Month 3.2% 3 Month 3% 6 Month -0.1% 1 Year 4% 3 Year 15.7% 5 Year 16.6% 10 Year 15 Year Since launch 14.9% Historical performance (Yearly) on absolute basis
Year Returns 2025 13.3% 2024 17.2% 2023 28.2% 2022 11.7% 2021 41.7% 2020 9% 2019 9.3% 2018 -1.9% 2017 24.8% 2016 13.7% Fund Manager information for ICICI Prudential Equity and Debt Fund
Name Since Tenure Sankaran Naren 7 Dec 15 10.57 Yr. Manish Banthia 19 Sep 13 12.79 Yr. Mittul Kalawadia 29 Dec 20 5.51 Yr. Akhil Kakkar 22 Jan 24 2.44 Yr. Sri Sharma 30 Apr 21 5.17 Yr. Sharmila D'Silva 31 Jul 22 3.92 Yr. Nitya Mishra 4 Nov 24 1.65 Yr. Data below for ICICI Prudential Equity and Debt Fund as on 31 May 26
Asset Allocation
Asset Class Value Cash 4.92% Equity 76.32% Debt 18.73% Equity Sector Allocation
Sector Value Financial Services 20.37% Consumer Cyclical 10.24% Industrials 7.7% Consumer Defensive 6.77% Energy 6.5% Health Care 5.82% Utility 4.65% Technology 4.17% Basic Materials 3.19% Real Estate 2.76% Communication Services 2.5% Debt Sector Allocation
Sector Value Corporate 12.18% Government 10.22% Cash Equivalent 1.29% Credit Quality
Rating Value A 2.66% AA 23.39% AAA 70.99% Top Securities Holdings / Portfolio
Name Holding Value Quantity HDFC Bank Ltd (Financial Services)
Equity, Since 30 Apr 21 | HDFCBANK6% ₹3,037 Cr 40,783,778
↑ 4,100,000 ICICI Bank Ltd (Financial Services)
Equity, Since 31 Jul 12 | ICICIBANK5% ₹2,439 Cr 19,413,840 Reliance Industries Ltd (Energy)
Equity, Since 30 Jun 22 | RELIANCE5% ₹2,357 Cr 17,839,980 Sun Pharmaceuticals Industries Ltd (Healthcare)
Equity, Since 31 May 16 | SUNPHARMA4% ₹2,083 Cr 11,576,148
↓ -487,900 NTPC Ltd (Utilities)
Equity, Since 28 Feb 17 | NTPC4% ₹2,010 Cr 51,962,814
↓ -2,799,000 Axis Bank Ltd (Financial Services)
Equity, Since 31 Mar 21 | AXISBANK3% ₹1,485 Cr 11,540,676
↑ 300,000 TVS Motor Co Ltd (Consumer Cyclical)
Equity, Since 28 Feb 18 | TVSMOTOR3% ₹1,336 Cr 3,981,427 Avenue Supermarts Ltd (Consumer Defensive)
Equity, Since 31 Jan 23 | DMART3% ₹1,285 Cr 3,168,463 InterGlobe Aviation Ltd (Industrials)
Equity, Since 28 Feb 23 | INDIGO2% ₹1,187 Cr 2,694,191
↑ 73,747 Tata Consultancy Services Ltd (Technology)
Equity, Since 31 Mar 24 | TCS2% ₹938 Cr 4,151,035 6. UTI Multi Asset Fund
UTI Multi Asset Fund
Growth Launch Date 21 Oct 08 NAV (13 Jul 26) ₹78.4233 ↓ -0.06 (-0.07 %) Net Assets (Cr) ₹6,922 on 31 May 26 Category Hybrid - Multi Asset AMC UTI Asset Management Company Ltd Rating ☆ Risk Moderately High Expense Ratio 1.79 Sharpe Ratio 0.13 Information Ratio 0 Alpha Ratio 0 Min Investment 5,000 Min SIP Investment 500 Exit Load 0-12 Months (1%),12 Months and above(NIL) Growth of 10,000 investment over the years.
Date Value 30 Jun 21 ₹10,000 30 Jun 22 ₹9,764 30 Jun 23 ₹12,070 30 Jun 24 ₹16,534 30 Jun 25 ₹17,943 30 Jun 26 ₹18,542 Returns for UTI Multi Asset Fund
absolute basis & more than 1 year are on CAGR (Compound Annual Growth Rate) basis. as on 13 Jul 26 Duration Returns 1 Month 1.5% 3 Month 2.6% 6 Month -1.1% 1 Year 5.5% 3 Year 15.4% 5 Year 13.3% 10 Year 15 Year Since launch 12.3% Historical performance (Yearly) on absolute basis
Year Returns 2025 11.1% 2024 20.7% 2023 29.1% 2022 4.4% 2021 11.8% 2020 13.1% 2019 3.9% 2018 -0.5% 2017 17.1% 2016 7.3% Fund Manager information for UTI Multi Asset Fund
Name Since Tenure Sharwan Goyal 12 Nov 21 4.63 Yr. Jaydeep Bhowal 1 Oct 24 1.75 Yr. Lokesh Kulthia 19 Jun 26 0.03 Yr. Data below for UTI Multi Asset Fund as on 31 May 26
Asset Allocation
Asset Class Value Cash 7.54% Equity 67.52% Debt 11.29% Other 13.65% Equity Sector Allocation
Sector Value Financial Services 19.56% Consumer Defensive 9.96% Industrials 9.32% Technology 8.3% Consumer Cyclical 5.92% Basic Materials 5.19% Real Estate 4.3% Health Care 3.11% Energy 2.25% Communication Services 2.2% Debt Sector Allocation
Sector Value Government 8.36% Corporate 6.45% Cash Equivalent 4.02% Credit Quality
Rating Value AA 5.12% AAA 94.88% Top Securities Holdings / Portfolio
Name Holding Value Quantity UTI Gold ETF
- | -14% ₹955 Cr 73,012,656
↑ 250,000 ICICI Bank Ltd (Financial Services)
Equity, Since 29 Feb 24 | ICICIBANK3% ₹203 Cr 1,616,413
↑ 160,843 Kotak Mahindra Bank Ltd (Financial Services)
Equity, Since 30 Apr 25 | KOTAKBANK3% ₹192 Cr 4,993,006
↑ 1,673,435 ITC Ltd (Consumer Defensive)
Equity, Since 31 Oct 22 | ITC3% ₹187 Cr 6,503,210
↑ 233,088 HDFC Bank Ltd (Financial Services)
Equity, Since 30 Apr 25 | HDFCBANK3% ₹186 Cr 2,497,446
↑ 55,228 Nestle India Ltd (Consumer Defensive)
Equity, Since 29 Feb 24 | NESTLEIND3% ₹185 Cr 1,299,989
↑ 34,136 Tata Consultancy Services Ltd (Technology)
Equity, Since 29 Feb 24 | TCS2% ₹173 Cr 766,007
↑ 33,048 Infosys Ltd (Technology)
Equity, Since 31 Mar 24 | INFY2% ₹130 Cr 1,121,776 Bharat Electronics Ltd (Industrials)
Equity, Since 31 Oct 25 | BEL2% ₹128 Cr 3,118,720
↑ 85,870 Cummins India Ltd (Industrials)
Equity, Since 30 Apr 23 | CUMMINSIND2% ₹123 Cr 208,758 7. Bandhan Hybrid Equity Fund
Bandhan Hybrid Equity Fund
Growth Launch Date 30 Dec 16 NAV (13 Jul 26) ₹27.719 ↑ 0.03 (0.12 %) Net Assets (Cr) ₹2,021 on 31 May 26 Category Hybrid - Hybrid Equity AMC IDFC Asset Management Company Limited Rating Risk Moderately High Expense Ratio 2.35 Sharpe Ratio 0.08 Information Ratio 0.72 Alpha Ratio 6.12 Min Investment 5,000 Min SIP Investment 100 Exit Load 0-1 Years (1%),1 Years and above(NIL) Growth of 10,000 investment over the years.
Date Value 30 Jun 21 ₹10,000 30 Jun 22 ₹9,911 30 Jun 23 ₹11,798 30 Jun 24 ₹14,680 30 Jun 25 ₹16,490 30 Jun 26 ₹17,375 Returns for Bandhan Hybrid Equity Fund
absolute basis & more than 1 year are on CAGR (Compound Annual Growth Rate) basis. as on 13 Jul 26 Duration Returns 1 Month 4.1% 3 Month 6.2% 6 Month 3.8% 1 Year 7.8% 3 Year 14.2% 5 Year 11.8% 10 Year 15 Year Since launch 11.3% Historical performance (Yearly) on absolute basis
Year Returns 2025 7.7% 2024 21% 2023 20.4% 2022 -1.1% 2021 30.8% 2020 13.9% 2019 4.7% 2018 -3.8% 2017 16.2% 2016 Fund Manager information for Bandhan Hybrid Equity Fund
Name Since Tenure Harshal Joshi 28 Jul 21 4.93 Yr. Brijesh Shah 10 Jun 24 2.06 Yr. Prateek Poddar 7 Jun 24 2.07 Yr. Ritika Behera 7 Oct 23 2.73 Yr. Gaurav Satra 7 Jun 24 2.07 Yr. Data below for Bandhan Hybrid Equity Fund as on 31 May 26
Asset Allocation
Asset Class Value Cash 4.48% Equity 78.25% Debt 17.27% Equity Sector Allocation
Sector Value Financial Services 22.07% Consumer Cyclical 12.02% Technology 7.44% Industrials 7.25% Basic Materials 6.07% Health Care 5.92% Consumer Defensive 4.67% Utility 4.06% Energy 4.01% Communication Services 2.53% Real Estate 1.4% Debt Sector Allocation
Sector Value Corporate 13.32% Government 4.66% Cash Equivalent 3.77% Credit Quality
Rating Value AA 3.2% AAA 96.8% Top Securities Holdings / Portfolio
Name Holding Value Quantity Small Industries Development Bank Of India
Debentures | -7% ₹141 Cr 14,500,000 ICICI Bank Ltd (Financial Services)
Equity, Since 31 Jul 24 | ICICIBANK6% ₹114 Cr 904,699
↑ 49,456 HDFC Bank Ltd (Financial Services)
Equity, Since 30 Jun 24 | HDFCBANK5% ₹93 Cr 1,253,726
↑ 114,404 Reliance Industries Ltd (Energy)
Equity, Since 30 Apr 20 | RELIANCE4% ₹74 Cr 562,469
↑ 42,433 NTPC Ltd (Utilities)
Equity, Since 28 Feb 23 | NTPC4% ₹74 Cr 1,909,614
↑ 69,913 State Bank of India (Financial Services)
Equity, Since 28 Feb 21 | SBIN3% ₹56 Cr 578,627
↑ 49,160 Bajaj Housing Finance Limited
Debentures | -2% ₹49 Cr 5,000,000
↑ 2,500,000 Infosys Ltd (Technology)
Equity, Since 31 Jan 17 | INFY2% ₹48 Cr 413,181
↓ -5,370 JSW Steel Ltd (Basic Materials)
Equity, Since 31 Mar 25 | JSWSTEEL2% ₹43 Cr 334,106
↑ 26,012 Larsen & Toubro Ltd (Industrials)
Equity, Since 31 Jan 17 | LT2% ₹40 Cr 98,379
↑ 1,222
SIP Vs RD: Which is Better RD Or SIP?
Difference Between Recurring Deposit and SIP
The factors used here are the rate of return, liquidity, taxation, Volatility, risk factors, etc.
| Factors | Recurring Deposit (RD) | Systematic Investment Plan (SIP) |
|---|---|---|
| Rate of Return | The SIP returns are market-linked and may vary depending on the type of fund and the fund performance. However, the returns of a SIP are usually good when invested for a longer tenure. | The return rate of an RD is fixed due to its fixed interest rate. So, there is no effect of market volatility on this investment. |
| Investment Scheme | In a RD scheme, you will have to invest in a deposit plan that will give you fixed rate of returns. You can also opt for flexible recurring deposit scheme if you are looking for more flexibility. | In a SIP for mutual funds, you can choose between debt or equity type of funds depending on your risk capability. |
| Investment Type | In a Recurring deposit scheme, the investor has to deposit a fixed amount every month. | Systematic Investment Plan is a way to put your money on mutual funds. Investment can be done on a periodic basis - daily, weekly, monthly or quarterly. |
| Liquidity | To Cancel SIP, the investors can simply close their investment and withdraw their money without any penal charges. | In the case of an RD, the premature withdrawal or closure of the investment will cause penalty charges. |
| Taxation | Recurring Deposit amount or the interest earned on it are not exempted from tax. | SIP investments and returns are exempted from tax only when invested on Equity Linked Savings Scheme (ELSS) funds. |
| Volatility | Being market-linked, the SIP returns are volatile and may vary from fund to fund. | The RD returns are fixed and thus it is not a volatile investment. |
| Risk Factor | The risk factor is almost null in an RD investment as the returns are fixed. It is one of the safest investment. | The risk in SIP is higher than that in an RD, as SIP returns depend on stock market and Asset Allocation. |
| Investment Goal | Recurring Deposits usually serve short-term savings goal and do not help in long-term wealth growth. | SIPs can help in all kinds of investments goals, whether short- or long –term, depending on the frequency of investment, funds chosen and other factors. |
| Installment Frequency | Recurring Deposit usually come with monthly instalments | SIPs offer flexible instalment plans of daily, weekly, monthly, quarterly etc. |
Evaluation: Returns of SIP Vs RD
Which is a better investment option- SIP vs RD? The answer to this question may vary from person to person depending on their personal needs. As you know, the SIP returns are variable while the RD returns are fixed, let’s see how much the investment grows if one invests INR 1,000 in both an RD and a SIP for 1 year (12 months).
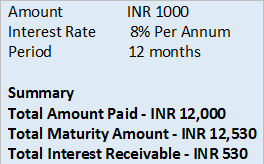
RD Return Calculator
The RD interest rate may vary at every Bank, but generally, the interest rate ranges from 7% to 9% p.a. Assuming the interest rate to be 8%, let’s analyse the growth in an RD investment of INR 1,000 monthly for 12 months.
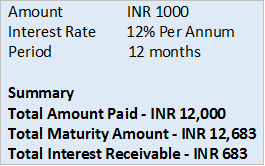
SIP Return Calculator
Assuming the SIP interest rate to be 12%, let’s monitor how your SIP grows if you invest INR 1000 monthly for 1 year through the Power of Compounding.
In conclusion, here are some final tips for investors.
- If you are a risk-averse investor, RD or Recurring Deposit is a better option. The RD interest rate and returns are capped beforehand and are usually not very high, may vary from 7-9% p.a.
- If you wish to take a little risk, SIP is one of the best investment options for long-term investment. As per the analysis, SIPs offer good returns and the interest rates are usually higher, exceeding to 15% p.a. in some cases.
- When investing for 5 years, RD is a safer option for investors who are looking for fixed returns.
- However, when investing for a longer duration (more than 5 years) for a certain financial goal, SIP offers good returns and the money growth is much higher.
“Investing in equity via SIP is like planting a tree, one has to be patient to avail the fruits.”
All efforts have been made to ensure the information provided here is accurate. However, no guarantees are made regarding correctness of data. Please verify with scheme information document before making any investment.


AMFI Registration No. 112358 | CIN: U74999MH2016PTC282153
Shepard Technologies Pvt. Ltd. (with ARN code 112358) makes no warranties or representations, express or implied, on products offered through the platform. It accepts no liability for any damages or losses, however caused, in connection with the use of, or on the reliance of its product or related services. Terms and conditions of the website are applicable.
©2026 Shepard Technologies Private Limited. All Rights Reserved
Research Highlights for BOI AXA Mid and Small Cap Equity and Debt Fund