SIP Vs STP Vs SWP
Which One to Choose?
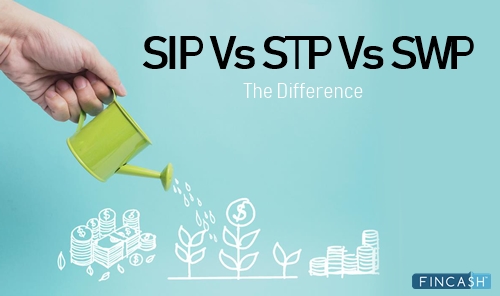
SIP, STP, and SWP all are systematic and strategic methods of Investing and withdrawal in Mutual Funds. Individuals can resort to each of the options depending on their requirements. In a nutshell, SIP means a systematic method of investing in Mutual Funds while STP means systematically transferring the money from one Mutual Fund scheme to another. Finally, SWP means withdrawal of funds or redemption of Mutual Fund units in a systematic manner. While the first two terms are related to investment, the third term discusses withdrawal. So, let us understand the differences between SIP, STP and SWP by comparing various parameters through this article.
SIP or Systematic Investment Plan
SIP or Systematic Investment plan is a mode of investment in Mutual Funds. In this method, individuals invest small amounts at regular intervals in Mutual Funds. SIP is generally referred in the context of Equity Funds. SIP is also known as goal-based investment. In SIPs, individual purchase Mutual Fund units at regular intervals in small quantities. Individuals can start investing in Mutual Funds through SIP mode with amounts as low as INR 500 (in some cases even INR 100). SIP has a lot of advantages such as the Power of Compounding, rupee cost averaging, and disciplined savings habit. The frequency of SIP can be monthly, fortnightly, or quarterly.
STP or Systematic Transfer Plan
STP or Systematic Transfer Plan is a technique through which an individual gives consent to the Mutual Fund company to transfer money from one scheme to another in a systematic and periodic manner. In STP, individuals can transfer their money only from one scheme to another of the same fund house and not of other fund houses. In STP, the transfer is done from a liquid or ultra short-term fund to an equity fund. It is suitable for individuals who have excess idle money lying in their account and are reluctant to invest the entire amounts into equity funds. As a result, through STP, individuals can first invest the money in Liquid Funds and then transfer it to equity funds of their choice.
SWP or Systematic Withdrawal Plan
SWP or Systematic Withdrawal Plan is the opposite of SIP. In SWP, individuals redeem money from Mutual Fund schemes in small amounts. In this situation, individuals first deposit the money in a Mutual Fund scheme whose risk-appetite is generally low such as liquid funds. Then, individuals start to redeem the money from the Mutual Fund scheme at regular intervals depending on their requirements. The frequency of SWP can be weekly, monthly, or quarterly. SWP can be used as a source of regular income for individuals, especially for retirees.
Talk to our investment specialist
SIP Vs STP Vs SWP: Understanding the Differences
Many times, individuals do get confused while choosing between SIP, STP, and SWP. So, let us understand the differences between all the techniques.
Investment, Transfer, and Withdrawal
In SIP, individuals invest money in a particular Mutual Fund scheme. This investment is done at regular intervals and fixed amount. Also, SIP is generally done in equity funds and for a longer tenure. In STP, the money is first invested in a debt fund generally liquid fund and then is transferred at regular intervals in equity funds. Here too, the tenure and amount of transfer are fixed. Finally, in SWP, individuals withdraw money from Mutual Fund scheme at regular intervals. Here too, you first need to deposit money in Mutual Fund schemes whose risk-appetite is low. Then, a fixed sum of money is redeemed at regular intervals.
Suitability
SIP is suitable for individuals whose investment tenure is longer and cannot invest a lump sum amount in Mutual Funds. In addition, SIP is also chosen by individuals who wish to attain a particular objective by Mutual Fund investment. STP, on the other hand, is suitable for individuals who have excess idle money but are reluctant to invest the entire amount in Mutual Fund schemes. Therefore, through STP, they can transfer small amounts at regular intervals in equity-based funds. SWP, on the contrary, is suitable for individuals who have received excess money and are looking for a regular source of income from it. Therefore, they can first deposit in a scheme having a low level of risk and then start to withdraw the required amount at regular intervals.
Tax Impact
Generally, in SIPs, there is no tax applicable as there is a transfer withdrawal of funds instead they are invested. In addition, SIPs in case of ELSS schemes help individuals to claim a tax deduction of up to INR 1,50,000 under Section 80C of income tax Act, 1961. However, in case of STP and SWP, there is taxation involved. Since, in STP, funds are transferred from liquid funds to equity funds, they do attract tax. Each transfer is treated as a redemption and does attract a Capital Gains tax. Similarly, in case of SWP, each withdrawal attracts tax. In this situation, each withdrawal is also treated as a redemption and is applicable as capital gain. The capital gains for STP and SWP for equity and debt funds are explained as follows.
VALUE AT END OF TENOR:₹5,927SWP Calculator
In case of equity funds, Short Term Capital Gains or STCG is applicable if the redemption is done within one year from the date of purchase. STCG is a case of equity funds is taxed at flat 15%. If the funds are redeemed after one year then Long Term Capital Gain (LTCG) is applicable which is charged at 10% without indexation benefits. However, this LTCG is applicable if the gains are above INR 1 Lakh. For debt funds, STCG is applicable if the funds are redeemed within three years from the date of purchase which is charged as per an individual’s tax rate. However, LTCG is debt funds is taxable at 20% with indexation benefits.
Advantages
There are several advantages for each of the modes of investment. In case of SIP, some of the prominent advantages are rupee cost averaging, the power of compounding, and disciplined investment approach. In case of STP, some of the advantages include consistent returns, averaging of cost, and rebalancing Portfolio. Finally, the advantages of SWP include regular income, tax benefits, and avoid market fluctuations.
The table given below summarizes the differences between SIP, STP, and SWP.
| Parameters | SIP | STP | SWP |
|---|---|---|---|
| Investment, Transfer, & Withdrawal | In this mode, money is invested in one scheme at regular intervals in small amounts | In this mode, money is transferred from one scheme to another at regular intervals | In this mode, money is withdrawn from the Mutual Fund scheme at regular intervals |
| Suitability | Suitable for investors who save money from their monthly income | Suitable for investors who save money from their monthly income | Suitable for investors who save money from their monthly income |
| Tax Applicability | Tax is not applicable as the money is invested in a scheme | Tax is applicable as money transferred is considered as a redemption | Tax is applicable as each withdrawal is considered as a redemption |
| Advantages | Power of Compounding, Rupee cost Averaging, Disciplined Investment Approach | Consistent Returns, Rebalancing Portfolio, Averaging of cost | Regular flow income Avoids market fluctuations |
Fund Selection Methodology used to find 10 funds
Best SIP for Investment
Thus, based on the above parameters, some of the Mutual Fund schemes that can be considered for SIP investment are as follows.
Fund NAV Net Assets (Cr) Min SIP Investment 3 MO (%) 6 MO (%) 1 YR (%) 3 YR (%) 5 YR (%) 2024 (%) DSP Natural Resources and New Energy Fund Growth ₹107.814
↑ 1.02 ₹1,573 500 11.4 21.9 35.2 23.2 21.3 17.5 Franklin Asian Equity Fund Growth ₹39.0334
↑ 0.02 ₹315 500 14.2 22.3 34.9 14.2 2.3 23.7 DSP US Flexible Equity Fund Growth ₹77.835
↑ 1.30 ₹1,068 500 8.9 15.9 27.3 22 16.7 33.8 Aditya Birla Sun Life Banking And Financial Services Fund Growth ₹64.62
↓ -0.85 ₹3,694 1,000 0.4 6.7 22.8 17.6 12.9 17.5 Franklin Build India Fund Growth ₹147.965
↓ -1.71 ₹3,036 500 1.5 4.6 21.2 27.6 23.7 3.7 Kotak Equity Opportunities Fund Growth ₹355.177
↓ -6.07 ₹30,039 1,000 0.5 4 18.1 19.5 17.2 5.6 Kotak Standard Multicap Fund Growth ₹87.509
↓ -1.36 ₹56,460 500 -0.1 3.2 17.7 17.3 14 9.5 Invesco India Growth Opportunities Fund Growth ₹99.13
↓ -1.76 ₹9,344 100 -4.1 -3.6 17.5 24.4 17.5 4.7 Tata India Tax Savings Fund Growth ₹45.7952
↓ -0.53 ₹4,748 500 0.5 5.8 17.3 16.6 13.8 4.9 DSP Equity Opportunities Fund Growth ₹636.304
↓ -7.96 ₹17,576 500 1.5 5.9 16.9 21.2 16.6 7.1 Note: Returns up to 1 year are on absolute basis & more than 1 year are on CAGR basis. as on 18 Feb 26 Research Highlights & Commentary of 10 Funds showcased
Commentary DSP Natural Resources and New Energy Fund Franklin Asian Equity Fund DSP US Flexible Equity Fund Aditya Birla Sun Life Banking And Financial Services Fund Franklin Build India Fund Kotak Equity Opportunities Fund Kotak Standard Multicap Fund Invesco India Growth Opportunities Fund Tata India Tax Savings Fund DSP Equity Opportunities Fund Point 1 Bottom quartile AUM (₹1,573 Cr). Bottom quartile AUM (₹315 Cr). Bottom quartile AUM (₹1,068 Cr). Lower mid AUM (₹3,694 Cr). Lower mid AUM (₹3,036 Cr). Top quartile AUM (₹30,039 Cr). Highest AUM (₹56,460 Cr). Upper mid AUM (₹9,344 Cr). Upper mid AUM (₹4,748 Cr). Upper mid AUM (₹17,576 Cr). Point 2 Established history (17+ yrs). Established history (18+ yrs). Established history (13+ yrs). Established history (12+ yrs). Established history (16+ yrs). Established history (21+ yrs). Established history (16+ yrs). Established history (18+ yrs). Established history (11+ yrs). Oldest track record among peers (25 yrs). Point 3 Top rated. Rating: 5★ (top quartile). Rating: 5★ (upper mid). Rating: 5★ (upper mid). Rating: 5★ (upper mid). Rating: 5★ (lower mid). Rating: 5★ (lower mid). Rating: 5★ (bottom quartile). Rating: 5★ (bottom quartile). Rating: 5★ (bottom quartile). Point 4 Risk profile: High. Risk profile: High. Risk profile: High. Risk profile: High. Risk profile: High. Risk profile: Moderately High. Risk profile: Moderately High. Risk profile: Moderately High. Risk profile: Moderately High. Risk profile: Moderately High. Point 5 5Y return: 21.32% (top quartile). 5Y return: 2.29% (bottom quartile). 5Y return: 16.71% (upper mid). 5Y return: 12.92% (bottom quartile). 5Y return: 23.68% (top quartile). 5Y return: 17.15% (upper mid). 5Y return: 14.05% (lower mid). 5Y return: 17.46% (upper mid). 5Y return: 13.85% (bottom quartile). 5Y return: 16.62% (lower mid). Point 6 3Y return: 23.25% (upper mid). 3Y return: 14.25% (bottom quartile). 3Y return: 22.04% (upper mid). 3Y return: 17.55% (lower mid). 3Y return: 27.58% (top quartile). 3Y return: 19.52% (lower mid). 3Y return: 17.25% (bottom quartile). 3Y return: 24.37% (top quartile). 3Y return: 16.65% (bottom quartile). 3Y return: 21.19% (upper mid). Point 7 1Y return: 35.19% (top quartile). 1Y return: 34.90% (top quartile). 1Y return: 27.26% (upper mid). 1Y return: 22.78% (upper mid). 1Y return: 21.22% (upper mid). 1Y return: 18.07% (lower mid). 1Y return: 17.70% (lower mid). 1Y return: 17.54% (bottom quartile). 1Y return: 17.29% (bottom quartile). 1Y return: 16.92% (bottom quartile). Point 8 Alpha: 0.00 (upper mid). Alpha: 0.00 (upper mid). Alpha: 2.48 (top quartile). Alpha: -1.32 (lower mid). Alpha: 0.00 (upper mid). Alpha: -2.40 (bottom quartile). Alpha: 1.61 (top quartile). Alpha: -3.20 (bottom quartile). Alpha: -2.63 (bottom quartile). Alpha: -0.86 (lower mid). Point 9 Sharpe: 0.74 (upper mid). Sharpe: 1.54 (top quartile). Sharpe: 1.20 (top quartile). Sharpe: 0.84 (upper mid). Sharpe: -0.05 (bottom quartile). Sharpe: 0.04 (lower mid). Sharpe: 0.28 (upper mid). Sharpe: 0.01 (bottom quartile). Sharpe: 0.00 (bottom quartile). Sharpe: 0.13 (lower mid). Point 10 Information ratio: 0.00 (upper mid). Information ratio: 0.00 (upper mid). Information ratio: -0.26 (bottom quartile). Information ratio: 0.25 (upper mid). Information ratio: 0.00 (lower mid). Information ratio: -0.05 (bottom quartile). Information ratio: -0.04 (lower mid). Information ratio: 0.75 (top quartile). Information ratio: -0.26 (bottom quartile). Information ratio: 0.34 (top quartile). DSP Natural Resources and New Energy Fund
Franklin Asian Equity Fund
DSP US Flexible Equity Fund
Aditya Birla Sun Life Banking And Financial Services Fund
Franklin Build India Fund
Kotak Equity Opportunities Fund
Kotak Standard Multicap Fund
Invesco India Growth Opportunities Fund
Tata India Tax Savings Fund
DSP Equity Opportunities Fund
Conclusion
Thus, there are a lot of differences between all the schemes. As a consequence, individuals should be careful while choosing the schemes. They should understand the modalities of the scheme completely before investing in it. In addition, they should also check whether such investment mode is suitable for them or not. This will help them to attain their objectives on time.
All efforts have been made to ensure the information provided here is accurate. However, no guarantees are made regarding correctness of data. Please verify with scheme information document before making any investment.





Superb Knowledgeable page.........