மியூச்சுவல் ஃபண்டுகளில் மொத்த தொகை முதலீடு
நீங்கள் ஒரு மொத்த தொகையை முதலீடு செய்யலாம் என்பது உங்களுக்குத் தெரியுமா?பரஸ்பர நிதி? ஆம் என்றால், அது நல்லது. இருப்பினும், இல்லை என்றால், கவலைப்பட வேண்டாம். இந்தக் கட்டுரை உங்களுக்கும் வழிகாட்டும். மியூச்சுவல் ஃபண்டுகளில் மொத்த தொகை முதலீடு என்பது ஒரு தனிநபர் மியூச்சுவல் ஃபண்டுகளில் ஒரே நேரத்தில் பணத்தை முதலீடு செய்யும் சூழ்நிலையைக் குறிக்கிறது. இங்கு, பலமுறை டெபாசிட் நடைபெறுவதில்லை. இடையே நிறைய வித்தியாசம் உள்ளதுஎஸ்ஐபி மற்றும் மொத்த முதலீட்டு முறை. எனவே, மியூச்சுவல் ஃபண்டுகளில் மொத்த முதலீட்டின் கருத்தைப் புரிந்துகொள்வோம்.சிறந்த பரஸ்பர நிதிகள் மொத்தத் தொகை முதலீடு, மொத்தத் தொகை முதலீட்டின் போது கருத்தில் கொள்ள வேண்டிய விஷயங்கள், மியூச்சுவல் ஃபண்ட் லம்ப் சம் ரிட்டர்ன் கால்குலேட்டர் மற்றும் இந்தக் கட்டுரையின் மூலம் தொடர்புடைய பிற அம்சங்கள்.

மியூச்சுவல் ஃபண்டுகளில் மொத்த தொகை முதலீடு என்றால் என்ன?
மியூச்சுவல் ஃபண்டில் மொத்த தொகை முதலீடு என்பது தனிநபர்கள் செய்யும் ஒரு சூழ்நிலைமியூச்சுவல் ஃபண்டுகளில் முதலீடு செய்யுங்கள் ஒரே ஒரு முறை. இருப்பினும், SIP முதலீட்டு முறைக்கு மாறாக தனிநபர்கள் சிறிய தொகையை மொத்த தொகை முறையில் டெபாசிட் செய்கிறார்கள், தனிநபர்கள் கணிசமான தொகையை டெபாசிட் செய்கிறார்கள். வேறு வார்த்தைகளில் கூறுவதானால், இது ஒரு ஷாட் நுட்பமாகும்முதலீடு மியூச்சுவல் ஃபண்டுகளில். அதிக நிதியை வைத்திருக்கும் முதலீட்டாளர்களுக்கு ஏற்ற முதலீட்டு முறைவங்கி கணக்கு மற்றும் மேலும் சம்பாதிக்க சேனல்களை தேடுகின்றனர்வருமானம் மியூச்சுவல் ஃபண்டுகளில் முதலீடு செய்வதன் மூலம்.
2022 - 2023 இல் மொத்த தொகை முதலீட்டிற்கான சிறந்த மியூச்சுவல் ஃபண்ட்
நீங்கள் மியூச்சுவல் ஃபண்டுகளில் மொத்த தொகை முறையில் முதலீடு செய்வதற்கு முன், தனிநபர்கள் AUM, முதலீட்டுத் தொகை மற்றும் பல போன்ற பல்வேறு அளவுருக்களைக் கருத்தில் கொள்ள வேண்டும். எனவே, இந்த அளவுருக்களின் அடிப்படையில் மொத்த தொகை முதலீட்டிற்கான சில சிறந்த மியூச்சுவல் ஃபண்டுகள் பின்வருமாறு.
ஈக்விட்டி மியூச்சுவல் ஃபண்டுகளில் சிறந்த மொத்த முதலீடு
ஈக்விட்டி நிதிகள் பல்வேறு நிறுவனங்களின் ஈக்விட்டி மற்றும் ஈக்விட்டி தொடர்பான கருவிகளில் தங்கள் கார்பஸை முதலீடு செய்யும் திட்டங்களாகும். இந்தத் திட்டங்கள் நீண்ட கால முதலீட்டுக்கு ஒரு நல்ல தேர்வாகக் கருதப்படுகிறது. தனிநபர்கள் மொத்த தொகையை ஈக்விட்டி ஃபண்டுகளில் முதலீடு செய்யலாம் என்றாலும், ஈக்விட்டி ஃபண்டுகளில் முதலீடு செய்வதற்கான பரிந்துரைக்கப்பட்ட நுட்பம் எஸ்ஐபி மூலமாகவோ அல்லதுமுறையான பரிமாற்ற திட்டம் (STP) பயன்முறை. STP பயன்முறையில், தனிநபர்கள் முதலில் கணிசமான பணத்தை டெபாசிட் செய்கிறார்கள்கடன் நிதி போன்றவைதிரவ நிதிகள் பின்னர் பங்கு நிதிகளில் சீரான இடைவெளியில் பணம் மாற்றப்படும். முதலீட்டிற்கு பரிசீலிக்கக்கூடிய சில ஈக்விட்டி மியூச்சுவல் ஃபண்டுகள் பின்வருமாறு.
Fund NAV Net Assets (Cr) Min Investment 3 MO (%) 6 MO (%) 1 YR (%) 3 YR (%) 5 YR (%) 2025 (%) ICICI Prudential Infrastructure Fund Growth ₹204.61
↑ 0.29 ₹8,351 5,000 3.8 5.4 2.5 20.9 23.3 6.7 SBI PSU Fund Growth ₹34.3974
↓ -0.06 ₹6,594 5,000 -3.5 0.6 6.6 25.6 23.1 11.3 LIC MF Infrastructure Fund Growth ₹54.3117
↓ -0.12 ₹1,099 5,000 7.8 13.3 7.7 25.5 22.8 -3.7 DSP India T.I.G.E.R Fund Growth ₹361.563
↓ -0.05 ₹6,019 1,000 8.5 16.7 12.9 23.8 22.4 -2.5 Motilal Oswal Midcap 30 Fund Growth ₹98.9785
↓ -0.72 ₹36,458 5,000 8.4 2.3 -3.3 18.9 22.2 -12.1 Note: Returns up to 1 year are on absolute basis & more than 1 year are on CAGR basis. as on 16 Jul 26 Research Highlights & Commentary of 5 Funds showcased
Commentary ICICI Prudential Infrastructure Fund SBI PSU Fund LIC MF Infrastructure Fund DSP India T.I.G.E.R Fund Motilal Oswal Midcap 30 Fund Point 1 Upper mid AUM (₹8,351 Cr). Lower mid AUM (₹6,594 Cr). Bottom quartile AUM (₹1,099 Cr). Bottom quartile AUM (₹6,019 Cr). Highest AUM (₹36,458 Cr). Point 2 Established history (20+ yrs). Established history (16+ yrs). Established history (18+ yrs). Oldest track record among peers (22 yrs). Established history (12+ yrs). Point 3 Rating: 3★ (upper mid). Rating: 2★ (bottom quartile). Not Rated. Top rated. Rating: 3★ (lower mid). Point 4 Risk profile: High. Risk profile: High. Risk profile: High. Risk profile: High. Risk profile: Moderately High. Point 5 5Y return: 23.34% (top quartile). 5Y return: 23.12% (upper mid). 5Y return: 22.85% (lower mid). 5Y return: 22.44% (bottom quartile). 5Y return: 22.17% (bottom quartile). Point 6 3Y return: 20.87% (bottom quartile). 3Y return: 25.60% (top quartile). 3Y return: 25.50% (upper mid). 3Y return: 23.76% (lower mid). 3Y return: 18.95% (bottom quartile). Point 7 1Y return: 2.54% (bottom quartile). 1Y return: 6.60% (lower mid). 1Y return: 7.66% (upper mid). 1Y return: 12.85% (top quartile). 1Y return: -3.32% (bottom quartile). Point 8 Alpha: 0.00 (lower mid). Alpha: 0.16 (upper mid). Alpha: 4.51 (top quartile). Alpha: 0.00 (bottom quartile). Alpha: -14.76 (bottom quartile). Point 9 Sharpe: 0.00 (bottom quartile). Sharpe: 0.26 (lower mid). Sharpe: 0.26 (upper mid). Sharpe: 0.48 (top quartile). Sharpe: -0.55 (bottom quartile). Point 10 Information ratio: 0.00 (upper mid). Information ratio: -0.02 (bottom quartile). Information ratio: 0.55 (top quartile). Information ratio: 0.00 (lower mid). Information ratio: -0.36 (bottom quartile). ICICI Prudential Infrastructure Fund
SBI PSU Fund
LIC MF Infrastructure Fund
DSP India T.I.G.E.R Fund
Motilal Oswal Midcap 30 Fund
Talk to our investment specialist
கடன் மியூச்சுவல் ஃபண்டுகளில் சிறந்த மொத்த தொகை முதலீடு
கடன் நிதிகள் தங்கள் நிதி பணத்தை வெவ்வேறு இடங்களில் முதலீடு செய்கின்றனநிலையான வருமானம் கருவூல பில்கள், கார்ப்பரேட் போன்ற கருவிகள்பத்திரங்கள், இன்னும் பற்பல. இந்த திட்டங்கள் குறுகிய மற்றும் நடுத்தர காலத்திற்கு ஒரு நல்ல தேர்வாக கருதப்படுகிறது. பல தனிநபர்கள் மொத்தப் பணத்தை டெப்ட் மியூச்சுவல் ஃபண்டுகளில் முதலீடு செய்யத் தேர்வு செய்கிறார்கள். அவற்றில் சிலசிறந்த கடன் நிதிகள் மொத்த முதலீட்டிற்குத் தேர்ந்தெடுக்கக்கூடியவை பின்வருமாறு.
Fund NAV Net Assets (Cr) Min Investment 3 MO (%) 6 MO (%) 1 YR (%) 3 YR (%) 2025 (%) Debt Yield (YTM) Mod. Duration Eff. Maturity DSP Credit Risk Fund Growth ₹54.8304
↑ 0.05 ₹258 1,000 7.4 7.8 9.9 16 21 0% 2Y 3M 27D Aditya Birla Sun Life Credit Risk Fund Growth ₹25.1758
↑ 0.02 ₹1,391 1,000 2.1 4.3 11.9 12.1 13.4 8.4% 1Y 10M 13D 2Y 6M Franklin India Credit Risk Fund Growth ₹25.3348
↑ 0.04 ₹104 5,000 2.9 5 7.5 11 0% Aditya Birla Sun Life Medium Term Plan Growth ₹43.5415
↑ 0.04 ₹3,127 1,000 2.1 3.7 8.4 9.9 10.9 8.49% 2Y 10M 6D 3Y 10M 10D Franklin India Ultra Short Bond Fund - Super Institutional Plan Growth ₹34.9131
↑ 0.04 ₹297 10,000 1.3 5.9 13.7 8.8 0% 1Y 15D Note: Returns up to 1 year are on absolute basis & more than 1 year are on CAGR basis. as on 16 Jul 26 Research Highlights & Commentary of 5 Funds showcased
Commentary DSP Credit Risk Fund Aditya Birla Sun Life Credit Risk Fund Franklin India Credit Risk Fund Aditya Birla Sun Life Medium Term Plan Franklin India Ultra Short Bond Fund - Super Institutional Plan Point 1 Bottom quartile AUM (₹258 Cr). Upper mid AUM (₹1,391 Cr). Bottom quartile AUM (₹104 Cr). Highest AUM (₹3,127 Cr). Lower mid AUM (₹297 Cr). Point 2 Oldest track record among peers (23 yrs). Established history (11+ yrs). Established history (14+ yrs). Established history (17+ yrs). Established history (18+ yrs). Point 3 Top rated. Not Rated. Rating: 1★ (lower mid). Rating: 4★ (upper mid). Rating: 1★ (bottom quartile). Point 4 Risk profile: Moderate. Risk profile: Moderate. Risk profile: Moderate. Risk profile: Moderate. Risk profile: Moderate. Point 5 1Y return: 9.91% (lower mid). 1Y return: 11.85% (upper mid). 1Y return: 7.45% (bottom quartile). 1Y return: 8.42% (bottom quartile). 1Y return: 13.69% (top quartile). Point 6 1M return: 1.18% (top quartile). 1M return: 1.00% (upper mid). 1M return: 0.91% (bottom quartile). 1M return: 0.94% (lower mid). 1M return: 0.59% (bottom quartile). Point 7 Sharpe: 0.57 (bottom quartile). Sharpe: 1.60 (upper mid). Sharpe: 0.29 (bottom quartile). Sharpe: 0.70 (lower mid). Sharpe: 2.57 (top quartile). Point 8 Information ratio: 0.00 (top quartile). Information ratio: 0.00 (upper mid). Information ratio: 0.00 (lower mid). Information ratio: 0.00 (bottom quartile). Information ratio: 0.00 (bottom quartile). Point 9 Yield to maturity (debt): 0.00% (lower mid). Yield to maturity (debt): 8.40% (upper mid). Yield to maturity (debt): 0.00% (bottom quartile). Yield to maturity (debt): 8.49% (top quartile). Yield to maturity (debt): 0.00% (bottom quartile). Point 10 Modified duration: 2.33 yrs (bottom quartile). Modified duration: 1.87 yrs (lower mid). Modified duration: 0.00 yrs (top quartile). Modified duration: 2.85 yrs (bottom quartile). Modified duration: 0.00 yrs (upper mid). DSP Credit Risk Fund
Aditya Birla Sun Life Credit Risk Fund
Franklin India Credit Risk Fund
Aditya Birla Sun Life Medium Term Plan
Franklin India Ultra Short Bond Fund - Super Institutional Plan
மொத்த தொகை முதலீட்டிற்கான சிறந்த கலப்பின நிதிகள்
கலப்பின நிதி என்றும் அழைக்கப்படுகிறதுசமப்படுத்தப்பட்ட நிதி தங்கள் பணத்தை ஈக்விட்டி மற்றும் நிலையான வருமானம் ஆகிய இரண்டிலும் முதலீடு செய்யுங்கள். இந்தத் திட்டங்கள் தேடும் நபர்களுக்கு ஏற்றதுமூலதனம் வழக்கமான வருமானத்துடன் தலைமுறை. சமச்சீர் திட்டங்கள் என்றும் அறியப்படும், தனிநபர்கள் மொத்தத் தொகையை ஹைப்ரிட் திட்டங்களில் முதலீடு செய்யலாம். மொத்த முதலீட்டிற்கான சிறந்த கலப்பின நிதிகள் சில கீழே பட்டியலிடப்பட்டுள்ளன.
Fund NAV Net Assets (Cr) Min Investment 3 MO (%) 6 MO (%) 1 YR (%) 3 YR (%) 5 YR (%) 2025 (%) BOI AXA Mid and Small Cap Equity and Debt Fund Growth ₹41.95
↓ -0.11 ₹1,482 5,000 8.2 11.3 8.2 18.7 14.2 -0.9 Sundaram Equity Hybrid Fund Growth ₹135.137
↑ 0.78 ₹1,954 5,000 0.5 10.5 27.1 16 14.2 SBI Multi Asset Allocation Fund Growth ₹66.6898
↑ 0.02 ₹18,290 5,000 1.6 1.1 10.8 15.7 13.2 18.6 ICICI Prudential Multi-Asset Fund Growth ₹809.607
↑ 2.28 ₹84,165 5,000 0.3 -1 6.4 15.7 17.1 18.6 ICICI Prudential Equity and Debt Fund Growth ₹406.49
↑ 0.15 ₹50,033 5,000 1.2 -0.3 3.2 15.4 16.4 13.3 Note: Returns up to 1 year are on absolute basis & more than 1 year are on CAGR basis. as on 16 Jul 26 Research Highlights & Commentary of 5 Funds showcased
Commentary BOI AXA Mid and Small Cap Equity and Debt Fund Sundaram Equity Hybrid Fund SBI Multi Asset Allocation Fund ICICI Prudential Multi-Asset Fund ICICI Prudential Equity and Debt Fund Point 1 Bottom quartile AUM (₹1,482 Cr). Bottom quartile AUM (₹1,954 Cr). Lower mid AUM (₹18,290 Cr). Highest AUM (₹84,165 Cr). Upper mid AUM (₹50,033 Cr). Point 2 Established history (9+ yrs). Oldest track record among peers (26 yrs). Established history (20+ yrs). Established history (23+ yrs). Established history (26+ yrs). Point 3 Not Rated. Rating: 2★ (lower mid). Top rated. Rating: 2★ (bottom quartile). Rating: 4★ (upper mid). Point 4 Risk profile: Moderately High. Risk profile: Moderately High. Risk profile: Moderate. Risk profile: Moderately High. Risk profile: Moderately High. Point 5 5Y return: 14.23% (lower mid). 5Y return: 14.20% (bottom quartile). 5Y return: 13.24% (bottom quartile). 5Y return: 17.06% (top quartile). 5Y return: 16.42% (upper mid). Point 6 3Y return: 18.73% (top quartile). 3Y return: 16.03% (upper mid). 3Y return: 15.75% (lower mid). 3Y return: 15.66% (bottom quartile). 3Y return: 15.37% (bottom quartile). Point 7 1Y return: 8.21% (lower mid). 1Y return: 27.10% (top quartile). 1Y return: 10.75% (upper mid). 1Y return: 6.40% (bottom quartile). 1Y return: 3.25% (bottom quartile). Point 8 1M return: 2.44% (top quartile). 1M return: 1.80% (lower mid). 1M return: 0.36% (bottom quartile). 1M return: 0.86% (bottom quartile). 1M return: 2.03% (upper mid). Point 9 Alpha: 0.00 (lower mid). Alpha: 5.81 (top quartile). Alpha: 0.00 (bottom quartile). Alpha: 0.00 (bottom quartile). Alpha: 1.75 (upper mid). Point 10 Sharpe: 0.50 (lower mid). Sharpe: 2.64 (top quartile). Sharpe: 0.78 (upper mid). Sharpe: 0.18 (bottom quartile). Sharpe: -0.21 (bottom quartile). BOI AXA Mid and Small Cap Equity and Debt Fund
Sundaram Equity Hybrid Fund
SBI Multi Asset Allocation Fund
ICICI Prudential Multi-Asset Fund
ICICI Prudential Equity and Debt Fund
மொத்த தொகை முதலீட்டிற்கான சிறந்த குறியீட்டு நிதிகள்
ஒரு குறியீட்டு நிதியின் போர்ட்ஃபோலியோ பங்குகள் மற்றும் பிற கருவிகளைக் குறியீட்டில் உள்ள அதே விகிதத்தில் கொண்டுள்ளது. வேறு வார்த்தைகளில் கூறுவதானால், இந்தத் திட்டங்கள் குறியீட்டின் செயல்திறனைப் பிரதிபலிக்கின்றன. இவை செயலற்ற முறையில் நிர்வகிக்கப்படும் நிதிகள் மற்றும் மொத்தத் தொகை முதலீட்டிற்கான சிறந்த தேர்வாகக் கருதப்படலாம். சில சிறந்தவைகுறியீட்டு நிதிகள் மொத்த முதலீட்டிற்குத் தேர்ந்தெடுக்கக்கூடியவை பின்வருமாறு.
Fund NAV Net Assets (Cr) 3 MO (%) 6 MO (%) 1 YR (%) 3 YR (%) 5 YR (%) 2025 (%) Nippon India Index Fund - Sensex Plan Growth ₹39.4561
↑ 0.00 ₹894 -0.7 -7.1 -6 6 8.4 9.8 LIC MF Index Fund Sensex Growth ₹144.441
↓ 0.00 ₹88 -0.9 -7.2 -6.5 5.4 7.9 9.1 Franklin India Index Fund Nifty Plan Growth ₹195.053
↓ -0.05 ₹713 -0.2 -5.8 -3.8 7.8 9.2 11.3 IDBI Nifty Index Fund Growth ₹36.2111
↓ -0.02 ₹208 9.1 11.9 16.2 20.3 11.7 Nippon India Index Fund - Nifty Plan Growth ₹41.068
↓ -0.01 ₹3,662 -0.2 -5.7 -3.7 7.9 9.1 11.4 Note: Returns up to 1 year are on absolute basis & more than 1 year are on CAGR basis. as on 16 Jul 26 Research Highlights & Commentary of 5 Funds showcased
Commentary Nippon India Index Fund - Sensex Plan LIC MF Index Fund Sensex Franklin India Index Fund Nifty Plan IDBI Nifty Index Fund Nippon India Index Fund - Nifty Plan Point 1 Upper mid AUM (₹894 Cr). Bottom quartile AUM (₹88 Cr). Lower mid AUM (₹713 Cr). Bottom quartile AUM (₹208 Cr). Highest AUM (₹3,662 Cr). Point 2 Established history (15+ yrs). Established history (23+ yrs). Oldest track record among peers (25 yrs). Established history (16+ yrs). Established history (15+ yrs). Point 3 Top rated. Rating: 1★ (upper mid). Rating: 1★ (lower mid). Rating: 1★ (bottom quartile). Rating: 1★ (bottom quartile). Point 4 Risk profile: Moderately High. Risk profile: Moderately High. Risk profile: Moderately High. Risk profile: Moderately High. Risk profile: Moderately High. Point 5 5Y return: 8.39% (bottom quartile). 5Y return: 7.89% (bottom quartile). 5Y return: 9.16% (upper mid). 5Y return: 11.74% (top quartile). 5Y return: 9.13% (lower mid). Point 6 3Y return: 6.00% (bottom quartile). 3Y return: 5.41% (bottom quartile). 3Y return: 7.77% (lower mid). 3Y return: 20.28% (top quartile). 3Y return: 7.85% (upper mid). Point 7 1Y return: -6.01% (bottom quartile). 1Y return: -6.49% (bottom quartile). 1Y return: -3.84% (lower mid). 1Y return: 16.16% (top quartile). 1Y return: -3.75% (upper mid). Point 8 1M return: 1.49% (upper mid). 1M return: 1.45% (lower mid). 1M return: 1.22% (bottom quartile). 1M return: 3.68% (top quartile). 1M return: 1.22% (bottom quartile). Point 9 Alpha: -0.53 (upper mid). Alpha: -1.14 (bottom quartile). Alpha: -0.58 (lower mid). Alpha: -1.03 (bottom quartile). Alpha: -0.46 (top quartile). Point 10 Sharpe: -0.75 (bottom quartile). Sharpe: -0.79 (bottom quartile). Sharpe: -0.54 (lower mid). Sharpe: 1.04 (top quartile). Sharpe: -0.53 (upper mid). Nippon India Index Fund - Sensex Plan
LIC MF Index Fund Sensex
Franklin India Index Fund Nifty Plan
IDBI Nifty Index Fund
Nippon India Index Fund - Nifty Plan
கடந்த 1 மாதத்தின் அடிப்படையில் சிறந்த மியூச்சுவல் ஃபண்டுகள்
(Erstwhile SBI Pharma Fund) To provide the investors maximum growth opportunity through equity
investments in stocks of growth oriented sectors of the economy. Below is the key information for SBI Healthcare Opportunities Fund Returns up to 1 year are on (Erstwhile UTI Pharma & Healthcare Fund) The Investment objective of the Scheme is capital appreciation through investments in equities and equity related instruments of the Pharma & Healthcare sectors. Research Highlights for UTI Healthcare Fund Below is the key information for UTI Healthcare Fund Returns up to 1 year are on (Erstwhile Motilal Oswal MOSt Focused Midcap 30 Fund) The investment objective of the Scheme is to achieve long term capital appreciation by investing in a maximum of 30 quality mid-cap companies having long-term competitive advantages and potential for growth. However, there can be no assurance or guarantee that the investment objective of the Scheme would be achieved. Research Highlights for Motilal Oswal Midcap 30 Fund Below is the key information for Motilal Oswal Midcap 30 Fund Returns up to 1 year are on (Erstwhile Invesco India Growth Fund) The investment objective of the Scheme is to generate long-term capital growth from a diversified portfolio of predominantly equity and equity-related securities. However, there can be no assurance that the objectives of the scheme will be achieved. Research Highlights for Invesco India Growth Opportunities Fund Below is the key information for Invesco India Growth Opportunities Fund Returns up to 1 year are on (Erstwhile Motilal Oswal MOSt Focused Multicap 35 Fund) The investment objective of the Scheme is to achieve long term capital appreciation by primarily investing in a maximum of 35 equity & equity related instruments across sectors and market-capitalization levels.However, there can be no assurance or guarantee that the investment objective of the Scheme would be achieved. Research Highlights for Motilal Oswal Multicap 35 Fund Below is the key information for Motilal Oswal Multicap 35 Fund Returns up to 1 year are on 1. SBI Healthcare Opportunities Fund
SBI Healthcare Opportunities Fund
Growth Launch Date 31 Dec 04 NAV (15 Jul 26) ₹504.895 ↑ 3.16 (0.63 %) Net Assets (Cr) ₹4,566 on 31 May 26 Category Equity - Sectoral AMC SBI Funds Management Private Limited Rating ☆☆ Risk High Expense Ratio 1.97 Sharpe Ratio 0.36 Information Ratio -0.4 Alpha Ratio -0.04 Min Investment 5,000 Min SIP Investment 500 Exit Load 0-15 Days (0.5%),15 Days and above(NIL) Growth of 10,000 investment over the years.
Date Value 30 Jun 21 ₹10,000 30 Jun 22 ₹8,662 30 Jun 23 ₹11,165 30 Jun 24 ₹15,491 30 Jun 25 ₹18,739 30 Jun 26 ₹21,357 Returns for SBI Healthcare Opportunities Fund
absolute basis & more than 1 year are on CAGR (Compound Annual Growth Rate) basis. as on 15 Jul 26 Duration Returns 1 Month 7.5% 3 Month 18.1% 6 Month 19.9% 1 Year 14.8% 3 Year 23.8% 5 Year 16.6% 10 Year 15 Year Since launch 15.6% Historical performance (Yearly) on absolute basis
Year Returns 2025 -3.5% 2024 42.2% 2023 38.2% 2022 -6% 2021 20.1% 2020 65.8% 2019 -0.5% 2018 -9.9% 2017 2.1% 2016 -14% Fund Manager information for SBI Healthcare Opportunities Fund
Name Since Tenure Tanmaya Desai 1 Jun 11 15.09 Yr. Data below for SBI Healthcare Opportunities Fund as on 31 May 26
Equity Sector Allocation
Sector Value Health Care 88.67% Basic Materials 8.82% Asset Allocation
Asset Class Value Cash 2.45% Equity 97.49% Debt 0.06% Top Securities Holdings / Portfolio
Name Holding Value Quantity Sun Pharmaceuticals Industries Ltd (Healthcare)
Equity, Since 31 Dec 17 | SUNPHARMA11% ₹504 Cr 2,800,000 Divi's Laboratories Ltd (Healthcare)
Equity, Since 31 Mar 12 | DIVISLAB7% ₹300 Cr 450,000 Acutaas Chemicals Ltd (Basic Materials)
Equity, Since 30 Jun 24 | 5433496% ₹282 Cr 900,000 Apollo Hospitals Enterprise Ltd (Healthcare)
Equity, Since 31 Jan 26 | APOLLOHOSP5% ₹245 Cr 300,000 Max Healthcare Institute Ltd Ordinary Shares (Healthcare)
Equity, Since 31 Mar 21 | MAXHEALTH5% ₹217 Cr 2,250,000 Aurobindo Pharma Ltd (Healthcare)
Equity, Since 31 Mar 26 | AUROPHARMA4% ₹178 Cr 1,250,000
↑ 250,000 Aster DM Healthcare Ltd Ordinary Shares (Healthcare)
Equity, Since 31 Mar 24 | ASTERDM4% ₹175 Cr 2,400,000 Laurus Labs Ltd (Healthcare)
Equity, Since 31 Aug 23 | LAURUSLABS4% ₹163 Cr 1,200,000 Biocon Ltd (Healthcare)
Equity, Since 30 Nov 24 | BIOCON4% ₹161 Cr 3,750,000 Torrent Pharmaceuticals Ltd (Healthcare)
Equity, Since 30 Jun 21 | TORNTPHARM3% ₹159 Cr 360,000 2. UTI Healthcare Fund
UTI Healthcare Fund
Growth Launch Date 28 Jun 99 NAV (16 Jul 26) ₹335.106 ↑ 1.17 (0.35 %) Net Assets (Cr) ₹1,217 on 31 May 26 Category Equity - Sectoral AMC UTI Asset Management Company Ltd Rating ☆ Risk High Expense Ratio 2.26 Sharpe Ratio 0.42 Information Ratio 0.08 Alpha Ratio 0.91 Min Investment 5,000 Min SIP Investment 500 Exit Load 0-1 Years (1%),1 Years and above(NIL) Growth of 10,000 investment over the years.
Date Value 30 Jun 21 ₹10,000 30 Jun 22 ₹8,478 30 Jun 23 ₹10,006 30 Jun 24 ₹14,264 30 Jun 25 ₹17,337 30 Jun 26 ₹19,764 Returns for UTI Healthcare Fund
absolute basis & more than 1 year are on CAGR (Compound Annual Growth Rate) basis. as on 15 Jul 26 Duration Returns 1 Month 7.2% 3 Month 17.5% 6 Month 19% 1 Year 13.6% 3 Year 25.8% 5 Year 14.6% 10 Year 15 Year Since launch 15% Historical performance (Yearly) on absolute basis
Year Returns 2025 -3.1% 2024 42.9% 2023 38.2% 2022 -12.3% 2021 19.1% 2020 67.4% 2019 1.2% 2018 -7.5% 2017 6.2% 2016 -9.7% Fund Manager information for UTI Healthcare Fund
Name Since Tenure Kamal Gada 2 May 22 4.17 Yr. Data below for UTI Healthcare Fund as on 31 May 26
Equity Sector Allocation
Sector Value Health Care 94.45% Asset Allocation
Asset Class Value Cash 5.55% Equity 94.45% Top Securities Holdings / Portfolio
Name Holding Value Quantity Sun Pharmaceuticals Industries Ltd (Healthcare)
Equity, Since 31 Oct 06 | SUNPHARMA9% ₹108 Cr 600,000 Divi's Laboratories Ltd (Healthcare)
Equity, Since 30 Sep 17 | DIVISLAB5% ₹59 Cr 88,814
↑ 28,076 Ajanta Pharma Ltd (Healthcare)
Equity, Since 31 Jul 17 | AJANTPHARM5% ₹57 Cr 195,295
↓ -41,216 Gland Pharma Ltd (Healthcare)
Equity, Since 30 Nov 20 | GLAND4% ₹48 Cr 215,251 Lupin Ltd (Healthcare)
Equity, Since 28 Feb 25 | LUPIN4% ₹46 Cr 203,834
↓ -6,166 Apollo Hospitals Enterprise Ltd (Healthcare)
Equity, Since 30 Apr 21 | APOLLOHOSP4% ₹43 Cr 53,000 Dr Reddy's Laboratories Ltd (Healthcare)
Equity, Since 28 Feb 18 | DRREDDY3% ₹38 Cr 290,000 Caplin Point Laboratories Ltd (Healthcare)
Equity, Since 31 Dec 23 | CAPLIPOINT3% ₹37 Cr 185,000
↑ 39,847 Alkem Laboratories Ltd (Healthcare)
Equity, Since 31 May 21 | ALKEM3% ₹37 Cr 68,000 Fortis Healthcare Ltd (Healthcare)
Equity, Since 31 Dec 20 | FORTIS3% ₹37 Cr 400,000 3. Motilal Oswal Midcap 30 Fund
Motilal Oswal Midcap 30 Fund
Growth Launch Date 24 Feb 14 NAV (16 Jul 26) ₹98.9785 ↓ -0.72 (-0.72 %) Net Assets (Cr) ₹36,458 on 31 May 26 Category Equity - Mid Cap AMC Motilal Oswal Asset Management Co. Ltd Rating ☆☆☆ Risk Moderately High Expense Ratio 1.56 Sharpe Ratio -0.55 Information Ratio -0.36 Alpha Ratio -14.76 Min Investment 5,000 Min SIP Investment 500 Exit Load 0-1 Years (1%),1 Years and above(NIL) Growth of 10,000 investment over the years.
Date Value 30 Jun 21 ₹10,000 30 Jun 22 ₹11,908 30 Jun 23 ₹16,418 30 Jun 24 ₹26,938 30 Jun 25 ₹29,503 30 Jun 26 ₹26,510 Returns for Motilal Oswal Midcap 30 Fund
absolute basis & more than 1 year are on CAGR (Compound Annual Growth Rate) basis. as on 15 Jul 26 Duration Returns 1 Month 6.7% 3 Month 8.4% 6 Month 2.3% 1 Year -3.3% 3 Year 18.9% 5 Year 22.2% 10 Year 15 Year Since launch 20.4% Historical performance (Yearly) on absolute basis
Year Returns 2025 -12.1% 2024 57.1% 2023 41.7% 2022 10.7% 2021 55.8% 2020 9.3% 2019 9.7% 2018 -12.7% 2017 30.8% 2016 5.2% Fund Manager information for Motilal Oswal Midcap 30 Fund
Name Since Tenure Varun Sharma 21 Jan 26 0.44 Yr. Swapnil Mayekar 18 Nov 25 0.62 Yr. Ajay Khandelwal 1 Oct 24 1.75 Yr. Ankit Agarwal 21 Jan 26 0.44 Yr. Rakesh Shetty 22 Nov 22 3.61 Yr. Data below for Motilal Oswal Midcap 30 Fund as on 31 May 26
Equity Sector Allocation
Sector Value Financial Services 31.02% Technology 26.84% Industrials 13.76% Consumer Cyclical 13.41% Communication Services 3.08% Real Estate 2.81% Health Care 2.46% Asset Allocation
Asset Class Value Cash 6.63% Equity 93.37% Top Securities Holdings / Portfolio
Name Holding Value Quantity One97 Communications Ltd (Technology)
Equity, Since 30 Sep 24 | PAYTM7% ₹2,659 Cr 23,765,865 Coforge Ltd (Technology)
Equity, Since 31 Mar 23 | COFORGE6% ₹2,233 Cr 15,703,312
↓ -979,603 Kalyan Jewellers India Ltd (Consumer Cyclical)
Equity, Since 29 Feb 24 | KALYANKJIL6% ₹2,180 Cr 61,413,395 KEI Industries Ltd (Industrials)
Equity, Since 30 Nov 24 | KEI6% ₹2,123 Cr 4,030,834 Eternal Ltd (Consumer Cyclical)
Equity, Since 31 Aug 25 | ETERNAL6% ₹2,115 Cr 84,386,866 Persistent Systems Ltd (Technology)
Equity, Since 31 Jan 23 | PERSISTENT6% ₹2,091 Cr 4,026,493 Aditya Birla Capital Ltd (Financial Services)
Equity, Since 30 Jun 25 | ABCAPITAL5% ₹1,906 Cr 52,459,381
↓ -1,000,000 Billionbrains Garage Ventures Ltd (Financial Services)
Equity, Since 31 Jan 26 | GROWW4% ₹1,564 Cr 84,616,660 Multi Commodity Exchange of India Ltd (Financial Services)
Equity, Since 31 Jan 26 | MCX4% ₹1,539 Cr 5,209,458 BSE Ltd (Financial Services)
Equity, Since 30 Nov 25 | BSE4% ₹1,451 Cr 3,500,830
↓ -256,232 4. Invesco India Growth Opportunities Fund
Invesco India Growth Opportunities Fund
Growth Launch Date 9 Aug 07 NAV (16 Jul 26) ₹109.98 ↑ 0.19 (0.17 %) Net Assets (Cr) ₹10,153 on 31 May 26 Category Equity - Large & Mid Cap AMC Invesco Asset Management (India) Private Ltd Rating ☆☆☆☆☆ Risk Moderately High Expense Ratio 1.82 Sharpe Ratio 0.07 Information Ratio 0.87 Alpha Ratio 2.71 Min Investment 5,000 Min SIP Investment 100 Exit Load 0-1 Years (1%),1 Years and above(NIL) Growth of 10,000 investment over the years.
Date Value 30 Jun 21 ₹10,000 30 Jun 22 ₹9,616 30 Jun 23 ₹12,058 30 Jun 24 ₹18,524 30 Jun 25 ₹21,406 30 Jun 26 ₹22,689 Returns for Invesco India Growth Opportunities Fund
absolute basis & more than 1 year are on CAGR (Compound Annual Growth Rate) basis. as on 15 Jul 26 Duration Returns 1 Month 6% 3 Month 13.1% 6 Month 11.9% 1 Year 7.4% 3 Year 23.4% 5 Year 17.3% 10 Year 15 Year Since launch 13.5% Historical performance (Yearly) on absolute basis
Year Returns 2025 4.7% 2024 37.5% 2023 31.6% 2022 -0.4% 2021 29.7% 2020 13.3% 2019 10.7% 2018 -0.2% 2017 39.6% 2016 3.3% Fund Manager information for Invesco India Growth Opportunities Fund
Name Since Tenure Aditya Khemani 9 Nov 23 2.64 Yr. Data below for Invesco India Growth Opportunities Fund as on 31 May 26
Equity Sector Allocation
Sector Value Financial Services 26.21% Health Care 18.9% Industrials 18.79% Consumer Cyclical 17.87% Real Estate 7.6% Basic Materials 4.07% Technology 2.71% Communication Services 1.71% Utility 1.37% Asset Allocation
Asset Class Value Cash 0.76% Equity 99.23% Top Securities Holdings / Portfolio
Name Holding Value Quantity Max Healthcare Institute Ltd Ordinary Shares (Healthcare)
Equity, Since 30 Nov 22 | MAXHEALTH7% ₹687 Cr 7,118,724
↑ 170,000 Eternal Ltd (Consumer Cyclical)
Equity, Since 30 Jun 23 | ETERNAL7% ₹684 Cr 27,307,479
↑ 2,577,787 InterGlobe Aviation Ltd (Industrials)
Equity, Since 31 Mar 24 | INDIGO6% ₹654 Cr 1,484,863
↑ 95,086 ICICI Bank Ltd (Financial Services)
Equity, Since 31 Dec 15 | ICICIBANK6% ₹646 Cr 5,141,398
↑ 511,565 Sai Life Sciences Ltd (Healthcare)
Equity, Since 31 Dec 24 | SAILIFE5% ₹497 Cr 4,283,799 Trent Ltd (Consumer Cyclical)
Equity, Since 28 Feb 22 | TRENT5% ₹460 Cr 1,089,122 Prestige Estates Projects Ltd (Real Estate)
Equity, Since 31 Dec 23 | PRESTIGE4% ₹452 Cr 3,304,450
↑ 174,545 ABB India Ltd (Industrials)
Equity, Since 30 Jun 23 | ABB4% ₹441 Cr 608,622
↑ 143,577 BSE Ltd (Financial Services)
Equity, Since 31 Oct 23 | BSE4% ₹396 Cr 955,364
↓ -149,234 L&T Finance Ltd (Financial Services)
Equity, Since 30 Apr 24 | LTF3% ₹325 Cr 11,339,315 5. Motilal Oswal Multicap 35 Fund
Motilal Oswal Multicap 35 Fund
Growth Launch Date 28 Apr 14 NAV (16 Jul 26) ₹60.4684 ↓ -0.29 (-0.48 %) Net Assets (Cr) ₹12,937 on 31 May 26 Category Equity - Multi Cap AMC Motilal Oswal Asset Management Co. Ltd Rating ☆☆☆☆☆ Risk Moderately High Expense Ratio 1.77 Sharpe Ratio -0.52 Information Ratio 0.47 Alpha Ratio -5.87 Min Investment 5,000 Min SIP Investment 500 Exit Load 0-1 Years (1%),1 Years and above(NIL) Growth of 10,000 investment over the years.
Date Value 30 Jun 21 ₹10,000 30 Jun 22 ₹8,925 30 Jun 23 ₹10,742 30 Jun 24 ₹16,691 30 Jun 25 ₹19,055 30 Jun 26 ₹17,562 Returns for Motilal Oswal Multicap 35 Fund
absolute basis & more than 1 year are on CAGR (Compound Annual Growth Rate) basis. as on 15 Jul 26 Duration Returns 1 Month 6% 3 Month 8% 6 Month 1.4% 1 Year -3.1% 3 Year 18.5% 5 Year 12.2% 10 Year 15 Year Since launch 15.9% Historical performance (Yearly) on absolute basis
Year Returns 2025 -5.6% 2024 45.7% 2023 31% 2022 -3% 2021 15.3% 2020 10.3% 2019 7.9% 2018 -7.8% 2017 43.1% 2016 8.5% Fund Manager information for Motilal Oswal Multicap 35 Fund
Name Since Tenure Varun Sharma 21 Jan 26 0.44 Yr. Swapnil Mayekar 18 Nov 25 0.62 Yr. Ajay Khandelwal 1 Oct 24 1.75 Yr. Ankit Agarwal 21 Jan 26 0.44 Yr. Rakesh Shetty 22 Nov 22 3.61 Yr. Atul Mehra 1 Oct 24 1.75 Yr. Data below for Motilal Oswal Multicap 35 Fund as on 31 May 26
Equity Sector Allocation
Sector Value Industrials 28.27% Financial Services 21.24% Consumer Cyclical 19.01% Technology 17.65% Health Care 6.26% Basic Materials 2.26% Asset Allocation
Asset Class Value Cash 5.31% Equity 94.69% Top Securities Holdings / Portfolio
Name Holding Value Quantity CG Power & Industrial Solutions Ltd (Industrials)
Equity, Since 31 Jan 25 | CGPOWER7% ₹853 Cr 9,300,000
↓ -800,000 Kalyan Jewellers India Ltd (Consumer Cyclical)
Equity, Since 30 Sep 23 | KALYANKJIL6% ₹809 Cr 22,782,390 Eternal Ltd (Consumer Cyclical)
Equity, Since 31 May 25 | ETERNAL5% ₹689 Cr 27,500,000 Coforge Ltd (Technology)
Equity, Since 31 May 23 | COFORGE5% ₹628 Cr 4,415,566
↓ -1,216,327 Persistent Systems Ltd (Technology)
Equity, Since 31 Mar 23 | PERSISTENT5% ₹598 Cr 1,150,675
↓ -61,486 Waaree Energies Ltd (Technology)
Equity, Since 28 Feb 26 | WAAREEENER4% ₹534 Cr 1,700,905
↑ 40,684 Shriram Finance Ltd (Financial Services)
Equity, Since 31 Mar 26 | SHRIRAMFIN4% ₹533 Cr 5,630,608 Ather Energy Ltd (Consumer Cyclical)
Equity, Since 28 Feb 26 | ATHERENERG4% ₹502 Cr 5,202,599
↑ 4,053 Multi Commodity Exchange of India Ltd (Financial Services)
Equity, Since 28 Feb 26 | MCX4% ₹473 Cr 1,600,000 IndusInd Bank Ltd (Financial Services)
Equity, Since 28 Feb 26 | INDUSINDBK4% ₹460 Cr 5,030,673
மொத்த தொகை முதலீட்டின் போது கருத்தில் கொள்ள வேண்டியவை
மியூச்சுவல் ஃபண்டுகளில் முதலீடு செய்வதற்கு முன், தனிநபர்கள் நிறைய அளவுருக்களைக் கவனிக்க வேண்டும். இதில் அடங்கும்:
சந்தையின் நேரம்
மொத்த முதலீடு என்று வரும்போது, தனிநபர்கள் எப்போதும் தேட வேண்டும்சந்தை குறிப்பாக சமபங்கு அடிப்படையிலான நிதிகள் தொடர்பான நேரங்கள். மொத்தத் தொகையை முதலீடு செய்வதற்கான நல்ல நேரம், சந்தைகள் குறைவாக இருக்கும்போது, அவை விரைவில் பாராட்டத் தொடங்கும் வாய்ப்பு உள்ளது. இருப்பினும், சந்தைகள் ஏற்கனவே உச்சத்தில் இருந்தால், மொத்த முதலீட்டில் இருந்து விலகி இருப்பது நல்லது.
பல்வகைப்படுத்தல்
பல்வகைப்படுத்தல் என்பது ஒரு முக்கிய அம்சமாகும், இது மொத்த தொகையை முதலீடு செய்வதற்கு முன் கருத்தில் கொள்ள வேண்டும். தனிநபர்கள் மொத்தமாக முதலீடு செய்தால், பல வழிகளில் பரவுவதன் மூலம் தங்கள் முதலீடுகளை பன்முகப்படுத்த வேண்டும். திட்டங்களில் ஒன்று செயல்படாவிட்டாலும் அவர்களின் ஒட்டுமொத்த போர்ட்ஃபோலியோ சிறப்பாக செயல்படுவதை உறுதிசெய்ய இது உதவும்.
உங்கள் நோக்கத்தின்படி உங்கள் முதலீட்டைச் செய்யுங்கள்
தனிநபர்கள் செய்யும் எந்த முதலீடும் ஒரு குறிப்பிட்ட நோக்கத்தை அடைவதாகும். எனவே, திட்டத்தின் அணுகுமுறை இதனுடன் ஒத்துப்போகிறதா என்பதை தனிநபர்கள் சரிபார்க்க வேண்டும்முதலீட்டாளர்நோக்கம். இங்கே, தனிநபர்கள் பல்வேறு அளவுருக்களைத் தேட வேண்டும்சிஏஜிஆர் திட்டத்தில் முதலீடு செய்வதற்கு முன் வருமானம், முழுமையான வருமானம், வரி விதிப்பின் தாக்கம் மற்றும் பல.
மீட்பு சரியான நேரத்தில் செய்யப்பட வேண்டும்
தனிநபர்கள் செய்ய வேண்டும்மீட்பு சரியான நேரத்தில் மொத்த முதலீடு. முதலீட்டு நோக்கத்தின்படி அது இன்னும் இருக்கலாம்; தனிநபர்கள் தாங்கள் முதலீடு செய்ய திட்டமிட்டுள்ள திட்டத்தை சரியான நேரத்தில் மதிப்பாய்வு செய்ய வேண்டும். இருப்பினும், அவர்கள் தங்கள் முதலீடுகளை நீண்ட காலத்திற்கு வைத்திருக்க வேண்டும், இதனால் அவர்கள் அதிகபட்ச நன்மைகளை அனுபவிக்க முடியும்.
மியூச்சுவல் ஃபண்ட் லம்ப் சம் ரிட்டர்ன் கால்குலேட்டர்
மியூச்சுவல் ஃபண்ட் லம்ப் சம் ரிட்டர்ன் கால்குலேட்டர், ஒரு தனிநபரின் மொத்தத் தொகை முதலீடு ஒரு குறிப்பிட்ட காலக்கட்டத்தில் எவ்வாறு வளர்கிறது என்பதைக் காட்ட தனிநபர்களுக்கு உதவுகிறது. மொத்த தொகை கால்குலேட்டரில் உள்ளீடு செய்ய வேண்டிய சில தரவுகளில் முதலீட்டின் காலம், ஆரம்ப முதலீட்டுத் தொகை, நீண்ட கால எதிர்பார்க்கப்படும் வளர்ச்சி விகிதம் மற்றும் பலவற்றை உள்ளடக்கியது. மியூச்சுவல் ஃபண்ட் லம்ப்சம் ரிட்டர்ன் கால்குலேட்டரின் விளக்கம் பின்வருமாறு.
விளக்கப்படம்
மொத்த தொகை முதலீடு: இந்திய ரூபாய் 25,000
முதலீட்டு காலம்: 15 வருடங்கள்
நீண்ட கால வளர்ச்சி விகிதம் (தோராயமாக): 15%
மொத்த தொகை கால்குலேட்டரின்படி எதிர்பார்க்கப்படும் வருமானம்: இந்திய ரூபாய் 2,03,427
முதலீட்டின் நிகர லாபம்: இந்திய ரூபாய் 1,78,427
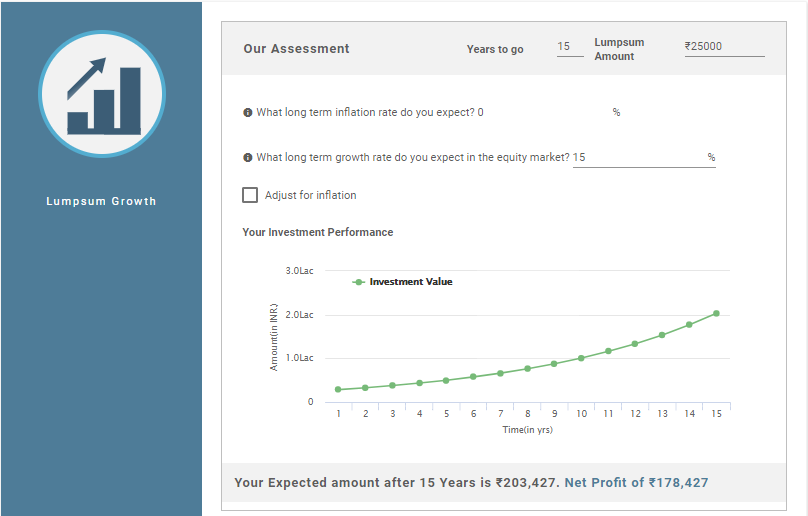
எனவே, மேலே உள்ள கணக்கீடு, உங்கள் முதலீட்டின் மீதான முதலீட்டின் நிகர லாபம் INR 1,78,427 என்றும் உங்கள் முதலீட்டின் மொத்த மதிப்பு INR 2,03,427 என்றும் காட்டுகிறது..
மியூச்சுவல் ஃபண்டில் ஒரு முறை முதலீட்டின் நன்மைகள் மற்றும் தீமைகள்
SIP ஐப் போலவே, மொத்தத் தொகை முதலீட்டிலும் அதன் சொந்த நன்மைகள் மற்றும் தீமைகள் உள்ளன. எனவே, இந்த நன்மைகள் மற்றும் தீமைகள் பற்றி பார்ப்போம்.
நன்மைகள்
மொத்தத் தொகை முதலீட்டின் நன்மைகள் பின்வருமாறு.
- பெரிய தொகையை முதலீடு செய்யுங்கள்: தனிநபர்கள் மியூச்சுவல் ஃபண்டுகளில் பெரிய தொகையை முதலீடு செய்யலாம் மற்றும் நிதியை செயலற்ற நிலையில் வைத்திருப்பதற்குப் பதிலாக அதிக வருமானத்தைப் பெறலாம்.
- நீண்ட காலத்திற்கு ஏற்றது: நீண்ட கால முதலீடுகளுக்கு, குறிப்பாக ஈக்விட்டி ஃபண்டுகளில் மொத்த முதலீட்டு முறை நல்லது. இருப்பினும், கடன் நிதிகளின் விஷயத்தில், பதவிக்காலம் குறுகிய அல்லது நடுத்தர காலமாக இருக்கலாம்
- வசதி: ஒரு முறை மட்டுமே பணம் செலுத்தப்படுவதால், வழக்கமான இடைவெளியில் கழிக்கப்படுவதில்லை என்பதால், மொத்த முதலீட்டு முறை வசதியானது.
தீமைகள்
மொத்தத் தொகை முதலீட்டின் தீமைகள்:
- ஒழுங்கற்ற முதலீடு: மொத்த தொகை முதலீடு முதலீட்டாளரின் வழக்கமான சேமிப்பை உறுதி செய்யாது, ஏனெனில் இது வழக்கமான சேமிப்பு பழக்கத்தை ஏற்படுத்தாது.
- அதிக ஆபத்து: மொத்த தொகை முதலீட்டில், நேரத்தைப் பார்ப்பது முக்கியம். ஏனென்றால், மொத்த தொகை முறையில் முதலீடு ஒரு முறை மட்டுமே செய்யப்படுகிறது மற்றும் சீரான இடைவெளியில் அல்ல. எனவே, தனிநபர்கள் நேரத்தைக் கருத்தில் கொள்ளவில்லை என்றால், அவர்கள் இழப்புகளில் முடிவடையும்.
முடிவுரை
எனவே, மேலே உள்ள குறிப்புகளில் இருந்து, மியூச்சுவல் ஃபண்டுகளில் முதலீடு செய்ய மொத்த தொகை முறையும் ஒரு நல்ல வழி என்று கூறலாம். இருப்பினும், திட்டத்தில் மொத்த தொகையை முதலீடு செய்யும் போது தனிநபர்கள் நம்பிக்கையுடன் இருக்க வேண்டும். இல்லையெனில், அவர்கள் SIP முதலீட்டு முறையைத் தேர்வு செய்யலாம். கூடுதலாக, மக்கள் முதலீடு செய்வதற்கு முன் திட்டத்தின் முறைகளைப் புரிந்து கொள்ள வேண்டும். தேவைப்பட்டால், அவர்கள் கூட ஆலோசனை செய்யலாம்நிதி ஆலோசகர். இது அவர்களின் பணம் பாதுகாப்பாக இருப்பதையும், அவர்களின் நோக்கங்கள் சரியான நேரத்தில் நிறைவேற்றப்படுவதையும் உறுதிசெய்ய உதவும்.
இங்கு வழங்கப்பட்ட தகவல்கள் துல்லியமானவை என்பதை உறுதிப்படுத்த அனைத்து முயற்சிகளும் மேற்கொள்ளப்பட்டுள்ளன. இருப்பினும், தரவின் சரியான தன்மை குறித்து எந்த உத்தரவாதமும் அளிக்கப்படவில்லை. முதலீடு செய்வதற்கு முன் திட்டத் தகவல் ஆவணத்துடன் சரிபார்க்கவும்.
You Might Also Like


AMFI Registration No. 112358 | CIN: U74999MH2016PTC282153
Shepard Technologies Pvt. Ltd. (with ARN code 112358) makes no warranties or representations, express or implied, on products offered through the platform. It accepts no liability for any damages or losses, however caused, in connection with the use of, or on the reliance of its product or related services. Terms and conditions of the website are applicable.
©2026 Shepard Technologies Private Limited. All Rights Reserved
Research Highlights for SBI Healthcare Opportunities Fund