میوچل فنڈز میں یکمشت سرمایہ کاری کے فوائد
یکمشت سرمایہ کاری سے مراد ہے۔سرمایہ کاری میوچل فنڈ اسکیم میں کافی رقم۔ یکمشت سرمایہ کاری میں، رقم ایک بار کی ادائیگی کے طور پر جمع کی جاتی ہے۔ وہ افراد جن کے پاس بہت زیادہ رقم ہے وہ Mutual Fund میں ایک اہم رقم جمع کر سکتے ہیں۔ سرمایہ کاری کا یکمشت موڈ سسٹمیٹک کے برعکس ہے۔سرمایہ کاری کا منصوبہ یاگھونٹ موڈ کوئی بھی یا تو فکسڈ میں یکمشت رقم کی سرمایہ کاری کر سکتا ہے۔آمدنی یاایکویٹی فنڈز ان کی خطرے کی بھوک، سرمایہ کاری کی مدت، اور سرمایہ کاری کے مقصد پر منحصر ہے۔ اگرچہ زیادہ تر افراد ترجیح دیتے ہیں۔میوچل فنڈز میں سرمایہ کاری SIP کے ذریعے ابھی تک، یکمشت سرمایہ کاری کے کچھ فوائد ہیں۔ تو، آئیے ہم ایک ساتھ سرمایہ کاری کے فوائد کو سمجھتے ہیں۔باہمی چندہ.
یکمشت سرمایہ کاری کے فوائد
میوچل فنڈز میں یکمشت سرمایہ کاری کے کچھ فوائد درج ذیل ہیں:
بڑی رقم کی سرمایہ کاری
یکمشت موڈ کے اختیار کے ذریعہ، افراد میوچل فنڈز میں کافی رقم کی سرمایہ کاری کر سکتے ہیں۔ نتیجے کے طور پر، جبمارکیٹ ترقی کی مدت کو ظاہر کرتا ہے، پھر سرمایہ کاری کی قدر بھی قدر کے مقابلے میں کافی حد تک بڑھ جاتی ہے۔SIP سرمایہ کاری.
طویل مدتی مدت کے لیے مثالی۔
یکمشت سرمایہ کاری ان افراد کے لیے موزوں ہے جو طویل مدتی سرمایہ کاری کو ترجیح دیتے ہیں۔ یکمشت سرمایہ کاری کی صورت میں طویل مدتی سرمایہ کاری پر 10 سال یا اس سے زیادہ کی تخمینی سرمایہ کاری کی مدت کے لیے غور کیا جا سکتا ہے۔ تاہم، میں یکمشت سرمایہ کاری کے لیےقرض فنڈ، افراد درمیانی مدت کے لیے سرمایہ کاری کا انتخاب بھی کر سکتے ہیں۔
سہولت
لمپ سم موڈ عام طور پر افراد کے لیے آسان ہوتا ہے کیونکہ جن لوگوں کے پاس بڑی رقم ہوتی ہے وہ اپنی سرمایہ کاری پھیلا سکتے ہیں۔ تاہم، اگر سرمایہ کاری ایس آئی پی موڈ کے ذریعے کی جاتی ہے تو انہیں محتاط رہنا ہوگا کہ رقم باقاعدگی سے وقفوں پر لگائی جائے۔
وقت کے لیے سرمایہ کاری کریں۔
جب بھی سرمایہ کار طویل مدتی سرمایہ کاری کا انتخاب کرتے ہیں، تو انہیں ہمیشہ مارکیٹ کا وقت تلاش کرنا چاہیے۔ افراد کو عام طور پر اس وقت سرمایہ کاری کا انتخاب کرنا چاہیے جب مارکیٹیں پہلے سے ہی زوال کا شکار ہوں اور ترقی کے امکانات دکھا رہی ہوں۔ اس صورت حال میں، افراد SIP موڈ کے مقابلے میں یکمشت موڈ کے ذریعے زیادہ منافع کما سکتے ہیں۔ تاہم، اگر یکمشت سرمایہ کاری اس وقت کی جاتی ہے جب مارکیٹ پہلے ہی عروج پر پہنچ چکی ہو، اس صورت میں، افراد کو نقصان ہو سکتا ہے۔

Talk to our investment specialist
2022 کے لیے بہترین پرفارمنگ لمپ سم فنڈز
چونکہ یکمشت سرمایہ کاری طویل مدتی مدت کے لیے کی جاتی ہے، اس کے نتیجے میں، ہم خاص طور پر ایکویٹی کے زمرے میں سرمایہ کاری کرنے کا انتخاب کر سکتے ہیں۔بڑے کیپ فنڈز. لہٰذا، آئیے ہم کچھ بہترین کارکردگی کا مظاہرہ کرنے والی بڑی کیپ میوچل فنڈ اسکیموں پر نظر ڈالتے ہیں جن کا انتخاب یکمشت موڈ کے ذریعے طویل مدتی سرمایہ کاری کے لیے کیا جاسکتا ہے۔
Fund NAV Net Assets (Cr) Min Investment 3 MO (%) 6 MO (%) 1 YR (%) 3 YR (%) 5 YR (%) 2025 (%) IDBI India Top 100 Equity Fund Growth ₹44.16
↑ 0.05 ₹655 5,000 9.2 12.5 15.4 21.9 12.6 JM Core 11 Fund Growth ₹19.6755
↓ -0.01 ₹286 5,000 3.7 4.1 -0.3 12.7 13.1 -1.9 Invesco India Largecap Fund Growth ₹70.19
↓ -0.44 ₹1,847 5,000 3.9 3.2 0.6 12.6 11.5 5.5 ICICI Prudential Bluechip Fund Growth ₹107.21
↓ -0.26 ₹79,421 5,000 0.5 -2.9 -2.6 11.7 12.8 11.3 Bandhan Large Cap Fund Growth ₹76.654
↓ -0.32 ₹2,061 5,000 2 0 -0.9 11.6 11 8.2 Note: Returns up to 1 year are on absolute basis & more than 1 year are on CAGR basis. as on 28 Jul 23 Research Highlights & Commentary of 5 Funds showcased
Commentary IDBI India Top 100 Equity Fund JM Core 11 Fund Invesco India Largecap Fund ICICI Prudential Bluechip Fund Bandhan Large Cap Fund Point 1 Bottom quartile AUM (₹655 Cr). Bottom quartile AUM (₹286 Cr). Lower mid AUM (₹1,847 Cr). Highest AUM (₹79,421 Cr). Upper mid AUM (₹2,061 Cr). Point 2 Established history (14+ yrs). Established history (18+ yrs). Established history (16+ yrs). Established history (18+ yrs). Oldest track record among peers (20 yrs). Point 3 Rating: 3★ (lower mid). Top rated. Rating: 3★ (bottom quartile). Rating: 4★ (upper mid). Rating: 2★ (bottom quartile). Point 4 Risk profile: Moderately High. Risk profile: High. Risk profile: Moderately High. Risk profile: Moderately High. Risk profile: Moderately High. Point 5 5Y return: 12.61% (lower mid). 5Y return: 13.12% (top quartile). 5Y return: 11.46% (bottom quartile). 5Y return: 12.76% (upper mid). 5Y return: 11.02% (bottom quartile). Point 6 3Y return: 21.88% (top quartile). 3Y return: 12.67% (upper mid). 3Y return: 12.63% (lower mid). 3Y return: 11.74% (bottom quartile). 3Y return: 11.55% (bottom quartile). Point 7 1Y return: 15.39% (top quartile). 1Y return: -0.25% (lower mid). 1Y return: 0.57% (upper mid). 1Y return: -2.62% (bottom quartile). 1Y return: -0.87% (bottom quartile). Point 8 Alpha: 2.11 (bottom quartile). Alpha: 2.17 (lower mid). Alpha: 3.75 (top quartile). Alpha: -1.21 (bottom quartile). Alpha: 2.34 (upper mid). Point 9 Sharpe: 1.09 (top quartile). Sharpe: -0.23 (upper mid). Sharpe: -0.25 (lower mid). Sharpe: -0.55 (bottom quartile). Sharpe: -0.35 (bottom quartile). Point 10 Information ratio: 0.14 (bottom quartile). Information ratio: 0.15 (bottom quartile). Information ratio: 0.82 (upper mid). Information ratio: 0.85 (top quartile). Information ratio: 0.63 (lower mid). IDBI India Top 100 Equity Fund
JM Core 11 Fund
Invesco India Largecap Fund
ICICI Prudential Bluechip Fund
Bandhan Large Cap Fund
ایکمشت اوپر AUM/نیٹ اثاثے رکھنے والے فنڈز100 کروڑ. پر ترتیب دیا گیاآخری 3 سال کی واپسی۔.
The Investment objective of the Scheme is to provide investors with the opportunities for long-term capital appreciation by investing predominantly in Equity and Equity related Instruments of Large Cap companies. However
there can be no assurance that the investment objective under the Scheme will be realized. Below is the key information for IDBI India Top 100 Equity Fund Returns up to 1 year are on The investment objective of the Scheme is to provide long-term growth by investing predominantly in a concentrated portfolio of equity / equity related instruments of companies. Research Highlights for JM Core 11 Fund Below is the key information for JM Core 11 Fund Returns up to 1 year are on (Erstwhile Invesco India Business Leaders Fund) To generate long term capital appreciation by investing in equity and equity related instruments including equity derivatives of companies which in our opinion are leaders in their respective industry or industry segment. However, there is no assurance or guarantee that the investment objective of the Scheme will be achieved. The Scheme does not assure or guarantee any returns. Research Highlights for Invesco India Largecap Fund Below is the key information for Invesco India Largecap Fund Returns up to 1 year are on (Erstwhile ICICI Prudential Focused Bluechip Equity Fund) To generate long-term capital appreciation and income distribution to unit holders from a portfolio that is invested in equity and equity related securities of about 20 companies belonging to the large cap domain and the balance in debt securities and money market instruments. The Fund Manager will always select stocks for investment from among Top 200 stocks in terms of market capitalization on the National Stock Exchange of India Ltd. If the total assets under management under this scheme goes above Rs. 1,000 crores the Fund
Manager reserves the right to increase the number of companies to more than 20. Research Highlights for ICICI Prudential Bluechip Fund Below is the key information for ICICI Prudential Bluechip Fund Returns up to 1 year are on (Erstwhile IDFC Equity Fund) The investment objective of the scheme is to seek to generate
capital growth from a portfolio of predominantly equity and equity
related instruments (including Equity Derivatives). The scheme
may also invest in debt & money market instruments to generate
reasonable income. However there is no assurance or guarantee that the objectives of the scheme will be realized. Research Highlights for Bandhan Large Cap Fund Below is the key information for Bandhan Large Cap Fund Returns up to 1 year are on 1. IDBI India Top 100 Equity Fund
IDBI India Top 100 Equity Fund
Growth Launch Date 15 May 12 NAV (28 Jul 23) ₹44.16 ↑ 0.05 (0.11 %) Net Assets (Cr) ₹655 on 30 Jun 23 Category Equity - Large Cap AMC IDBI Asset Management Limited Rating ☆☆☆ Risk Moderately High Expense Ratio 2.47 Sharpe Ratio 1.09 Information Ratio 0.14 Alpha Ratio 2.11 Min Investment 5,000 Min SIP Investment 500 Exit Load 0-1 Years (1%),1 Years and above(NIL) Growth of 10,000 investment over the years.
Date Value 30 Jun 21 ₹10,000 30 Jun 22 ₹10,040 30 Jun 23 ₹12,362 Returns for IDBI India Top 100 Equity Fund
absolute basis & more than 1 year are on CAGR (Compound Annual Growth Rate) basis. as on 28 Jul 23 Duration Returns 1 Month 3% 3 Month 9.2% 6 Month 12.5% 1 Year 15.4% 3 Year 21.9% 5 Year 12.6% 10 Year 15 Year Since launch 14.2% Historical performance (Yearly) on absolute basis
Year Returns 2025 2024 2023 2022 2021 2020 2019 2018 2017 2016 Fund Manager information for IDBI India Top 100 Equity Fund
Name Since Tenure Data below for IDBI India Top 100 Equity Fund as on 30 Jun 23
Equity Sector Allocation
Sector Value Asset Allocation
Asset Class Value Top Securities Holdings / Portfolio
Name Holding Value Quantity 2. JM Core 11 Fund
JM Core 11 Fund
Growth Launch Date 5 Mar 08 NAV (24 Jul 26) ₹19.6755 ↓ -0.01 (-0.04 %) Net Assets (Cr) ₹286 on 30 Jun 26 Category Equity - Large Cap AMC JM Financial Asset Management Limited Rating ☆☆☆☆ Risk High Expense Ratio 2.38 Sharpe Ratio -0.23 Information Ratio 0.15 Alpha Ratio 2.17 Min Investment 5,000 Min SIP Investment 500 Exit Load 0-60 Days (1%),60 Days and above(NIL) Growth of 10,000 investment over the years.
Date Value 30 Jun 21 ₹10,000 30 Jun 22 ₹9,962 30 Jun 23 ₹12,943 30 Jun 24 ₹19,005 30 Jun 25 ₹19,091 30 Jun 26 ₹18,895 Returns for JM Core 11 Fund
absolute basis & more than 1 year are on CAGR (Compound Annual Growth Rate) basis. as on 28 Jul 23 Duration Returns 1 Month 0.2% 3 Month 3.7% 6 Month 4.1% 1 Year -0.3% 3 Year 12.7% 5 Year 13.1% 10 Year 15 Year Since launch 3.7% Historical performance (Yearly) on absolute basis
Year Returns 2025 -1.9% 2024 24.3% 2023 32.9% 2022 7.1% 2021 16.3% 2020 6.3% 2019 10.6% 2018 -5% 2017 43.1% 2016 11.1% Fund Manager information for JM Core 11 Fund
Name Since Tenure Satish Ramanathan 1 Oct 24 1.75 Yr. Asit Bhandarkar 25 Feb 09 17.36 Yr. Ruchi Fozdar 4 Oct 24 1.74 Yr. Deepak Gupta 11 Apr 25 1.22 Yr. Data below for JM Core 11 Fund as on 30 Jun 26
Equity Sector Allocation
Sector Value Financial Services 23.84% Consumer Cyclical 23.45% Industrials 17.21% Technology 14.07% Health Care 7.8% Basic Materials 6.35% Utility 3.2% Communication Services 2.95% Asset Allocation
Asset Class Value Cash 1.13% Equity 98.87% Top Securities Holdings / Portfolio
Name Holding Value Quantity Ujjivan Small Finance Bank Ltd Ordinary Shares (Financial Services)
Equity, Since 31 May 25 | 5429045% ₹15 Cr 2,671,722
↓ -130,000 Larsen & Toubro Ltd (Industrials)
Equity, Since 31 Oct 11 | LT5% ₹14 Cr 34,507
↓ -2,000 Amber Enterprises India Ltd Ordinary Shares (Consumer Cyclical)
Equity, Since 31 Mar 23 | AMBER5% ₹14 Cr 18,050 OneSource Specialty Pharma Ltd (Healthcare)
Equity, Since 31 Jan 25 | ONESOURCE4% ₹12 Cr 65,637 Bajaj Finance Ltd (Financial Services)
Equity, Since 31 Jan 25 | BAJFINANCE4% ₹12 Cr 131,500
↓ -8,000 One97 Communications Ltd (Technology)
Equity, Since 31 May 25 | PAYTM4% ₹12 Cr 105,000 Premier Energies Ltd (Technology)
Equity, Since 31 Mar 26 | PREMIERENE4% ₹12 Cr 110,000
↑ 10,000 Adani Ports & Special Economic Zone Ltd (Industrials)
Equity, Since 31 May 25 | ADANIPORTS4% ₹12 Cr 64,000 Eternal Ltd (Consumer Cyclical)
Equity, Since 30 Nov 23 | ETERNAL4% ₹12 Cr 460,000 IDFC First Bank Ltd (Financial Services)
Equity, Since 30 Apr 25 | IDFCFIRSTB4% ₹11 Cr 1,600,000 3. Invesco India Largecap Fund
Invesco India Largecap Fund
Growth Launch Date 21 Aug 09 NAV (24 Jul 26) ₹70.19 ↓ -0.44 (-0.62 %) Net Assets (Cr) ₹1,847 on 30 Jun 26 Category Equity - Large Cap AMC Invesco Asset Management (India) Private Ltd Rating ☆☆☆ Risk Moderately High Expense Ratio 2.1 Sharpe Ratio -0.25 Information Ratio 0.82 Alpha Ratio 3.75 Min Investment 5,000 Min SIP Investment 100 Exit Load 0-1 Years (1%),1 Years and above(NIL) Growth of 10,000 investment over the years.
Date Value 30 Jun 21 ₹10,000 30 Jun 22 ₹10,005 30 Jun 23 ₹12,373 30 Jun 24 ₹16,924 30 Jun 25 ₹18,181 30 Jun 26 ₹18,122 Returns for Invesco India Largecap Fund
absolute basis & more than 1 year are on CAGR (Compound Annual Growth Rate) basis. as on 28 Jul 23 Duration Returns 1 Month -0.7% 3 Month 3.9% 6 Month 3.2% 1 Year 0.6% 3 Year 12.6% 5 Year 11.5% 10 Year 15 Year Since launch 12.2% Historical performance (Yearly) on absolute basis
Year Returns 2025 5.5% 2024 20% 2023 27.8% 2022 -3% 2021 32.5% 2020 14.1% 2019 10.5% 2018 -0.4% 2017 28.3% 2016 2.8% Fund Manager information for Invesco India Largecap Fund
Name Since Tenure Hiten Jain 1 Dec 23 2.58 Yr. Data below for Invesco India Largecap Fund as on 30 Jun 26
Equity Sector Allocation
Sector Value Financial Services 32.99% Industrials 20.35% Consumer Cyclical 14.78% Technology 10.22% Health Care 8.14% Basic Materials 6.02% Communication Services 3.35% Real Estate 2.12% Consumer Defensive 1.19% Utility 0.59% Asset Allocation
Asset Class Value Cash 0.25% Equity 99.75% Top Securities Holdings / Portfolio
Name Holding Value Quantity ICICI Bank Ltd (Financial Services)
Equity, Since 30 Sep 19 | ICICIBANK7% ₹122 Cr 969,443 ICICI Prudential Asset Management Co Ltd (Financial Services)
Equity, Since 31 Dec 25 | ICICIAMC6% ₹105 Cr 296,370 HDFC Bank Ltd (Financial Services)
Equity, Since 30 Sep 09 | HDFCBANK6% ₹103 Cr 1,384,844 Infosys Ltd (Technology)
Equity, Since 30 Apr 18 | INFY4% ₹75 Cr 646,679 Larsen & Toubro Ltd (Industrials)
Equity, Since 31 Oct 25 | LT4% ₹71 Cr 173,437 Bajaj Finance Ltd (Financial Services)
Equity, Since 28 Feb 25 | BAJFINANCE3% ₹61 Cr 671,135 Bharti Airtel Ltd (Communication Services)
Equity, Since 31 Dec 19 | BHARTIARTL3% ₹59 Cr 320,404 Eternal Ltd (Consumer Cyclical)
Equity, Since 31 Aug 23 | ETERNAL3% ₹58 Cr 2,302,684 Tech Mahindra Ltd (Technology)
Equity, Since 31 May 23 | TECHM3% ₹55 Cr 370,579 Axis Bank Ltd (Financial Services)
Equity, Since 31 Jan 26 | AXISBANK3% ₹52 Cr 406,975 4. ICICI Prudential Bluechip Fund
ICICI Prudential Bluechip Fund
Growth Launch Date 23 May 08 NAV (24 Jul 26) ₹107.21 ↓ -0.26 (-0.24 %) Net Assets (Cr) ₹79,421 on 30 Jun 26 Category Equity - Large Cap AMC ICICI Prudential Asset Management Company Limited Rating ☆☆☆☆ Risk Moderately High Expense Ratio 1.46 Sharpe Ratio -0.55 Information Ratio 0.85 Alpha Ratio -1.21 Min Investment 5,000 Min SIP Investment 100 Exit Load 0-1 Years (1%),1 Years and above(NIL) Growth of 10,000 investment over the years.
Date Value 30 Jun 21 ₹10,000 30 Jun 22 ₹10,446 30 Jun 23 ₹12,920 30 Jun 24 ₹17,880 30 Jun 25 ₹19,286 30 Jun 26 ₹18,583 Returns for ICICI Prudential Bluechip Fund
absolute basis & more than 1 year are on CAGR (Compound Annual Growth Rate) basis. as on 28 Jul 23 Duration Returns 1 Month -0.9% 3 Month 0.5% 6 Month -2.9% 1 Year -2.6% 3 Year 11.7% 5 Year 12.8% 10 Year 15 Year Since launch 13.9% Historical performance (Yearly) on absolute basis
Year Returns 2025 11.3% 2024 16.9% 2023 27.4% 2022 6.9% 2021 29.2% 2020 13.5% 2019 9.8% 2018 -0.8% 2017 32.7% 2016 7.7% Fund Manager information for ICICI Prudential Bluechip Fund
Name Since Tenure Sankaran Naren 5 Feb 26 0.4 Yr. Vaibhav Dusad 18 Jan 21 5.45 Yr. Sharmila D'Silva 31 Jul 22 3.92 Yr. Data below for ICICI Prudential Bluechip Fund as on 30 Jun 26
Equity Sector Allocation
Sector Value Financial Services 28.98% Consumer Cyclical 13.83% Industrials 11.11% Energy 7.43% Basic Materials 6.68% Consumer Defensive 5.84% Health Care 5.11% Communication Services 4.85% Technology 4.81% Utility 4.4% Real Estate 1.32% Asset Allocation
Asset Class Value Cash 5.23% Equity 94.77% Top Securities Holdings / Portfolio
Name Holding Value Quantity ICICI Bank Ltd (Financial Services)
Equity, Since 30 Jun 08 | ICICIBANK9% ₹6,650 Cr 52,926,976 HDFC Bank Ltd (Financial Services)
Equity, Since 31 Dec 10 | HDFCBANK8% ₹6,458 Cr 86,741,473 Reliance Industries Ltd (Energy)
Equity, Since 30 Jun 08 | RELIANCE5% ₹4,125 Cr 31,220,500
↑ 1,500,000 Larsen & Toubro Ltd (Industrials)
Equity, Since 31 Jan 12 | LT5% ₹4,107 Cr 10,075,656
↓ -594,718 Axis Bank Ltd (Financial Services)
Equity, Since 31 Mar 14 | AXISBANK5% ₹3,562 Cr 27,689,059
↑ 100,000 Bharti Airtel Ltd (Communication Services)
Equity, Since 31 Aug 09 | BHARTIARTL4% ₹3,311 Cr 18,104,129
↑ 337,869 Infosys Ltd (Technology)
Equity, Since 30 Nov 10 | INFY4% ₹2,747 Cr 23,662,450
↓ -1,575,000 Maruti Suzuki India Ltd (Consumer Cyclical)
Equity, Since 30 Apr 16 | MARUTI4% ₹2,712 Cr 2,065,675
↓ -79,950 UltraTech Cement Ltd (Basic Materials)
Equity, Since 30 Sep 17 | ULTRACEMCO3% ₹2,050 Cr 1,785,267
↓ -50,000 Sun Pharmaceuticals Industries Ltd (Healthcare)
Equity, Since 31 Jul 15 | SUNPHARMA3% ₹2,024 Cr 11,249,940 5. Bandhan Large Cap Fund
Bandhan Large Cap Fund
Growth Launch Date 9 Jun 06 NAV (24 Jul 26) ₹76.654 ↓ -0.32 (-0.42 %) Net Assets (Cr) ₹2,061 on 30 Jun 26 Category Equity - Large Cap AMC IDFC Asset Management Company Limited Rating ☆☆ Risk Moderately High Expense Ratio 2.07 Sharpe Ratio -0.35 Information Ratio 0.63 Alpha Ratio 2.34 Min Investment 5,000 Min SIP Investment 100 Exit Load 0-365 Days (1%),365 Days and above(NIL) Growth of 10,000 investment over the years.
Date Value 30 Jun 21 ₹10,000 30 Jun 22 ₹9,921 30 Jun 23 ₹12,185 30 Jun 24 ₹16,500 30 Jun 25 ₹17,486 30 Jun 26 ₹17,236 Returns for Bandhan Large Cap Fund
absolute basis & more than 1 year are on CAGR (Compound Annual Growth Rate) basis. as on 28 Jul 23 Duration Returns 1 Month -0.3% 3 Month 2% 6 Month 0% 1 Year -0.9% 3 Year 11.6% 5 Year 11% 10 Year 15 Year Since launch 10.7% Historical performance (Yearly) on absolute basis
Year Returns 2025 8.2% 2024 18.7% 2023 26.8% 2022 -2.3% 2021 26.8% 2020 17.4% 2019 10.6% 2018 -4.2% 2017 34.2% 2016 5.3% Fund Manager information for Bandhan Large Cap Fund
Name Since Tenure Manish Gunwani 2 Dec 24 1.58 Yr. Prateek Poddar 2 Dec 24 1.58 Yr. Ritika Behera 7 Oct 23 2.73 Yr. Gaurav Satra 7 Jun 24 2.07 Yr. Data below for Bandhan Large Cap Fund as on 30 Jun 26
Equity Sector Allocation
Sector Value Financial Services 31.37% Consumer Cyclical 14.89% Technology 8.69% Basic Materials 7.9% Industrials 7.81% Health Care 7.05% Energy 6.25% Consumer Defensive 5.02% Utility 4.61% Communication Services 3.01% Real Estate 1.8% Asset Allocation
Asset Class Value Cash 0.43% Equity 99.57% Top Securities Holdings / Portfolio
Name Holding Value Quantity ICICI Bank Ltd (Financial Services)
Equity, Since 31 Oct 18 | ICICIBANK8% ₹168 Cr 1,338,506
↑ 83,326 HDFC Bank Ltd (Financial Services)
Equity, Since 28 Feb 07 | HDFCBANK7% ₹147 Cr 1,978,408
↑ 6,494 Reliance Industries Ltd (Energy)
Equity, Since 28 Feb 07 | RELIANCE6% ₹118 Cr 890,095
↓ -8,990 Infosys Ltd (Technology)
Equity, Since 31 Aug 11 | INFY4% ₹84 Cr 721,653
↓ -7,289 NTPC Ltd (Utilities)
Equity, Since 31 Dec 24 | NTPC4% ₹84 Cr 2,162,368
↑ 28,879 State Bank of India (Financial Services)
Equity, Since 31 Dec 24 | SBIN4% ₹74 Cr 768,824
↑ 29,946 Larsen & Toubro Ltd (Industrials)
Equity, Since 31 Jan 19 | LT3% ₹67 Cr 163,216
↓ -1,648 Bharti Airtel Ltd (Communication Services)
Equity, Since 30 Apr 24 | BHARTIARTL3% ₹60 Cr 329,763
↓ -3,330 Mahindra & Mahindra Ltd (Consumer Cyclical)
Equity, Since 30 Apr 24 | M&M3% ₹59 Cr 193,611
↑ 7,133 Sun Pharmaceuticals Industries Ltd (Healthcare)
Equity, Since 31 Aug 24 | SUNPHARMA3% ₹57 Cr 314,202
↓ -3,173
لمپ سم کیلکولیٹر
لمپ سم کیلکولیٹر ایک ایسا آلہ ہے جو افراد کو یہ سمجھنے میں مدد کرتا ہے کہ ان کی قیمت کتنی ہوگیمیوچل فنڈز میں یکمشت سرمایہ کاری سرمایہ کاری کی مدت کے اختتام پر۔ کیلکولیٹر میں جن ان پٹ ڈیٹا کو فیڈ کرنے کی ضرورت ہے اس میں یکمشت سرمایہ کاری کی مدت، یکمشت سرمایہ کاری کی رقم، ایکویٹی مارکیٹوں میں متوقع طویل مدتی ترقی کی شرح، متوقع طویل مدتی شامل ہیں۔مہنگائی شرح تو، آئیے اس تصور کو سمجھیں کہ کس طرح یکمشت کیلکولیٹر استعمال کیا جائے۔
یکمشت سرمایہ کاری: 35 روپے،000
سرمایہ کاری کی مدت: 20 سال
طویل مدتی ترقی کی شرح (تقریباً): 15%
طویل مدتی افراط زر کی شرح (تقریبا): 4%
یکمشت کیلکولیٹر کے مطابق متوقع واپسی: INR 2,82,181
سرمایہ کاری پر خالص منافع: INR 2,47,181
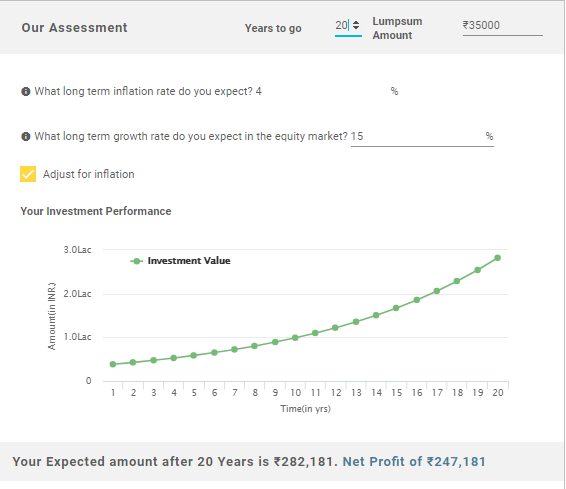
اس طرح، مندرجہ بالا حساب سے پتہ چلتا ہے کہ آپ کی سرمایہ کاری پر سرمایہ کاری پر خالص منافع INR 2,47,181 ہے جبکہ آپ کی سرمایہ کاری کی کل قیمت INR 2,82,181 ہے۔.
اس طرح، مندرجہ بالا نکات سے، یہ کہا جا سکتا ہے کہ سرمایہ کاری کے یکمشت موڈ کے بھی اپنے فوائد ہیں۔ تاہم، افراد کو سرمایہ کاری کے یکمشت موڈ کا انتخاب کرتے وقت محتاط رہنا چاہیے۔ انہیں یہ دیکھنا چاہیے کہ آیا ایسا موڈ ان کے لیے موزوں ہے یا نہیں۔ اگر افراد یکمشت موڈ کے ساتھ بہت زیادہ آرام دہ نہیں ہیں، تو وہ STP یا کے لیے انتخاب کر سکتے ہیں۔منظم منتقلی کا منصوبہ جس میں وہ پہلے یکمشت رقم کو a میں لگاتے ہیں۔مائع فنڈ اور پھر اسے باقاعدہ وقفوں پر ایکویٹی فنڈ میں منظم طریقے سے منتقل کریں۔
یہاں فراہم کردہ معلومات کے درست ہونے کو یقینی بنانے کے لیے تمام کوششیں کی گئی ہیں۔ تاہم، ڈیٹا کی درستگی کے حوالے سے کوئی ضمانت نہیں دی جاتی ہے۔ براہ کرم کوئی بھی سرمایہ کاری کرنے سے پہلے اسکیم کی معلومات کے دستاویز کے ساتھ تصدیق کریں۔


AMFI Registration No. 112358 | CIN: U74999MH2016PTC282153
Shepard Technologies Pvt. Ltd. (with ARN code 112358) makes no warranties or representations, express or implied, on products offered through the platform. It accepts no liability for any damages or losses, however caused, in connection with the use of, or on the reliance of its product or related services. Terms and conditions of the website are applicable.
©2026 Shepard Technologies Private Limited. All Rights Reserved
Research Highlights for IDBI India Top 100 Equity Fund