
 +91-22-48913909
بہترین مڈ کیپ میوچل فنڈز 2022
بہترین مڈ کیپ کی تلاش ہے۔باہمی چندہ 2022 میں سرمایہ کاری کرنا ہے؟ ٹھیک ہے، بہت سے سرمایہ کار اس طرف مائل ہیں۔سرمایہ کاری مڈ کیپس میں کیونکہ انہیں مستقبل سمجھا جاتا ہے۔مارکیٹ رہنما جب ایکسرمایہ کار ایک طویل مدت کے لیے مڈ کیپس میں سرمایہ کاری کرتے ہیں، وہ ان کمپنیوں کو ترجیح دیتے ہیں جو ان کے خیال میں کل کی رن وے کی کامیابیاں ہوں گی۔
روایتی طور پر، مڈ-کیپس عام طور پر درمیانے درجے کی کمپنیاں ہوتی ہیں، جو اگر اچھی طرح سے چلتی ہیں اور ان کے پاس اچھی کاروباری حکمت عملی ہے تو وہ کل کے لیڈر یا بڑے کیپ بن جاتی ہیں (کچھ ممالک یہاں تک کہکال کریں۔ ان کی وشال ٹوپیاں)۔
صحیح کاروباری حکمت عملی کے ساتھ، عمل درآمد کے لیے اچھا انتظام، اور تبدیلیوں کے لیے فرتیلا ہونا مڈ کیپ کمپنیوں کو تیزی سے ترقی کرتا ہے۔ لاج کیپس سے زیادہ منافع حاصل کرنے کے خواہاں سرمایہ کار سرمایہ کاری کے لیے مڈ کیپس کی طرف دیکھتے ہیں، تاہم، یہ زیادہ خطرہ (یا اتار چڑھاؤ) کے ساتھ آتا ہے۔
ادارہ جاتی سرمایہ کار جیسے میوچل فنڈز اور غیر ملکی ادارہ جاتی سرمایہ کار (FIIs) ٹاپ مڈ کیپس میں تیزی سے سرمایہ کاری کر رہے ہیں۔مڈ کیپ فنڈز ایکویٹی مارکیٹوں میں ان کے فوائد کو بڑھانے کے لئے.
آپ کو مڈ کیپ فنڈز میں کیوں سرمایہ کاری کرنی چاہئے۔
میں سے کچھسرمایہ کاری کے فوائد مڈ کیپ فنڈز میں ہیں:
- طویل مدتی ہولڈنگ کی وجہ سے بڑی ٹوپیوں کے مقابلے میں ان کے پاس دولت کی مضبوط صلاحیت ہے۔ وہ عام طور پر تیزی والے بازاروں میں مؤخر الذکر کے مقابلے میں بہتر کارکردگی کا مظاہرہ کرتے ہیں اور جب مارکیٹیں طویل عرصے سے عروج پر ہوتی ہیں۔
- مڈ کیپ کمپنیوں میں بڑے کیپ کے مقابلے ترقی کی زیادہ صلاحیت ہوتی ہے۔
- ایسی فرمیں مارکیٹ میں نئی اختراعات اور تبدیلیوں پر تیزی سے ردعمل ظاہر کرتی ہیں کیونکہ وہ زیادہ توجہ مرکوز کرنے، اپنی جگہ میں مہارت رکھنے والے اور تیز قدموں والی ہوتی ہیں۔
- مڈ کیپ اسٹاک کے مقابلے اتار چڑھاؤ میں کم ہیں۔چھوٹی ٹوپی اسٹاک
- تیزی سے بڑھنے کی اپنی صلاحیت کی وجہ سے، وہ اکثر بہتر کارکردگی کا مظاہرہ کرتے ہیں۔بڑے کیپ فنڈز ایک طویل مدت کے دوران.
Talk to our investment specialist
مڈ کیپ فنڈز کے فوائد
اگر ہم طویل مدتی پر غور کریں۔میوچل فنڈز کی تاریخ، پھر مڈ کیپ فنڈز نے مسلسل لاج کیپ فنڈز کو پیچھے چھوڑ دیا ہے۔ درحقیقت، فنڈ کی نوعیت یہ ہے کہ اس کے رجحان میں جلد تبدیلی کا امکان نہیں ہے۔
بڑے کیپ فنڈز کے مقابلے مڈ کیپ فنڈز اسٹاک مارکیٹوں میں نسبتاً کم فالو ہوتے ہیں۔ یہ سرمایہ کاروں کو ان فنڈز کا استعمال کرتے ہوئے اپنی سرمایہ کاری میں تیزی سے ترقی حاصل کرنے کا ایک بہت بڑا موقع فراہم کرتا ہے۔
مالی سال 22 - 23 میں سرمایہ کاری کے لیے سرفہرست 11 بہترین مڈ کیپ میوچل فنڈز
Fund NAV Net Assets (Cr) 3 MO (%) 6 MO (%) 1 YR (%) 3 YR (%) 5 YR (%) 2025 (%) Motilal Oswal Midcap 30 Fund Growth ₹96.9986
↓ -1.47 ₹40,208 -2.2 4 -7.4 15.6 17.6 -12.1 Invesco India Mid Cap Fund Growth ₹181.38
↓ -3.60 ₹15,749 -9.1 0.4 -2.7 19.1 15.3 6.3 Edelweiss Mid Cap Fund Growth ₹100.789
↓ -1.49 ₹19,230 -7.4 -2.9 -2.2 17 14.3 3.8 Sundaram Mid Cap Fund Growth ₹1,370.83
↓ -15.77 ₹13,854 -8.8 -4.2 -3.8 14.7 13.9 4.1 ICICI Prudential MidCap Fund Growth ₹309.98
↓ -7.29 ₹7,961 -8.9 -6.1 1.4 17.3 13.4 11.1 BNP Paribas Mid Cap Fund Growth ₹102.644
↓ -1.35 ₹2,503 -8.6 -4 0.1 12.8 11.5 2.5 TATA Mid Cap Growth Fund Growth ₹425.283
↓ -5.44 ₹5,860 -9.1 -4.7 -2.8 11.1 11.3 5.8 Aditya Birla Sun Life Midcap Fund Growth ₹784.28
↓ -14.71 ₹6,550 -7.4 -2.1 -1.6 11.7 10.6 4.4 Franklin India Prima Fund Growth ₹2,600.79
↓ -35.34 ₹12,156 -8.1 -3.7 -6.2 12.3 10.6 1.6 SBI Magnum Mid Cap Fund Growth ₹223.222
↓ -3.64 ₹23,282 -9.3 -4.9 -3.4 7.3 10.4 0.4 Axis Mid Cap Fund Growth ₹114.01
↓ -1.84 ₹33,528 -5.9 -1.1 -0.8 13.4 10.1 1 Note: Returns up to 1 year are on absolute basis & more than 1 year are on CAGR basis. as on 21 Oct 26 Research Highlights & Commentary of 11 Funds showcased
Commentary Motilal Oswal Midcap 30 Fund Invesco India Mid Cap Fund Edelweiss Mid Cap Fund Sundaram Mid Cap Fund ICICI Prudential MidCap Fund BNP Paribas Mid Cap Fund TATA Mid Cap Growth Fund Aditya Birla Sun Life Midcap Fund Franklin India Prima Fund SBI Magnum Mid Cap Fund Axis Mid Cap Fund Point 1 Highest AUM (₹40,208 Cr). Upper mid AUM (₹15,749 Cr). Upper mid AUM (₹19,230 Cr). Lower mid AUM (₹13,854 Cr). Lower mid AUM (₹7,961 Cr). Bottom quartile AUM (₹2,503 Cr). Bottom quartile AUM (₹5,860 Cr). Bottom quartile AUM (₹6,550 Cr). Lower mid AUM (₹12,156 Cr). Upper mid AUM (₹23,282 Cr). Top quartile AUM (₹33,528 Cr). Point 2 Established history (12+ yrs). Established history (19+ yrs). Established history (18+ yrs). Established history (24+ yrs). Established history (21+ yrs). Established history (20+ yrs). Oldest track record among peers (32 yrs). Established history (24+ yrs). Established history (32+ yrs). Established history (21+ yrs). Established history (15+ yrs). Point 3 Rating: 3★ (upper mid). Rating: 2★ (bottom quartile). Rating: 3★ (upper mid). Top rated. Rating: 2★ (bottom quartile). Rating: 3★ (top quartile). Rating: 2★ (lower mid). Rating: 3★ (lower mid). Rating: 3★ (lower mid). Rating: 3★ (upper mid). Rating: 1★ (bottom quartile). Point 4 Risk profile: Moderately High. Risk profile: Moderately High. Risk profile: High. Risk profile: Moderately High. Risk profile: Moderately High. Risk profile: High. Risk profile: Moderately High. Risk profile: Moderately High. Risk profile: Moderately High. Risk profile: Moderately High. Risk profile: Moderately High. Point 5 5Y return: 17.57% (top quartile). 5Y return: 15.34% (top quartile). 5Y return: 14.29% (upper mid). 5Y return: 13.85% (upper mid). 5Y return: 13.38% (upper mid). 5Y return: 11.49% (lower mid). 5Y return: 11.30% (lower mid). 5Y return: 10.65% (lower mid). 5Y return: 10.63% (bottom quartile). 5Y return: 10.38% (bottom quartile). 5Y return: 10.07% (bottom quartile). Point 6 3Y return: 15.61% (upper mid). 3Y return: 19.15% (top quartile). 3Y return: 17.00% (upper mid). 3Y return: 14.74% (upper mid). 3Y return: 17.31% (top quartile). 3Y return: 12.78% (lower mid). 3Y return: 11.14% (bottom quartile). 3Y return: 11.74% (bottom quartile). 3Y return: 12.30% (lower mid). 3Y return: 7.34% (bottom quartile). 3Y return: 13.45% (lower mid). Point 7 1Y return: -7.44% (bottom quartile). 1Y return: -2.72% (lower mid). 1Y return: -2.22% (upper mid). 1Y return: -3.80% (bottom quartile). 1Y return: 1.36% (top quartile). 1Y return: 0.09% (top quartile). 1Y return: -2.76% (lower mid). 1Y return: -1.56% (upper mid). 1Y return: -6.24% (bottom quartile). 1Y return: -3.40% (lower mid). 1Y return: -0.82% (upper mid). Point 8 Alpha: -3.81 (bottom quartile). Alpha: 0.00 (lower mid). Alpha: 0.22 (upper mid). Alpha: -1.10 (lower mid). Alpha: 7.02 (top quartile). Alpha: 1.29 (top quartile). Alpha: -1.28 (lower mid). Alpha: 1.18 (upper mid). Alpha: -4.52 (bottom quartile). Alpha: -1.73 (bottom quartile). Alpha: 0.00 (upper mid). Point 9 Sharpe: -0.12 (bottom quartile). Sharpe: 0.17 (top quartile). Sharpe: 0.06 (upper mid). Sharpe: 0.00 (lower mid). Sharpe: 0.38 (top quartile). Sharpe: 0.12 (upper mid). Sharpe: -0.02 (lower mid). Sharpe: 0.11 (upper mid). Sharpe: -0.18 (bottom quartile). Sharpe: -0.04 (bottom quartile). Sharpe: 0.05 (lower mid). Point 10 Information ratio: 0.24 (upper mid). Information ratio: 0.00 (lower mid). Information ratio: 0.96 (top quartile). Information ratio: 0.52 (upper mid). Information ratio: 1.25 (top quartile). Information ratio: -0.02 (lower mid). Information ratio: -0.43 (bottom quartile). Information ratio: -0.23 (bottom quartile). Information ratio: -0.11 (lower mid). Information ratio: -0.99 (bottom quartile). Information ratio: 0.00 (upper mid). Motilal Oswal Midcap 30 Fund
Invesco India Mid Cap Fund
Edelweiss Mid Cap Fund
Sundaram Mid Cap Fund
ICICI Prudential MidCap Fund
BNP Paribas Mid Cap Fund
TATA Mid Cap Growth Fund
Aditya Birla Sun Life Midcap Fund
Franklin India Prima Fund
SBI Magnum Mid Cap Fund
Axis Mid Cap Fund
*سب سے اوپر کی فہرستمڈ کیپ باہمی فنڈز کم سے کم200 کروڑ خالص اثاثے / انتظام کے تحت اثاثے (AUM)، ترتیب دیا گیا۔5 سالسی اے جی آر واپسی.
(Erstwhile Motilal Oswal MOSt Focused Midcap 30 Fund) The investment objective of the Scheme is to achieve long term capital appreciation by investing in a maximum of 30 quality mid-cap companies having long-term competitive advantages and potential for growth. However, there can be no assurance or guarantee that the investment objective of the Scheme would be achieved. Below is the key information for Motilal Oswal Midcap 30 Fund Returns up to 1 year are on The Scheme seeks to provide long term capital appreciation by investing in a portfolio that is predominantly constituted of equity and equity related instruments of mid cap companies. However, there can be no assurance that the funds objectives will be achieved. Research Highlights for Invesco India Mid Cap Fund Below is the key information for Invesco India Mid Cap Fund Returns up to 1 year are on (Erstwhile Edelweiss Mid and Small Cap Fund ) The investment objective is to seek to generate long-term capital appreciation from a portfolio that predominantly invests in equity and equity-related securities of Mid Cap companies.
However, there can be no assurance that the investment objective of the Scheme will be realised. Research Highlights for Edelweiss Mid Cap Fund Below is the key information for Edelweiss Mid Cap Fund Returns up to 1 year are on (Erstwhile Sundaram Select Midcap Fund) To achieve capital appreciation by investing
in diversified stocks that are generally termed
as mid-caps. Research Highlights for Sundaram Mid Cap Fund Below is the key information for Sundaram Mid Cap Fund Returns up to 1 year are on To generate capital appreciation by actively investing in diversified mid cap stocks. Research Highlights for ICICI Prudential MidCap Fund Below is the key information for ICICI Prudential MidCap Fund Returns up to 1 year are on The Investment objective of the scheme is to seek to generate long-term capital appreciation by investing primarily in companies with high growth opportunities in
the middle and small capitalization segment, defi ned as ‘Future Leaders’. The fund will emphasize on companies that appear to offer opportunities for long-term growth and will be inclined towards companies that are driven by dynamic style of management and entrepreneurial fl air. However, there can be no assurance that the investment objectives of the Scheme will be realized. The Scheme does not guarantee/indicate any returns. Research Highlights for BNP Paribas Mid Cap Fund Below is the key information for BNP Paribas Mid Cap Fund Returns up to 1 year are on To provide income distribution and / or medium to long term capital gains. Investments would be focused towards mid-cap stocks. Research Highlights for TATA Mid Cap Growth Fund Below is the key information for TATA Mid Cap Growth Fund Returns up to 1 year are on An Open ended Growth Scheme with the objective to achieve long term growth of capital at controlled level of risk by investing primarily in ‘Mid-Cap’ Stocks. The level of risk is somewhat higher than a fund focused on large and liquid stocks. Concomitantly, the aim is to generate higher returns than a fund focused on large and liquid stocks. Research Highlights for Aditya Birla Sun Life Midcap Fund Below is the key information for Aditya Birla Sun Life Midcap Fund Returns up to 1 year are on The investment objective of Prima Fund is to provide medium to longterm capital appreciation as a primary objective and income as a secondary objective. Research Highlights for Franklin India Prima Fund Below is the key information for Franklin India Prima Fund Returns up to 1 year are on To provide investors with opportunities for long-term growth in capital along with the liquidity of an open-ended scheme by investing predominantly in a well diversified basket of equity stocks of Midcap companies. Research Highlights for SBI Magnum Mid Cap Fund Below is the key information for SBI Magnum Mid Cap Fund Returns up to 1 year are on To achieve long term capital appreciation by investing predominantly in equity & equity related instruments of mid size companies. The focus of the fund would be to invest in relatively larger companies within this category. Research Highlights for Axis Mid Cap Fund Below is the key information for Axis Mid Cap Fund Returns up to 1 year are on 1. Motilal Oswal Midcap 30 Fund
Motilal Oswal Midcap 30 Fund
Growth Launch Date 24 Feb 14 NAV (21 Oct 26) ₹96.9986 ↓ -1.47 (-1.50 %) Net Assets (Cr) ₹40,208 on 30 Sep 26 Category Equity - Mid Cap AMC Motilal Oswal Asset Management Co. Ltd Rating ☆☆☆ Risk Moderately High Expense Ratio 1.56 Sharpe Ratio -0.12 Information Ratio 0.24 Alpha Ratio -3.81 Min Investment 5,000 Min SIP Investment 500 Exit Load 0-1 Years (1%),1 Years and above(NIL) Growth of 10,000 investment over the years.
Date Value 30 Sep 21 ₹10,000 30 Sep 22 ₹12,302 30 Sep 23 ₹14,891 30 Sep 24 ₹25,582 30 Sep 25 ₹23,487 30 Sep 26 ₹23,526 Returns for Motilal Oswal Midcap 30 Fund
absolute basis & more than 1 year are on CAGR (Compound Annual Growth Rate) basis. as on 21 Oct 26 Duration Returns 1 Month -6.3% 3 Month -2.2% 6 Month 4% 1 Year -7.4% 3 Year 15.6% 5 Year 17.6% 10 Year 15 Year Since launch 19.7% Historical performance (Yearly) on absolute basis
Year Returns 2025 -12.1% 2024 57.1% 2023 41.7% 2022 10.7% 2021 55.8% 2020 9.3% 2019 9.7% 2018 -12.7% 2017 30.8% 2016 5.2% Fund Manager information for Motilal Oswal Midcap 30 Fund
Name Since Tenure Varun Sharma 21 Jan 26 0.61 Yr. Swapnil Mayekar 18 Nov 25 0.79 Yr. Ajay Khandelwal 1 Oct 24 1.92 Yr. Ankit Agarwal 21 Jan 26 0.61 Yr. Rakesh Shetty 22 Nov 22 3.78 Yr. Data below for Motilal Oswal Midcap 30 Fund as on 30 Sep 26
Equity Sector Allocation
Sector Value Technology 29.51% Financial Services 26.92% Consumer Cyclical 16.81% Industrials 13.61% Health Care 3.55% Real Estate 2.37% Communication Services 2.27% Energy 0.81% Consumer Defensive 0.52% Asset Allocation
Asset Class Value Cash 3.64% Equity 96.36% Top Securities Holdings / Portfolio
Name Holding Value Quantity One97 Communications Ltd (Technology)
Equity, Since 30 Sep 24 | PAYTM9% ₹3,886 Cr 22,630,476
↓ -1,470,000 Kalyan Jewellers India Ltd (Consumer Cyclical)
Equity, Since 29 Feb 24 | KALYANKJIL8% ₹3,486 Cr 58,000,000 Eternal Ltd (Consumer Cyclical)
Equity, Since 31 Aug 25 | ETERNAL6% ₹2,769 Cr 84,386,866 Coforge Ltd (Technology)
Equity, Since 31 Mar 23 | COFORGE6% ₹2,479 Cr 12,488,926
↓ -500,000 KEI Industries Ltd (Industrials)
Equity, Since 30 Nov 24 | KEI5% ₹2,210 Cr 3,850,000 Aditya Birla Capital Ltd (Financial Services)
Equity, Since 30 Jun 25 | ABCAPITAL5% ₹2,088 Cr 51,000,000
↓ -500,000 Persistent Systems Ltd (Technology)
Equity, Since 31 Jan 23 | PERSISTENT4% ₹1,888 Cr 3,375,000
↓ -50,000 Shriram Finance Ltd (Financial Services)
Equity, Since 31 Jan 26 | SHRIRAMFIN4% ₹1,568 Cr 14,128,296
↓ -200,000 Dixon Technologies (India) Ltd (Technology)
Equity, Since 31 Mar 23 | DIXON3% ₹1,474 Cr 992,735 Billionbrains Garage Ventures Ltd (Financial Services)
Equity, Since 31 Jan 26 | GROWW3% ₹1,471 Cr 76,595,094
↓ -7,500,000 2. Invesco India Mid Cap Fund
Invesco India Mid Cap Fund
Growth Launch Date 19 Apr 07 NAV (21 Oct 26) ₹181.38 ↓ -3.60 (-1.95 %) Net Assets (Cr) ₹15,749 on 30 Sep 26 Category Equity - Mid Cap AMC Invesco Asset Management (India) Private Ltd Rating ☆☆ Risk Moderately High Expense Ratio 1.69 Sharpe Ratio 0.17 Information Ratio 0 Alpha Ratio 0 Min Investment 5,000 Min SIP Investment 500 Exit Load 0-1 Years (1%),1 Years and above(NIL) Growth of 10,000 investment over the years.
Date Value 30 Sep 21 ₹10,000 30 Sep 22 ₹10,141 30 Sep 23 ₹12,538 30 Sep 24 ₹20,051 30 Sep 25 ₹20,605 30 Sep 26 ₹22,077 Returns for Invesco India Mid Cap Fund
absolute basis & more than 1 year are on CAGR (Compound Annual Growth Rate) basis. as on 21 Oct 26 Duration Returns 1 Month -8.5% 3 Month -9.1% 6 Month 0.4% 1 Year -2.7% 3 Year 19.1% 5 Year 15.3% 10 Year 15 Year Since launch 16% Historical performance (Yearly) on absolute basis
Year Returns 2025 6.3% 2024 43.1% 2023 34.1% 2022 0.5% 2021 43.1% 2020 24.4% 2019 3.8% 2018 -5.3% 2017 44.3% 2016 1.1% Fund Manager information for Invesco India Mid Cap Fund
Name Since Tenure Aditya Khemani 9 Nov 23 2.81 Yr. Data below for Invesco India Mid Cap Fund as on 30 Sep 26
Equity Sector Allocation
Sector Value Financial Services 25.51% Health Care 24.09% Consumer Cyclical 18.62% Industrials 14.34% Real Estate 9.23% Basic Materials 3.03% Utility 1.77% Technology 1.52% Asset Allocation
Asset Class Value Cash 1.89% Equity 98.11% Top Securities Holdings / Portfolio
Name Holding Value Quantity Prestige Estates Projects Ltd (Real Estate)
Equity, Since 30 Nov 23 | PRESTIGE7% ₹1,156 Cr 7,081,528
↑ 561,554 Max Healthcare Institute Ltd Ordinary Shares (Healthcare)
Equity, Since 31 Dec 22 | MAXHEALTH7% ₹1,034 Cr 9,926,227
↑ 1,599,609 The Federal Bank Ltd (Financial Services)
Equity, Since 31 Oct 22 | FEDERALBNK6% ₹951 Cr 26,659,590
↑ 335,790 Meesho Ltd (Consumer Cyclical)
Equity, Since 30 Jun 26 | MEESHO5% ₹770 Cr 37,475,229 Manipal Health Enterprises Ltd (Healthcare)
Equity, Since 31 Jul 26 | MANIPALHOS5% ₹754 Cr 9,878,758
↑ 8,611,733 Global Health Ltd (Healthcare)
Equity, Since 30 Nov 23 | MEDANTA4% ₹677 Cr 4,577,395 Eternal Ltd (Consumer Cyclical)
Equity, Since 31 Aug 25 | ETERNAL4% ₹668 Cr 20,352,364 AU Small Finance Bank Ltd (Financial Services)
Equity, Since 31 Jul 25 | 5406114% ₹645 Cr 5,936,790 L&T Finance Ltd (Financial Services)
Equity, Since 31 Dec 23 | LTF4% ₹631 Cr 19,652,291
↑ 1,633,291 IndusInd Bank Ltd (Financial Services)
Equity, Since 31 Jan 26 | INDUSINDBK4% ₹623 Cr 6,129,063
↑ 222,122 3. Edelweiss Mid Cap Fund
Edelweiss Mid Cap Fund
Growth Launch Date 26 Dec 07 NAV (21 Oct 26) ₹100.789 ↓ -1.49 (-1.46 %) Net Assets (Cr) ₹19,230 on 30 Sep 26 Category Equity - Mid Cap AMC Edelweiss Asset Management Limited Rating ☆☆☆ Risk High Expense Ratio 1.68 Sharpe Ratio 0.06 Information Ratio 0.96 Alpha Ratio 0.22 Min Investment 5,000 Min SIP Investment 500 Exit Load 0-12 Months (1%),12 Months and above(NIL) Growth of 10,000 investment over the years.
Date Value 30 Sep 21 ₹10,000 30 Sep 22 ₹10,510 30 Sep 23 ₹12,753 30 Sep 24 ₹20,437 30 Sep 25 ₹19,854 30 Sep 26 ₹20,850 Returns for Edelweiss Mid Cap Fund
absolute basis & more than 1 year are on CAGR (Compound Annual Growth Rate) basis. as on 21 Oct 26 Duration Returns 1 Month -6.7% 3 Month -7.4% 6 Month -2.9% 1 Year -2.2% 3 Year 17% 5 Year 14.3% 10 Year 15 Year Since launch 13.1% Historical performance (Yearly) on absolute basis
Year Returns 2025 3.8% 2024 38.9% 2023 38.4% 2022 2.4% 2021 50.3% 2020 26.4% 2019 5.2% 2018 -15.7% 2017 52.3% 2016 2.5% Fund Manager information for Edelweiss Mid Cap Fund
Name Since Tenure Dhruv Bhatia 14 Oct 24 1.88 Yr. Trideep Bhattacharya 1 Oct 21 4.92 Yr. Mehul Dalmia 3 Aug 26 0.08 Yr. Data below for Edelweiss Mid Cap Fund as on 30 Sep 26
Equity Sector Allocation
Sector Value Financial Services 27.43% Consumer Cyclical 14.68% Industrials 12.88% Health Care 9.41% Basic Materials 9.32% Technology 7.72% Consumer Defensive 4.18% Real Estate 3.9% Communication Services 2.54% Utility 1.8% Energy 1.44% Asset Allocation
Asset Class Value Cash 4.69% Equity 95.31% Top Securities Holdings / Portfolio
Name Holding Value Quantity The Federal Bank Ltd (Financial Services)
Equity, Since 31 Dec 18 | FEDERALBNK4% ₹743 Cr 20,823,817 Multi Commodity Exchange of India Ltd (Financial Services)
Equity, Since 30 Apr 24 | MCX3% ₹534 Cr 1,571,687 Coforge Ltd (Technology)
Equity, Since 30 Jun 23 | COFORGE2% ₹433 Cr 2,179,829 Solar Industries India Ltd (Basic Materials)
Equity, Since 30 Sep 12 | SOLARINDS2% ₹410 Cr 203,930 Persistent Systems Ltd (Technology)
Equity, Since 31 Mar 21 | PERSISTENT2% ₹406 Cr 724,918 City Union Bank Ltd (Financial Services)
Equity, Since 30 Apr 25 | CUB2% ₹393 Cr 17,152,756
↑ 2,030,511 BSE Ltd (Financial Services)
Equity, Since 31 Mar 24 | BSE2% ₹393 Cr 1,196,328 Marico Ltd (Consumer Defensive)
Equity, Since 31 Oct 24 | 5316422% ₹386 Cr 4,701,724 Fortis Healthcare Ltd (Healthcare)
Equity, Since 30 Sep 23 | 5328432% ₹379 Cr 4,181,418 Ipca Laboratories Ltd (Healthcare)
Equity, Since 30 Jun 24 | 5244942% ₹362 Cr 1,833,465 4. Sundaram Mid Cap Fund
Sundaram Mid Cap Fund
Growth Launch Date 30 Jul 02 NAV (21 Oct 26) ₹1,370.83 ↓ -15.77 (-1.14 %) Net Assets (Cr) ₹13,854 on 30 Sep 26 Category Equity - Mid Cap AMC Sundaram Asset Management Company Ltd Rating ☆☆☆☆ Risk Moderately High Expense Ratio 1.74 Sharpe Ratio -0.01 Information Ratio 0.52 Alpha Ratio -1.1 Min Investment 5,000 Min SIP Investment 100 Exit Load 0-12 Months (1%),12 Months and above(NIL) Growth of 10,000 investment over the years.
Date Value 30 Sep 21 ₹10,000 30 Sep 22 ₹10,517 30 Sep 23 ₹12,999 30 Sep 24 ₹20,296 30 Sep 25 ₹19,378 30 Sep 26 ₹20,063 Returns for Sundaram Mid Cap Fund
absolute basis & more than 1 year are on CAGR (Compound Annual Growth Rate) basis. as on 21 Oct 26 Duration Returns 1 Month -7.3% 3 Month -8.8% 6 Month -4.2% 1 Year -3.8% 3 Year 14.7% 5 Year 13.9% 10 Year 15 Year Since launch 22.5% Historical performance (Yearly) on absolute basis
Year Returns 2025 4.1% 2024 32% 2023 40.4% 2022 4.8% 2021 37.5% 2020 11.8% 2019 -0.3% 2018 -15.4% 2017 40.8% 2016 11.3% Fund Manager information for Sundaram Mid Cap Fund
Name Since Tenure S. Bharath 24 Feb 21 5.52 Yr. Shalav Saket 31 Dec 25 0.67 Yr. Data below for Sundaram Mid Cap Fund as on 30 Sep 26
Equity Sector Allocation
Sector Value Financial Services 23.8% Industrials 18.32% Consumer Cyclical 16.81% Health Care 9.76% Technology 9.14% Basic Materials 8.37% Consumer Defensive 3.26% Real Estate 2.8% Utility 1.93% Communication Services 1.35% Energy 1.16% Asset Allocation
Asset Class Value Cash 3.19% Equity 96.7% Debt 0.1% Other 0% Top Securities Holdings / Portfolio
Name Holding Value Quantity Mahindra & Mahindra Financial Services Ltd (Financial Services)
Equity, Since 31 Jan 24 | M&MFIN3% ₹436 Cr 11,700,000 Kalyan Jewellers India Ltd (Consumer Cyclical)
Equity, Since 31 Mar 21 | KALYANKJIL3% ₹388 Cr 6,450,835 Cummins India Ltd (Industrials)
Equity, Since 31 Dec 17 | 5004802% ₹369 Cr 722,000 The Federal Bank Ltd (Financial Services)
Equity, Since 31 Dec 18 | FEDERALBNK2% ₹367 Cr 10,300,000
↓ -662,188 Coforge Ltd (Technology)
Equity, Since 31 May 23 | COFORGE2% ₹334 Cr 1,680,000
↓ -25,000 Coromandel International Ltd (Basic Materials)
Equity, Since 30 Nov 10 | 5063952% ₹331 Cr 1,735,153 IDFC First Bank Ltd (Financial Services)
Equity, Since 30 Jun 25 | IDFCFIRSTB2% ₹329 Cr 38,278,844 GE Vernova T&D India Ltd (Industrials)
Equity, Since 30 Sep 24 | 5222752% ₹311 Cr 700,000 Max Financial Services Ltd (Financial Services)
Equity, Since 30 Jun 16 | 5002712% ₹284 Cr 1,805,000 IndusInd Bank Ltd (Financial Services)
Equity, Since 30 Nov 25 | INDUSINDBK2% ₹280 Cr 2,755,000
↑ 155,000 5. ICICI Prudential MidCap Fund
ICICI Prudential MidCap Fund
Growth Launch Date 28 Oct 04 NAV (21 Oct 26) ₹309.98 ↓ -7.29 (-2.30 %) Net Assets (Cr) ₹7,961 on 30 Sep 26 Category Equity - Mid Cap AMC ICICI Prudential Asset Management Company Limited Rating ☆☆ Risk Moderately High Expense Ratio 1.87 Sharpe Ratio 0.38 Information Ratio 1.25 Alpha Ratio 7.02 Min Investment 5,000 Min SIP Investment 100 Exit Load 0-1 Years (1%),1 Years and above(NIL) Growth of 10,000 investment over the years.
Date Value 30 Sep 21 ₹10,000 30 Sep 22 ₹10,266 30 Sep 23 ₹12,049 30 Sep 24 ₹18,771 30 Sep 25 ₹18,155 30 Sep 26 ₹20,337 Returns for ICICI Prudential MidCap Fund
absolute basis & more than 1 year are on CAGR (Compound Annual Growth Rate) basis. as on 21 Oct 26 Duration Returns 1 Month -9% 3 Month -8.9% 6 Month -6.1% 1 Year 1.4% 3 Year 17.3% 5 Year 13.4% 10 Year 15 Year Since launch 16.9% Historical performance (Yearly) on absolute basis
Year Returns 2025 11.1% 2024 27% 2023 32.8% 2022 3.1% 2021 44.8% 2020 19.1% 2019 -0.6% 2018 -10.8% 2017 42.9% 2016 4.8% Fund Manager information for ICICI Prudential MidCap Fund
Name Since Tenure Lalit Kumar 1 Jul 22 4.17 Yr. Sharmila D'Silva 31 Jul 22 4.09 Yr. Data below for ICICI Prudential MidCap Fund as on 30 Sep 26
Equity Sector Allocation
Sector Value Industrials 26.8% Basic Materials 24.5% Financial Services 20.99% Consumer Cyclical 10.6% Real Estate 5.54% Energy 4.5% Health Care 2.22% Technology 1.46% Communication Services 1.38% Utility 0.01% Asset Allocation
Asset Class Value Cash 1.99% Equity 98.01% Top Securities Holdings / Portfolio
Name Holding Value Quantity Apar Industries Ltd (Industrials)
Equity, Since 31 Jan 25 | APARINDS6% ₹485 Cr 273,711 Multi Commodity Exchange of India Ltd (Financial Services)
Equity, Since 30 Apr 24 | MCX5% ₹445 Cr 1,309,860
↑ 30,000 Hindustan Petroleum Corp Ltd (Energy)
Equity, Since 31 Mar 26 | HINDPETRO5% ₹378 Cr 10,339,597
↑ 600,000 Jindal Steel Ltd (Basic Materials)
Equity, Since 31 Jan 22 | 5322864% ₹332 Cr 2,786,470 BSE Ltd (Financial Services)
Equity, Since 30 Apr 24 | BSE4% ₹332 Cr 1,011,840 APL Apollo Tubes Ltd (Basic Materials)
Equity, Since 30 Sep 22 | APLAPOLLO4% ₹320 Cr 1,437,425 PB Fintech Ltd (Financial Services)
Equity, Since 31 May 24 | POLICYBZR3% ₹264 Cr 1,408,585 KEI Industries Ltd (Industrials)
Equity, Since 30 Apr 24 | KEI3% ₹251 Cr 437,075 Bharat Forge Ltd (Industrials)
Equity, Since 31 May 23 | 5004933% ₹247 Cr 1,174,895 Muthoot Finance Ltd (Financial Services)
Equity, Since 30 Nov 23 | 5333983% ₹246 Cr 824,501 6. BNP Paribas Mid Cap Fund
BNP Paribas Mid Cap Fund
Growth Launch Date 2 May 06 NAV (21 Oct 26) ₹102.644 ↓ -1.35 (-1.30 %) Net Assets (Cr) ₹2,503 on 30 Sep 26 Category Equity - Mid Cap AMC BNP Paribas Asset Mgmt India Pvt. Ltd Rating ☆☆☆ Risk High Expense Ratio 1.99 Sharpe Ratio 0.12 Information Ratio -0.02 Alpha Ratio 1.29 Min Investment 5,000 Min SIP Investment 300 Exit Load 0-12 Months (1%),12 Months and above(NIL) Growth of 10,000 investment over the years.
Date Value 30 Sep 21 ₹10,000 30 Sep 22 ₹10,141 30 Sep 23 ₹12,466 30 Sep 24 ₹18,351 30 Sep 25 ₹17,205 30 Sep 26 ₹18,290 Returns for BNP Paribas Mid Cap Fund
absolute basis & more than 1 year are on CAGR (Compound Annual Growth Rate) basis. as on 21 Oct 26 Duration Returns 1 Month -7.5% 3 Month -8.6% 6 Month -4% 1 Year 0.1% 3 Year 12.8% 5 Year 11.5% 10 Year 15 Year Since launch 12% Historical performance (Yearly) on absolute basis
Year Returns 2025 2.5% 2024 28.5% 2023 32.6% 2022 4.7% 2021 41.5% 2020 23.1% 2019 5.2% 2018 -17.5% 2017 49% 2016 -1.2% Fund Manager information for BNP Paribas Mid Cap Fund
Name Since Tenure Rohan Korde 1 May 26 0.34 Yr. Ankeet Pandya 1 Jul 26 0.17 Yr. Data below for BNP Paribas Mid Cap Fund as on 30 Sep 26
Equity Sector Allocation
Sector Value Financial Services 26.79% Industrials 17.51% Health Care 11.96% Consumer Cyclical 10.87% Technology 9.7% Basic Materials 8.09% Utility 3.52% Real Estate 2.71% Consumer Defensive 1.88% Energy 1.72% Communication Services 1.16% Asset Allocation
Asset Class Value Cash 3.35% Equity 95.9% Debt 0.74% Top Securities Holdings / Portfolio
Name Holding Value Quantity Bharat Heavy Electricals Ltd (Industrials)
Equity, Since 31 Jan 24 | 5001033% ₹89 Cr 2,000,000 GE Vernova T&D India Ltd (Industrials)
Equity, Since 30 Sep 24 | 5222753% ₹73 Cr 165,000 PB Fintech Ltd (Financial Services)
Equity, Since 28 Feb 23 | POLICYBZR2% ₹65 Cr 348,500 Indian Bank (Financial Services)
Equity, Since 30 Jun 21 | 5328142% ₹63 Cr 700,000 Ipca Laboratories Ltd (Healthcare)
Equity, Since 31 Jan 24 | 5244942% ₹59 Cr 300,000
↓ -11,250 The Federal Bank Ltd (Financial Services)
Equity, Since 31 Jul 16 | FEDERALBNK2% ₹54 Cr 1,500,000
↓ -500,000 Acutaas Chemicals Ltd (Basic Materials)
Equity, Since 31 Oct 25 | 5433492% ₹52 Cr 163,666 Multi Commodity Exchange of India Ltd (Financial Services)
Equity, Since 31 Jan 26 | MCX2% ₹49 Cr 145,000
↑ 7,000 One97 Communications Ltd (Technology)
Equity, Since 30 Sep 25 | PAYTM2% ₹49 Cr 287,000 AU Small Finance Bank Ltd (Financial Services)
Equity, Since 31 May 26 | 5406112% ₹49 Cr 450,000 7. TATA Mid Cap Growth Fund
TATA Mid Cap Growth Fund
Growth Launch Date 1 Jul 94 NAV (21 Oct 26) ₹425.283 ↓ -5.44 (-1.26 %) Net Assets (Cr) ₹5,860 on 30 Sep 26 Category Equity - Mid Cap AMC Tata Asset Management Limited Rating ☆☆ Risk Moderately High Expense Ratio 1.85 Sharpe Ratio -0.02 Information Ratio -0.43 Alpha Ratio -1.28 Min Investment 5,000 Min SIP Investment 150 Exit Load 0-365 Days (1%),365 Days and above(NIL) Growth of 10,000 investment over the years.
Date Value 30 Sep 21 ₹10,000 30 Sep 22 ₹10,181 30 Sep 23 ₹12,981 30 Sep 24 ₹19,032 30 Sep 25 ₹17,704 30 Sep 26 ₹18,324 Returns for TATA Mid Cap Growth Fund
absolute basis & more than 1 year are on CAGR (Compound Annual Growth Rate) basis. as on 21 Oct 26 Duration Returns 1 Month -7.6% 3 Month -9.1% 6 Month -4.7% 1 Year -2.8% 3 Year 11.1% 5 Year 11.3% 10 Year 15 Year Since launch 12.3% Historical performance (Yearly) on absolute basis
Year Returns 2025 5.8% 2024 22.7% 2023 40.5% 2022 0.6% 2021 40% 2020 24.3% 2019 6.5% 2018 -13% 2017 49.8% 2016 -2.2% Fund Manager information for TATA Mid Cap Growth Fund
Name Since Tenure Satish Mishra 9 Mar 21 5.48 Yr. Data below for TATA Mid Cap Growth Fund as on 30 Sep 26
Equity Sector Allocation
Sector Value Financial Services 26.67% Industrials 12.83% Health Care 12.65% Consumer Cyclical 11.85% Basic Materials 10.93% Technology 10.69% Communication Services 4.71% Real Estate 2.71% Consumer Defensive 2.5% Energy 2.01% Utility 1.29% Asset Allocation
Asset Class Value Cash 1.18% Equity 98.82% Top Securities Holdings / Portfolio
Name Holding Value Quantity Bharat Heavy Electricals Ltd (Industrials)
Equity, Since 30 Sep 22 | 5001033% ₹200 Cr 4,518,139 Mankind Pharma Ltd (Healthcare)
Equity, Since 31 Dec 25 | MANKIND3% ₹194 Cr 800,000 IndusInd Bank Ltd (Financial Services)
Equity, Since 31 Jan 26 | INDUSINDBK3% ₹193 Cr 1,900,000
↑ 200,000 One97 Communications Ltd (Technology)
Equity, Since 31 Dec 25 | PAYTM3% ₹189 Cr 1,100,000 Max Financial Services Ltd (Financial Services)
Equity, Since 30 Nov 23 | 5002713% ₹189 Cr 1,200,000
↑ 100,000 The Federal Bank Ltd (Financial Services)
Equity, Since 31 May 18 | FEDERALBNK3% ₹178 Cr 5,000,000 L&T Finance Ltd (Financial Services)
Equity, Since 31 Jan 25 | LTF3% ₹177 Cr 5,500,000
↑ 1,500,000 Multi Commodity Exchange of India Ltd (Financial Services)
Equity, Since 31 May 26 | MCX3% ₹170 Cr 500,000
↑ 57,253 AU Small Finance Bank Ltd (Financial Services)
Equity, Since 30 Nov 24 | 5406113% ₹163 Cr 1,500,000 Bharti Hexacom Ltd (Communication Services)
Equity, Since 30 Apr 24 | BHARTIHEXA3% ₹158 Cr 1,020,000
↑ 125,509 8. Aditya Birla Sun Life Midcap Fund
Aditya Birla Sun Life Midcap Fund
Growth Launch Date 3 Oct 02 NAV (21 Oct 26) ₹784.28 ↓ -14.71 (-1.84 %) Net Assets (Cr) ₹6,550 on 30 Sep 26 Category Equity - Mid Cap AMC Birla Sun Life Asset Management Co Ltd Rating ☆☆☆ Risk Moderately High Expense Ratio 1.88 Sharpe Ratio 0.11 Information Ratio -0.23 Alpha Ratio 1.18 Min Investment 1,000 Min SIP Investment 1,000 Exit Load 0-365 Days (1%),365 Days and above(NIL) Growth of 10,000 investment over the years.
Date Value 30 Sep 21 ₹10,000 30 Sep 22 ₹10,098 30 Sep 23 ₹12,403 30 Sep 24 ₹18,315 30 Sep 25 ₹16,746 30 Sep 26 ₹17,712 Returns for Aditya Birla Sun Life Midcap Fund
absolute basis & more than 1 year are on CAGR (Compound Annual Growth Rate) basis. as on 21 Oct 26 Duration Returns 1 Month -6.9% 3 Month -7.4% 6 Month -2.1% 1 Year -1.6% 3 Year 11.7% 5 Year 10.6% 10 Year 15 Year Since launch 19.9% Historical performance (Yearly) on absolute basis
Year Returns 2025 4.4% 2024 22% 2023 39.9% 2022 -5.3% 2021 50.4% 2020 15.5% 2019 -3.7% 2018 -16% 2017 44.8% 2016 5.7% Fund Manager information for Aditya Birla Sun Life Midcap Fund
Name Since Tenure Vishal Gajwani 31 Oct 24 1.84 Yr. Data below for Aditya Birla Sun Life Midcap Fund as on 30 Sep 26
Equity Sector Allocation
Sector Value Financial Services 26.52% Industrials 18.73% Basic Materials 12.33% Consumer Cyclical 12.11% Health Care 11.36% Technology 7.39% Consumer Defensive 4.43% Real Estate 3.37% Utility 1.82% Asset Allocation
Asset Class Value Cash 1.37% Equity 98.62% Top Securities Holdings / Portfolio
Name Holding Value Quantity The Federal Bank Ltd (Financial Services)
Equity, Since 31 Mar 12 | FEDERALBNK3% ₹237 Cr 6,656,540
↓ -386,891 AU Small Finance Bank Ltd (Financial Services)
Equity, Since 30 Nov 19 | 5406113% ₹211 Cr 1,940,849 APL Apollo Tubes Ltd (Basic Materials)
Equity, Since 31 Aug 24 | APLAPOLLO3% ₹200 Cr 901,080 Billionbrains Garage Ventures Ltd (Financial Services)
Equity, Since 30 Nov 25 | GROWW3% ₹196 Cr 10,223,440 Max Financial Services Ltd (Financial Services)
Equity, Since 28 Feb 17 | 5002713% ₹181 Cr 1,151,200 Navin Fluorine International Ltd (Basic Materials)
Equity, Since 31 Jan 25 | NAVINFLUOR3% ₹177 Cr 204,519 JK Cement Ltd (Basic Materials)
Equity, Since 31 Jan 24 | JKCEMENT3% ₹176 Cr 342,940 Ajanta Pharma Ltd (Healthcare)
Equity, Since 31 Jul 24 | 5323312% ₹171 Cr 473,984 Thermax Ltd (Industrials)
Equity, Since 31 Oct 19 | THERMAX2% ₹169 Cr 434,194 PB Fintech Ltd (Financial Services)
Equity, Since 31 Oct 25 | POLICYBZR2% ₹166 Cr 885,592 9. Franklin India Prima Fund
Franklin India Prima Fund
Growth Launch Date 1 Dec 93 NAV (21 Oct 26) ₹2,600.79 ↓ -35.34 (-1.34 %) Net Assets (Cr) ₹12,156 on 30 Sep 26 Category Equity - Mid Cap AMC Franklin Templeton Asst Mgmt(IND)Pvt Ltd Rating ☆☆☆ Risk Moderately High Expense Ratio 1.77 Sharpe Ratio -0.18 Information Ratio -0.11 Alpha Ratio -4.52 Min Investment 5,000 Min SIP Investment 500 Exit Load 0-1 Years (1%),1 Years and above(NIL) Growth of 10,000 investment over the years.
Date Value 30 Sep 21 ₹10,000 30 Sep 22 ₹9,810 30 Sep 23 ₹11,930 30 Sep 24 ₹18,386 30 Sep 25 ₹17,321 30 Sep 26 ₹17,334 Returns for Franklin India Prima Fund
absolute basis & more than 1 year are on CAGR (Compound Annual Growth Rate) basis. as on 21 Oct 26 Duration Returns 1 Month -7% 3 Month -8.1% 6 Month -3.7% 1 Year -6.2% 3 Year 12.3% 5 Year 10.6% 10 Year 15 Year Since launch 18.4% Historical performance (Yearly) on absolute basis
Year Returns 2025 1.6% 2024 31.8% 2023 36.8% 2022 2.2% 2021 32.6% 2020 17.8% 2019 3.5% 2018 -9.4% 2017 39.7% 2016 8.5% Fund Manager information for Franklin India Prima Fund
Name Since Tenure R. Janakiraman 1 Feb 11 15.59 Yr. Sandeep Manam 18 Oct 21 4.87 Yr. Akhil Kalluri 7 Feb 22 4.57 Yr. Data below for Franklin India Prima Fund as on 30 Sep 26
Equity Sector Allocation
Sector Value Financial Services 24.92% Industrials 17.46% Consumer Cyclical 14.84% Basic Materials 9.76% Health Care 9.34% Technology 8.96% Real Estate 4.74% Communication Services 2.7% Utility 1.12% Consumer Defensive 0.9% Energy 0.87% Asset Allocation
Asset Class Value Cash 5.11% Equity 94.89% Top Securities Holdings / Portfolio
Name Holding Value Quantity Kalyan Jewellers India Ltd (Consumer Cyclical)
Equity, Since 29 Feb 24 | KALYANKJIL3% ₹379 Cr 6,304,921
↓ -400,000 Biocon Ltd (Healthcare)
Equity, Since 30 Jun 25 | BIOCON3% ₹334 Cr 8,094,684 The Federal Bank Ltd (Financial Services)
Equity, Since 30 Jun 20 | FEDERALBNK3% ₹326 Cr 9,149,683
↓ -500,000 IDFC First Bank Ltd (Financial Services)
Equity, Since 30 Apr 25 | IDFCFIRSTB2% ₹317 Cr 36,893,177 PB Fintech Ltd (Financial Services)
Equity, Since 31 Mar 22 | POLICYBZR2% ₹313 Cr 1,670,853
↑ 70,275 Coforge Ltd (Technology)
Equity, Since 31 Jul 22 | COFORGE2% ₹283 Cr 1,425,747
↓ -200,000 APL Apollo Tubes Ltd (Basic Materials)
Equity, Since 31 Mar 22 | APLAPOLLO2% ₹267 Cr 1,199,891 Prestige Estates Projects Ltd (Real Estate)
Equity, Since 31 Jan 22 | PRESTIGE2% ₹266 Cr 1,631,918 Balkrishna Industries Ltd (Consumer Cyclical)
Equity, Since 30 Apr 24 | BALKRISIND2% ₹256 Cr 1,125,000
↓ -50,000 Ashok Leyland Ltd (Industrials)
Equity, Since 30 Jun 25 | 5004772% ₹256 Cr 14,583,520 10. SBI Magnum Mid Cap Fund
SBI Magnum Mid Cap Fund
Growth Launch Date 29 Mar 05 NAV (21 Oct 26) ₹223.222 ↓ -3.64 (-1.60 %) Net Assets (Cr) ₹23,282 on 30 Sep 26 Category Equity - Mid Cap AMC SBI Funds Management Private Limited Rating ☆☆☆ Risk Moderately High Expense Ratio 1.66 Sharpe Ratio -0.04 Information Ratio -0.99 Alpha Ratio -1.73 Min Investment 5,000 Min SIP Investment 500 Exit Load 0-1 Years (1%),1 Years and above(NIL) Growth of 10,000 investment over the years.
Date Value 30 Sep 21 ₹10,000 30 Sep 22 ₹11,205 30 Sep 23 ₹13,629 30 Sep 24 ₹18,773 30 Sep 25 ₹16,949 30 Sep 26 ₹17,439 Returns for SBI Magnum Mid Cap Fund
absolute basis & more than 1 year are on CAGR (Compound Annual Growth Rate) basis. as on 21 Oct 26 Duration Returns 1 Month -6.4% 3 Month -9.3% 6 Month -4.9% 1 Year -3.4% 3 Year 7.3% 5 Year 10.4% 10 Year 15 Year Since launch 15.5% Historical performance (Yearly) on absolute basis
Year Returns 2025 0.4% 2024 20.3% 2023 34.5% 2022 3% 2021 52.2% 2020 30.4% 2019 0.1% 2018 -18% 2017 33.5% 2016 5% Fund Manager information for SBI Magnum Mid Cap Fund
Name Since Tenure Bhavin Vithlani 1 Apr 24 2.42 Yr. Data below for SBI Magnum Mid Cap Fund as on 30 Sep 26
Equity Sector Allocation
Sector Value Financial Services 24.52% Industrials 20.05% Basic Materials 12.09% Consumer Cyclical 10.5% Health Care 10.28% Utility 6.05% Technology 4.06% Consumer Defensive 3.86% Real Estate 3.61% Communication Services 1.49% Asset Allocation
Asset Class Value Cash 3.49% Equity 96.51% Top Securities Holdings / Portfolio
Name Holding Value Quantity CRISIL Ltd (Financial Services)
Equity, Since 30 Apr 21 | CRISIL3% ₹820 Cr 1,700,000 Multi Commodity Exchange of India Ltd (Financial Services)
Equity, Since 31 Mar 26 | MCX3% ₹748 Cr 2,200,000 Torrent Power Ltd (Utilities)
Equity, Since 30 Jun 19 | 5327793% ₹729 Cr 6,000,000
↑ 1,000,000 Supreme Industries Ltd (Industrials)
Equity, Since 31 Dec 25 | 5099303% ₹712 Cr 2,000,000 Bharat Heavy Electricals Ltd (Industrials)
Equity, Since 31 May 25 | 5001033% ₹664 Cr 15,000,000 Biocon Ltd (Healthcare)
Equity, Since 30 Nov 24 | BIOCON3% ₹643 Cr 15,598,584 The Federal Bank Ltd (Financial Services)
Equity, Since 31 Oct 12 | FEDERALBNK3% ₹642 Cr 18,000,000 Sundaram Finance Ltd (Financial Services)
Equity, Since 30 Sep 22 | SUNDARMFIN3% ₹632 Cr 1,393,043 FSN E-Commerce Ventures Ltd (Consumer Cyclical)
Equity, Since 31 Jul 23 | NYKAA3% ₹629 Cr 18,000,000 ICICI Lombard General Insurance Co Ltd (Financial Services)
Equity, Since 31 Mar 25 | ICICIGI3% ₹627 Cr 3,999,975 11. Axis Mid Cap Fund
Axis Mid Cap Fund
Growth Launch Date 18 Feb 11 NAV (21 Oct 26) ₹114.01 ↓ -1.84 (-1.59 %) Net Assets (Cr) ₹33,528 on 30 Sep 26 Category Equity - Mid Cap AMC Axis Asset Management Company Limited Rating ☆ Risk Moderately High Expense Ratio 1.57 Sharpe Ratio 0.05 Information Ratio 0 Alpha Ratio 0 Min Investment 5,000 Min SIP Investment 500 Exit Load 0-12 Months (1%),12 Months and above(NIL) Growth of 10,000 investment over the years.
Date Value 30 Sep 21 ₹10,000 30 Sep 22 ₹9,932 30 Sep 23 ₹11,431 30 Sep 24 ₹16,977 30 Sep 25 ₹16,222 30 Sep 26 ₹17,021 Returns for Axis Mid Cap Fund
absolute basis & more than 1 year are on CAGR (Compound Annual Growth Rate) basis. as on 21 Oct 26 Duration Returns 1 Month -6.6% 3 Month -5.9% 6 Month -1.1% 1 Year -0.8% 3 Year 13.4% 5 Year 10.1% 10 Year 15 Year Since launch 16.8% Historical performance (Yearly) on absolute basis
Year Returns 2025 1% 2024 30% 2023 29.6% 2022 -5.1% 2021 39.9% 2020 26% 2019 11.3% 2018 3.5% 2017 42% 2016 -3.1% Fund Manager information for Axis Mid Cap Fund
Name Since Tenure Shreyash Devalkar 23 Nov 16 9.78 Yr. Nitin Arora 3 Aug 23 3.08 Yr. Krishnaa N 1 Mar 24 2.5 Yr. Data below for Axis Mid Cap Fund as on 30 Sep 26
Equity Sector Allocation
Sector Value Consumer Cyclical 21.57% Financial Services 19.91% Industrials 18.08% Health Care 12.17% Technology 6.77% Basic Materials 5.31% Consumer Defensive 3.07% Communication Services 2.32% Real Estate 2.13% Utility 1.09% Energy 0.38% Asset Allocation
Asset Class Value Cash 7.03% Equity 92.81% Debt 0.16% Other 0% Top Securities Holdings / Portfolio
Name Holding Value Quantity The Federal Bank Ltd (Financial Services)
Equity, Since 31 Mar 23 | FEDERALBNK4% ₹1,560 Cr 43,740,261 Fortis Healthcare Ltd (Healthcare)
Equity, Since 31 Mar 22 | 5328433% ₹1,136 Cr 12,522,385 Apar Industries Ltd (Industrials)
Equity, Since 30 Nov 23 | APARINDS3% ₹968 Cr 547,073
↑ 24,317 Sona BLW Precision Forgings Ltd (Consumer Cyclical)
Equity, Since 30 Jun 21 | SONACOMS3% ₹960 Cr 11,808,912 GE Vernova T&D India Ltd (Industrials)
Equity, Since 30 Sep 24 | 5222752% ₹833 Cr 1,873,385
↑ 36,477 PB Fintech Ltd (Financial Services)
Equity, Since 31 Jan 24 | POLICYBZR2% ₹823 Cr 4,390,006
↑ 855,101 Indian Hotels Co Ltd (Consumer Cyclical)
Equity, Since 31 Oct 20 | 5008502% ₹808 Cr 10,948,722 Ipca Laboratories Ltd (Healthcare)
Equity, Since 31 Jul 19 | 5244942% ₹791 Cr 4,005,425 Phoenix Mills Ltd (Real Estate)
Equity, Since 31 May 22 | 5031002% ₹755 Cr 3,974,761 Lenskart Solutions Ltd (Healthcare)
Equity, Since 31 Oct 25 | LENSKART2% ₹720 Cr 10,873,986
↑ 606,461
مڈ کیپ فنڈز کا انتخاب کرتے وقت دیکھنے کے لیے پیرامیٹرز
سرمایہ کاروں کو سرمایہ کاری کے لیے صحیح فنڈ کا انتخاب کرتے وقت چند اہم معیار اور مقداری عوامل کو دیکھنا ہوتا ہے۔ اسکیم یا باہمیفنڈ کی درجہ بندی شروع کرنے کے لئے اچھا ہونا چاہئے. اس کو دیگر ڈیٹا کے ساتھ پورا کرنے کی ضرورت ہے، جیسے کہ AUM (اثاثہ جات کے تحت)، فنڈ کی عمر، ماضی کے منافع، اخراجات کا تناسب، وغیرہ۔ مزید برآں، سرمایہ کاروں کو مشورہ دیا جاتا ہے کہ وہ کسی فنڈ کی گزشتہ تین سالوں کی کارکردگی کو چیک کریں۔ ایک فنڈ کے پاس INR 100 کروڑ سے زیادہ کے خالص اثاثے ہونے چاہئیں اور پچھلے ایک سال کے دوران مڈ کیپ اسٹاکس کے لیے کم از کم اوسطاً 50 فیصد سے زیادہ مختص ہونا چاہیے۔ مزید برآں، سرمایہ کاروں کو فنڈز کے اخراجات کا تناسب بھی چیک کرنا چاہیے، تاہم، اس سے فنڈ کی کارکردگی جیسے دیگر اہم عوامل کو ختم نہیں کرنا چاہیے۔
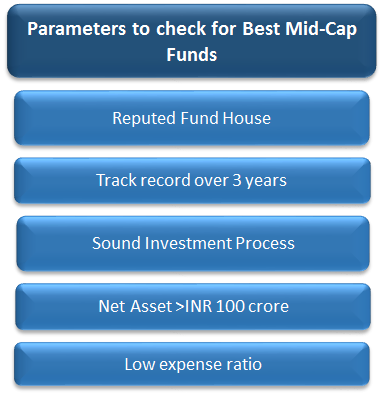
سرمایہ کاروں کو مشورہ دیا جاتا ہے کہ وہ اضافی طور پر دیگر کوالٹی فیکٹرز جیسے کہ فنڈ مینیجر کا ٹریک ریکارڈ اور سرمایہ کاری کے عمل کو بھی چیک کریں۔ ایسے فنڈ ہاؤسز کی نشاندہی کریں جن کی مالیاتی منڈیوں میں مضبوط موجودگی ہے اور ایسے فنڈز فراہم کریں جن کا ٹریک ریکارڈ طویل اور مستقل ہو۔ کسی کو وہ فنڈ ہاؤس منتخب کرنا چاہیے جس پر آپ کو اپنا پیسہ لگانے کا یقین ہو۔ یہ بھی دیکھنا چاہیے کہ کتنے فنڈز ٹاپ پرفارمرز ہیں۔ اچھی کارکردگی کا مظاہرہ کرنے والے فنڈز کی بڑی تعداد کا مطلب یہ ہوگا کہ فنڈ ہاؤس کی مجموعی حکمت عملی اچھی ترتیب میں ہے۔
مڈ کیپ فنڈز میں آن لائن سرمایہ کاری کیسے کریں؟
Fincash.com پر لائف ٹائم کے لیے مفت انویسٹمنٹ اکاؤنٹ کھولیں۔
اپنی رجسٹریشن اور KYC کا عمل مکمل کریں۔
دستاویزات اپ لوڈ کریں (PAN، آدھار، وغیرہ)۔اور، آپ سرمایہ کاری کے لیے تیار ہیں!
نتیجہ
مڈ-کیپ فنڈز کے ساتھ جانا کسی کے سرمایہ کاری کے پورٹ فولیو کے لیے فائدہ مند ثابت ہو سکتا ہے اس بات پر غور کرتے ہوئے کہ وہ جو منافع فراہم کر سکتا ہے۔ مڈ کیپ میوچل فنڈز میں سرمایہ کاری کرتے وقت، سرمایہ کاروں کے لیے یہ مشورہ دیا جاتا ہے کہ وہ نمائش کو زیادہ سے زیادہ سطحوں کے اندر رکھیں کیونکہ مڈ کیپس ہائی رسک ریٹرن فنڈز ہیں۔
یہاں فراہم کردہ معلومات کے درست ہونے کو یقینی بنانے کے لیے تمام کوششیں کی گئی ہیں۔ تاہم، ڈیٹا کی درستگی کے حوالے سے کوئی ضمانت نہیں دی جاتی ہے۔ براہ کرم کوئی بھی سرمایہ کاری کرنے سے پہلے اسکیم کی معلومات کے دستاویز کے ساتھ تصدیق کریں۔
You Might Also Like








AMFI Registration No. 112358 | CIN: U74999MH2016PTC282153
Shepard Technologies Pvt. Ltd. (with ARN code 112358) makes no warranties or representations, express or implied, on products offered through the platform. It accepts no liability for any damages or losses, however caused, in connection with the use of, or on the reliance of its product or related services. Terms and conditions of the website are applicable.
©2026 Shepard Technologies Private Limited. All Rights Reserved
Research Highlights for Motilal Oswal Midcap 30 Fund