ایس آئی پی بمقابلہ ایف ڈی
سرمایہ کاری کا بہتر آپشن کون سا ہے؟
جب ان کے درمیان انتخاب کرنے کی بات آتی ہے تو افراد ہمیشہ کیچ 22 کی صورتحال میں ہوتے ہیں۔ایف ڈی اورگھونٹ سرمایہ کاری کے لیےSIP سرمایہ کاری کا ایک طریقہ ہے۔باہمی چندہ جس کے ذریعے افراد باقاعدہ وقفوں پر تھوڑی بہت رقم جمع کر سکتے ہیں۔.دوسری طرف، ایف ڈی، ایک سرمایہ کاری کا راستہ ہے جہاں لوگ ایک مقررہ مدت کے لیے ایک خاص رقم جمع کرتے ہیں اور میچورٹی کے دوران سود کے ساتھ رقم واپس حاصل کرتے ہیں۔. تو، آئیے سمجھیں کہ FD اور SIP، SIP ریٹرن کیلکولیٹر کے درمیان کون سا بہتر ہے،ٹاپ ایس آئی پی سرمایہ کاری کرنا، اور بہت کچھ۔
سیسٹیمیٹک انویسٹمنٹ پلان یا SIP کیا ہے؟
منظمسرمایہ کاری کا منصوبہ یا ایس آئی پی میوچل فنڈز میں سرمایہ کاری کا ایک طریقہ ہے جو لوگوں کو باقاعدہ وقفوں پر چھوٹی رقم جمع کرنے کی اجازت دیتا ہے۔ ایس آئی پی کو ہدف پر مبنی سرمایہ کاری بھی کہا جا سکتا ہے۔ SIP میوچل فنڈز کی خوبصورتیوں میں سے ایک ہے جس کے ذریعے لوگ اپنی سہولت کے مطابق سرمایہ کاری کر سکتے ہیں۔ ایس آئی پی کے ذریعے لوگ بہت سے مقاصد کو حاصل کرنے کی منصوبہ بندی کر سکتے ہیں جیسے گھر خریدنا، گاڑی خریدنا، اعلیٰ تعلیم کے لیے منصوبہ بندی کرنا، اور بہت کچھ۔ اگرچہ بہت سی اسکیموں میں سرمایہ کاری کا SIP موڈ دستیاب ہے، تاہم، اس کا حوالہ عام طور پر کے تناظر میں دیا جاتا ہے۔ایکویٹی فنڈز.

لوگ اپنی شروعات کر سکتے ہیں۔SIP سرمایہ کاری INR 500 سے کم رقم کے ساتھ۔
فکسڈ ڈپازٹ یا ایف ڈی کیا ہے؟
FD کے فکسڈ ڈپازٹ سے مراد ایک سرمایہ کاری کا راستہ ہے جو عام طور پر بینکوں کے ذریعہ پیش کیا جاتا ہے۔ڈاک خانہ. FD کی صورت میں، لوگوں کو ایک مقررہ مدت کے لیے ایک بار کی ادائیگی کے طور پر کافی رقم جمع کرنے کی ضرورت ہوتی ہے۔ یہاں، لوگوں کو مدت کے اختتام پر اپنی سرمایہ کاری کی رقم واپس مل جاتی ہے۔ تاہم، لوگ مدت کے دوران ایف ڈی کو نہیں توڑ سکتے ہیں اور اگر وہ توڑنے کی کوشش کرتے ہیں تو انہیں کچھ چارجز ادا کرنے کی ضرورت ہوتی ہے۔بینک. ایف ڈیآمدنی سرمایہ کاری پر سود حاصل کرتا ہے۔ سود سے حاصل ہونے والی یہ آمدنی سرمایہ کاروں کے ہاتھ میں قابل ٹیکس ہے۔
کون سا انتخاب کرنا ہے؟
چونکہ ایس آئی پی میوچل فنڈز میں سرمایہ کاری کا طریقہ ہے جبکہ ایف ڈی خود ایک سرمایہ کاری کا راستہ ہے۔ ان دونوں میں مختلف خصوصیات ہیں. تو آئیے ان دونوں کے درمیان فرق کو سمجھیں۔
کم از کم سرمایہ کاری
سرمایہ کاری کے ایس آئی پی موڈ کے ذریعے میوچل فنڈز میں کم از کم سرمایہ کاری شروع ہوتی ہے۔INR 500. اس لیے اس بات کو یقینی بنایا جا سکتا ہے کہ اس سے لوگوں کی جیبوں پر زیادہ اثر نہ پڑے۔ مزید یہ کہ ایس آئی پی کی فریکوئنسی بھی لوگوں کی سہولت کے مطابق ماہانہ یا سہ ماہی مقرر کی جا سکتی ہے۔ دوسری طرف، FD میں سرمایہ کاری کی کم از کم رقم INR 1 کے درمیان ہوتی ہے،000-10,0000 چونکہ FD سرمایہ کاری یکمشت موڈ کے ذریعے ہوتی ہے، اس لیے لوگ اسے جاری نہیں رکھتےسرمایہ کاری رقم.
دور
روایتی سرمایہ کاری کی جگہ ہونے کی وجہ سے FD کو مختصر مدت اور طویل مدتی دونوں سرمایہ کاری کے لیے سمجھا جاتا ہے۔ FD کی مدت 6 ماہ، 1 سال اور 5 سال تک جا سکتی ہے۔ اس کے برعکس، SIP کا انتخاب عام طور پر طویل مدتی سرمایہ کاری کے لیے کیا جاتا ہے۔ چونکہ SIP کا حوالہ عام طور پر ایکویٹی فنڈز کے تناظر میں دیا جاتا ہے، اس لیے طویل مدتی سرمایہ کاری آپ کو زیادہ سے زیادہ آمدنی حاصل کرنے میں مدد دے گی۔ اس کے علاوہ، لوگ زیادہ سے زیادہ فوائد سے لطف اندوز ہو سکتے ہیں اگر انہیں زیادہ دیر تک رکھا جائے۔
واپسی
ایف ڈی پر منافع سود کی شکل میں طے ہوتا ہے جو وقت کے ساتھ تبدیل نہیں ہوتا ہے۔ مالی سال 2017-18 کے لیے، ایف ڈی کی شرحیں۔رینج 6%-7% کے درمیان تقریباً اگر سرمایہ کاری ایک سال کے لیے رکھی جائے۔ اس کے برعکس، SIP کی صورت میں، ریٹرن طے نہیں ہوتے ہیں کیونکہ ریٹرن کا انحصار اس کی کارکردگی پر ہوتا ہے۔زیرِ نظر ایکویٹی حصص تاہم، اگر میوچل فنڈز کو پانچ سال سے زیادہ عرصے کے لیے رکھا جائے تو اس نے 15% سے زیادہ کا تاریخی منافع دیا ہے۔
Talk to our investment specialist
خطرے کی بھوک
SIP کے مقابلے میں FD کے خطرے کی بھوک کو کم سمجھا جاتا ہے۔ FDs عام طور پر بینکوں کے ذریعہ پیش کی جاتی ہیں۔ دوسری طرف، theخطرے کی بھوک SIP کی FD سے زیادہ ہے۔ تاہم، اگر ایس آئی پی کو طویل مدت کے لیے رکھا جاتا ہے، تو نقصان کے امکانات کم ہو جاتے ہیں۔
لیکویڈیٹی
دیلیکویڈیٹی SIP کی صورت میں FD کے مقابلے زیادہ ہے۔ SIP کی صورت میں، اگر لوگ اپنی سرمایہ کاری کو چھڑاتے ہیں تو وہ رقم واپس حاصل کر سکتے ہیں۔ایکویٹی فنڈز کے لیے T+3 دن. تاہم، کی صورت میںقرض فنڈ، تصفیہ کی مدت ہے۔T+1 دن. تاہم، فکسڈ ڈپازٹ کے معاملے میں، اسے چھڑانا آسان نہیں ہے۔ یہاں تک کہ اگر لوگ وقت سے پہلے نکالنے کی کوشش کرتے ہیں، تو انہیں بینک کو کچھ چارجز ادا کرنے کی ضرورت ہوتی ہے۔
ٹیکس لگانا
میوچل فنڈز اور ایف ڈی کے معاملے میں ٹیکس کے قوانین دونوں مختلف ہیں۔ FDs کی صورت میں، مالی سال 2017-18 کے لیے، حاصل کردہ سود فرد کے باقاعدہ ٹیکس سلیب کے مطابق وصول کیا جاتا ہے۔ تاہم، جیسا کہ SIP عام طور پر ایکویٹی فنڈز کے حوالے سے ہوتا ہے، اس لیے ایکویٹی فنڈز سے متعلق ٹیکس کے قواعد کی وضاحت اس طرح کی گئی ہے۔
مالی سال 2017-18 کے لیے، اگر ایکویٹی فنڈز خریداری کی تاریخ سے ایک سال بعد فروخت کیے جاتے ہیں، تو وہ طویل مدتی کے لیے لاگو ہوتے ہیں۔سرمایہ منافع جو قابل ٹیکس نہیں ہے۔ تاہم، اگر یہ رقوم خریداری کی تاریخ سے ایک سال پہلے بیچ دی جائیں تو؛ یہ مختصر مدت کے تابع ہےسرمایہ حاصل جو a پر چارج کیا جاتا ہے۔فلیٹ انفرادی ٹیکس سلیب سے قطع نظر 15% کی شرح۔
خصوصیات
ایس آئی پی میں بہت ساری خصوصیات ہیں جیسے روپے کی اوسط لاگت،کمپاؤنڈنگ کی طاقت، اور اسی طرح، جو ایف ڈی کی صورت میں دستیاب نہیں ہے۔ تو آئیے دیکھتے ہیں کہ ان خصوصیات کا کیا مطلب ہے۔
1. روپے کی اوسط لاگت
ایس آئی پی کی صورت میں، لوگمیوچل فنڈ میں سرمایہ کاری کریں۔ باقاعدہ وقت کے وقفوں پر یونٹس جب مارکیٹیں مختلف قیمتوں کا رویہ دکھا رہی ہوں۔ لہذا، جب مارکیٹوں میں کمی کا رجحان ہوتا ہے، لوگ زیادہ یونٹ خرید سکتے ہیں اور اس کے برعکس۔ لہذا، SIP کی وجہ سے یونٹس کی قیمت خرید اوسط ہو جاتی ہے۔ تاہم، ایف ڈی کے معاملے میں، یہ خصوصیت دستیاب نہیں ہے کیونکہ رقم صرف ایک بار کے لیے جمع کی جاتی ہے۔
2. مرکب سازی کی طاقت
SIP کمپاؤنڈنگ پر لاگو ہوتا ہے۔ مرکب سے مراد مرکب سود ہے جہاں سود کی رقم کا حساب اصل رقم اور پہلے سے جمع شدہ سود پر کیا جاتا ہے۔ ایف ڈی کی صورت میں، سود کی رقم بھی کمپاؤنڈنگ سے مشروط ہے۔
3. نظم و ضبط کی بچت کی عادت
SIP لوگوں میں نظم و ضبط سے بچت کی عادت پیدا کرتا ہے کیونکہ لوگوں کو باقاعدہ وقفوں پر رقم جمع کرنے کی ضرورت ہوتی ہے۔ اس کے برعکس، FD میں چونکہ لوگ صرف ایک بار رقم جمع کرتے ہیں، ان میں بچت کی نظم و ضبط کی عادت پیدا ہو سکتی ہے یا نہیں۔
ذیل میں دیا گیا جدول SIP اور فکسڈ ڈپازٹس کے درمیان فرق کا خلاصہ کرتا ہے۔
| پیرامیٹرز | گھونٹ | فکسڈ ڈپازٹس |
|---|---|---|
| واپسی | فنڈ کی کارکردگی کے مطابق مختلف ہوتی ہے۔ | پہلے سے طے شدہ |
| کم از کم سرمایہ کاری | INR 500 سے شروع ہوتا ہے۔ | رینج INR 1,000 - 10,000 کے درمیان |
| دور | عام طور پر طویل مدتی کے لئے استعمال کیا جاتا ہے | مختصر اور طویل مدتی دونوں |
| خطرہ | اعلی | کم |
| لیکویڈیٹی | اعلی | کم |
| ٹیکس لگانا | قلیل مدت: 15% کی فلیٹ ریٹ پر ٹیکسطویل مدتی: ٹیکس نہیں لگایا | فرد کے سلیب ریٹ کے مطابق ٹیکس لگایا جاتا ہے۔ |
| خصوصیات | روپے کی لاگت کا اوسط، کمپاؤنڈنگ کی طاقت، اور نظم و ضبط کی بچت کی عادت | کمپاؤنڈنگ کی طاقت |
FY 22 - 23 کے لیے سرمایہ کاری کے لیے بہترین SIP
To seek to generate capital appreciation and provide long term growth opportunities by investing in equity and equity related securities of companies domiciled in India whose predominant economic activity is in the (a) discovery, development, production, or distribution of natural resources, viz., energy, mining etc; (b) alternative energy and energy technology sectors, with emphasis given to renewable energy, automotive and on-site power generation, energy storage and enabling energy technologies. also invest a certain portion of its corpus in the equity and equity related securities of companies domiciled overseas, which are principally engaged in the discovery, development, production or distribution of natural resources and alternative energy and/or the units shares of Merrill Lynch international Investment Funds New Energy Fund, Merrill Lynch International Investment Funds World Energy Fund and similar other overseas mutual fund schemes. Below is the key information for DSP Natural Resources and New Energy Fund Returns up to 1 year are on (Erstwhile Aditya Birla Sun Life Small & Midcap Fund) An Open ended Small and Mid Cap Equity Scheme with an objective to generate consistent long-term capital appreciation by investing predominantly in equity and equity related securities of companies considered to be small and midcap. The Scheme may also invest a certain portion of its corpus in fixed income securities including money market instruments, in order to meet liquidity requirements from time to time. Research Highlights for Aditya Birla Sun Life Small Cap Fund Below is the key information for Aditya Birla Sun Life Small Cap Fund Returns up to 1 year are on (Erstwhile Invesco India Growth Fund) The investment objective of the Scheme is to generate long-term capital growth from a diversified portfolio of predominantly equity and equity-related securities. However, there can be no assurance that the objectives of the scheme will be achieved. Research Highlights for Invesco India Growth Opportunities Fund Below is the key information for Invesco India Growth Opportunities Fund Returns up to 1 year are on The primary investment objective of the Scheme is to generate long-term capital appreciation to unit holders from a portfolio that is invested predominantly in equity and equity related securities of companies engaged in banking and financial services. The Scheme does not guarantee/indicate any returns. There can be no assurance that the schemes’ objectives will be achieved. Research Highlights for Aditya Birla Sun Life Banking And Financial Services Fund Below is the key information for Aditya Birla Sun Life Banking And Financial Services Fund Returns up to 1 year are on (Erstwhile Kotak Opportunities Scheme) To generate capital appreciation from a diversified portfolio of equity and equity
related securities. However, there is no assurance that the objective of the scheme will be realized. Research Highlights for Kotak Equity Opportunities Fund Below is the key information for Kotak Equity Opportunities Fund Returns up to 1 year are on Fund NAV Net Assets (Cr) Min SIP Investment 3 MO (%) 6 MO (%) 1 YR (%) 3 YR (%) 5 YR (%) 2024 (%) DSP Natural Resources and New Energy Fund Growth ₹106.327
↑ 0.33 ₹2,401 500 -4.7 0.4 18.3 19.2 15 17.5 Aditya Birla Sun Life Small Cap Fund Growth ₹96.6213
↑ 0.64 ₹5,731 1,000 8.8 17.5 12.8 15.1 12.4 -3.7 Invesco India Growth Opportunities Fund Growth ₹109.74
↑ 0.18 ₹11,164 100 11.6 15.6 8.8 22.8 17.2 4.7 Aditya Birla Sun Life Banking And Financial Services Fund Growth ₹63.22
↑ 0.50 ₹3,676 1,000 3.6 -0.6 5 10.3 11.5 17.5 Kotak Equity Opportunities Fund Growth ₹354.938
↑ 1.80 ₹31,263 1,000 4 1.6 4.4 13.9 14 5.6 Note: Returns up to 1 year are on absolute basis & more than 1 year are on CAGR basis. as on 30 Jul 26 Research Highlights & Commentary of 5 Funds showcased
Commentary DSP Natural Resources and New Energy Fund Aditya Birla Sun Life Small Cap Fund Invesco India Growth Opportunities Fund Aditya Birla Sun Life Banking And Financial Services Fund Kotak Equity Opportunities Fund Point 1 Bottom quartile AUM (₹2,401 Cr). Lower mid AUM (₹5,731 Cr). Upper mid AUM (₹11,164 Cr). Bottom quartile AUM (₹3,676 Cr). Highest AUM (₹31,263 Cr). Point 2 Established history (18+ yrs). Established history (19+ yrs). Established history (18+ yrs). Established history (12+ yrs). Oldest track record among peers (21 yrs). Point 3 Top rated. Rating: 5★ (upper mid). Rating: 5★ (lower mid). Rating: 5★ (bottom quartile). Rating: 5★ (bottom quartile). Point 4 Risk profile: High. Risk profile: Moderately High. Risk profile: Moderately High. Risk profile: High. Risk profile: Moderately High. Point 5 5Y return: 14.99% (upper mid). 5Y return: 12.43% (bottom quartile). 5Y return: 17.20% (top quartile). 5Y return: 11.51% (bottom quartile). 5Y return: 14.03% (lower mid). Point 6 3Y return: 19.21% (upper mid). 3Y return: 15.12% (lower mid). 3Y return: 22.84% (top quartile). 3Y return: 10.29% (bottom quartile). 3Y return: 13.95% (bottom quartile). Point 7 1Y return: 18.33% (top quartile). 1Y return: 12.80% (upper mid). 1Y return: 8.75% (lower mid). 1Y return: 4.98% (bottom quartile). 1Y return: 4.42% (bottom quartile). Point 8 Alpha: 0.00 (bottom quartile). Alpha: 0.00 (bottom quartile). Alpha: 6.78 (top quartile). Alpha: 3.47 (upper mid). Alpha: 0.20 (lower mid). Point 9 Sharpe: 0.72 (top quartile). Sharpe: 0.22 (upper mid). Sharpe: 0.12 (lower mid). Sharpe: -0.06 (bottom quartile). Sharpe: -0.19 (bottom quartile). Point 10 Information ratio: 0.00 (lower mid). Information ratio: 0.00 (bottom quartile). Information ratio: 1.15 (top quartile). Information ratio: 0.24 (upper mid). Information ratio: -0.05 (bottom quartile). DSP Natural Resources and New Energy Fund
Aditya Birla Sun Life Small Cap Fund
Invesco India Growth Opportunities Fund
Aditya Birla Sun Life Banking And Financial Services Fund
Kotak Equity Opportunities Fund
1. DSP Natural Resources and New Energy Fund
DSP Natural Resources and New Energy Fund
Growth Launch Date 25 Apr 08 NAV (30 Jul 26) ₹106.327 ↑ 0.33 (0.31 %) Net Assets (Cr) ₹2,401 on 30 Jun 26 Category Equity - Sectoral AMC DSP BlackRock Invmt Managers Pvt. Ltd. Rating ☆☆☆☆☆ Risk High Expense Ratio 1.99 Sharpe Ratio 0.72 Information Ratio 0 Alpha Ratio 0 Min Investment 1,000 Min SIP Investment 500 Exit Load 0-12 Months (1%),12 Months and above(NIL) Growth of 10,000 investment over the years.
Date Value 31 Jul 21 ₹10,000 31 Jul 22 ₹9,620 31 Jul 23 ₹12,028 31 Jul 24 ₹18,206 31 Jul 25 ₹16,802 31 Jul 26 ₹20,240 Returns for DSP Natural Resources and New Energy Fund
absolute basis & more than 1 year are on CAGR (Compound Annual Growth Rate) basis. as on 30 Jul 26 Duration Returns 1 Month 1.2% 3 Month -4.7% 6 Month 0.4% 1 Year 18.3% 3 Year 19.2% 5 Year 15% 10 Year 15 Year Since launch 13.8% Historical performance (Yearly) on absolute basis
Year Returns 2024 17.5% 2023 13.9% 2022 31.2% 2021 9.8% 2020 42.8% 2019 11.5% 2018 4.4% 2017 -15.3% 2016 43.1% 2015 43.1% Fund Manager information for DSP Natural Resources and New Energy Fund
Name Since Tenure Rohit Singhania 1 Jul 12 14.01 Yr. Data below for DSP Natural Resources and New Energy Fund as on 30 Jun 26
Equity Sector Allocation
Sector Value Energy 48.2% Basic Materials 31.91% Utility 6.09% Industrials 1.57% Technology 0.89% Consumer Cyclical 0.03% Asset Allocation
Asset Class Value Cash 11.3% Equity 88.7% Debt 0% Top Securities Holdings / Portfolio
Name Holding Value Quantity BGF World Energy I2
Investment Fund | -9% ₹226 Cr 602,478 Jindal Steel Ltd (Basic Materials)
Equity, Since 31 Mar 20 | JINDALSTEL7% ₹182 Cr 1,511,761 Tata Steel Ltd (Basic Materials)
Equity, Since 31 Aug 16 | TATASTEEL7% ₹177 Cr 8,510,930
↓ -1,145,482 Bharat Petroleum Corp Ltd (Energy)
Equity, Since 31 Aug 08 | BPCL7% ₹176 Cr 5,912,435
↑ 2,432,211 Hindustan Petroleum Corp Ltd (Energy)
Equity, Since 31 Aug 13 | HINDPETRO6% ₹142 Cr 3,602,448
↑ 2,042,352 Indian Oil Corp Ltd (Energy)
Equity, Since 31 May 25 | IOC6% ₹140 Cr 9,973,891
↑ 3,105,589 Oil & Natural Gas Corp Ltd (Energy)
Equity, Since 31 May 20 | ONGC6% ₹136 Cr 5,107,299
↓ -798,433 Hindustan Zinc Ltd (Basic Materials)
Equity, Since 31 Mar 09 | HINDZINC5% ₹118 Cr 1,866,806 Hindalco Industries Ltd (Basic Materials)
Equity, Since 31 Oct 15 | HINDALCO5% ₹114 Cr 1,008,716 Reliance Industries Ltd (Energy)
Equity, Since 31 Aug 08 | RELIANCE4% ₹106 Cr 800,748
↑ 442,666 2. Aditya Birla Sun Life Small Cap Fund
Aditya Birla Sun Life Small Cap Fund
Growth Launch Date 31 May 07 NAV (31 Jul 26) ₹96.6213 ↑ 0.64 (0.67 %) Net Assets (Cr) ₹5,731 on 30 Jun 26 Category Equity - Small Cap AMC Birla Sun Life Asset Management Co Ltd Rating ☆☆☆☆☆ Risk Moderately High Expense Ratio 1.89 Sharpe Ratio 0.22 Information Ratio 0 Alpha Ratio 0 Min Investment 1,000 Min SIP Investment 1,000 Exit Load 0-365 Days (1%),365 Days and above(NIL) Growth of 10,000 investment over the years.
Date Value 31 Jul 21 ₹10,000 31 Jul 22 ₹9,333 31 Jul 23 ₹11,775 31 Jul 24 ₹16,843 31 Jul 25 ₹15,923 31 Jul 26 ₹17,962 Returns for Aditya Birla Sun Life Small Cap Fund
absolute basis & more than 1 year are on CAGR (Compound Annual Growth Rate) basis. as on 30 Jul 26 Duration Returns 1 Month 1.4% 3 Month 8.8% 6 Month 17.5% 1 Year 12.8% 3 Year 15.1% 5 Year 12.4% 10 Year 15 Year Since launch 12.5% Historical performance (Yearly) on absolute basis
Year Returns 2024 -3.7% 2023 21.5% 2022 39.4% 2021 -6.5% 2020 51.4% 2019 19.8% 2018 -11.5% 2017 -22.6% 2016 56.7% 2015 9.7% Fund Manager information for Aditya Birla Sun Life Small Cap Fund
Name Since Tenure Abhinav Khandelwal 31 Oct 24 1.67 Yr. Dhaval Joshi 21 Nov 22 3.61 Yr. Data below for Aditya Birla Sun Life Small Cap Fund as on 30 Jun 26
Equity Sector Allocation
Sector Value Financial Services 20.62% Consumer Cyclical 17.55% Industrials 14.54% Health Care 12.54% Basic Materials 12.37% Consumer Defensive 8.35% Real Estate 3.63% Technology 3.07% Utility 1.47% Communication Services 0.77% Asset Allocation
Asset Class Value Cash 5.08% Equity 94.92% Top Securities Holdings / Portfolio
Name Holding Value Quantity Navin Fluorine International Ltd (Basic Materials)
Equity, Since 31 Jul 20 | NAVINFLUOR3% ₹164 Cr 230,000 Sai Life Sciences Ltd (Healthcare)
Equity, Since 30 Jun 25 | SAILIFE3% ₹149 Cr 1,286,665 TD Power Systems Ltd (Industrials)
Equity, Since 30 Jun 23 | TDPOWERSYS3% ₹145 Cr 1,096,068
↓ -216,876 Multi Commodity Exchange of India Ltd (Financial Services)
Equity, Since 31 Dec 24 | MCX3% ₹141 Cr 478,000 Arvind Ltd (Consumer Cyclical)
Equity, Since 30 Nov 24 | ARVIND2% ₹129 Cr 2,726,165
↑ 84,152 Radico Khaitan Ltd (Consumer Defensive)
Equity, Since 31 May 20 | RADICO2% ₹115 Cr 327,373 CCL Products (India) Ltd (Consumer Defensive)
Equity, Since 31 May 20 | CCL2% ₹112 Cr 1,060,480 PNB Housing Finance Ltd (Financial Services)
Equity, Since 31 Aug 24 | PNBHOUSING2% ₹111 Cr 1,081,130 Shaily Engineering Plastics Ltd (Basic Materials)
Equity, Since 31 Oct 25 | 5014232% ₹108 Cr 361,012
↑ 1,012 Ujjivan Small Finance Bank Ltd Ordinary Shares (Financial Services)
Equity, Since 31 Mar 25 | 5429042% ₹103 Cr 18,907,129
↑ 1,800,000 3. Invesco India Growth Opportunities Fund
Invesco India Growth Opportunities Fund
Growth Launch Date 9 Aug 07 NAV (31 Jul 26) ₹109.74 ↑ 0.18 (0.16 %) Net Assets (Cr) ₹11,164 on 30 Jun 26 Category Equity - Large & Mid Cap AMC Invesco Asset Management (India) Private Ltd Rating ☆☆☆☆☆ Risk Moderately High Expense Ratio 1.82 Sharpe Ratio 0.12 Information Ratio 1.15 Alpha Ratio 6.78 Min Investment 5,000 Min SIP Investment 100 Exit Load 0-1 Years (1%),1 Years and above(NIL) Growth of 10,000 investment over the years.
Date Value 31 Jul 21 ₹10,000 31 Jul 22 ₹10,105 31 Jul 23 ₹11,931 31 Jul 24 ₹18,404 31 Jul 25 ₹20,337 31 Jul 26 ₹22,116 Returns for Invesco India Growth Opportunities Fund
absolute basis & more than 1 year are on CAGR (Compound Annual Growth Rate) basis. as on 30 Jul 26 Duration Returns 1 Month 1.4% 3 Month 11.6% 6 Month 15.6% 1 Year 8.8% 3 Year 22.8% 5 Year 17.2% 10 Year 15 Year Since launch 13.5% Historical performance (Yearly) on absolute basis
Year Returns 2024 4.7% 2023 37.5% 2022 31.6% 2021 -0.4% 2020 29.7% 2019 13.3% 2018 10.7% 2017 -0.2% 2016 39.6% 2015 3.3% Fund Manager information for Invesco India Growth Opportunities Fund
Name Since Tenure Aditya Khemani 9 Nov 23 2.64 Yr. Data below for Invesco India Growth Opportunities Fund as on 30 Jun 26
Equity Sector Allocation
Sector Value Financial Services 26.21% Health Care 18.9% Industrials 18.79% Consumer Cyclical 17.87% Real Estate 7.6% Basic Materials 4.07% Technology 2.71% Communication Services 1.71% Utility 1.37% Asset Allocation
Asset Class Value Cash 0.76% Equity 99.23% Top Securities Holdings / Portfolio
Name Holding Value Quantity Max Healthcare Institute Ltd Ordinary Shares (Healthcare)
Equity, Since 30 Nov 22 | MAXHEALTH7% ₹687 Cr 7,118,724
↑ 170,000 Eternal Ltd (Consumer Cyclical)
Equity, Since 30 Jun 23 | ETERNAL7% ₹684 Cr 27,307,479
↑ 2,577,787 InterGlobe Aviation Ltd (Industrials)
Equity, Since 31 Mar 24 | INDIGO6% ₹654 Cr 1,484,863
↑ 95,086 ICICI Bank Ltd (Financial Services)
Equity, Since 31 Dec 15 | ICICIBANK6% ₹646 Cr 5,141,398
↑ 511,565 Sai Life Sciences Ltd (Healthcare)
Equity, Since 31 Dec 24 | SAILIFE5% ₹497 Cr 4,283,799 Trent Ltd (Consumer Cyclical)
Equity, Since 28 Feb 22 | TRENT5% ₹460 Cr 1,089,122 Prestige Estates Projects Ltd (Real Estate)
Equity, Since 31 Dec 23 | PRESTIGE4% ₹452 Cr 3,304,450
↑ 174,545 ABB India Ltd (Industrials)
Equity, Since 30 Jun 23 | ABB4% ₹441 Cr 608,622
↑ 143,577 BSE Ltd (Financial Services)
Equity, Since 31 Oct 23 | BSE4% ₹396 Cr 955,364
↓ -149,234 L&T Finance Ltd (Financial Services)
Equity, Since 30 Apr 24 | LTF3% ₹325 Cr 11,339,315 4. Aditya Birla Sun Life Banking And Financial Services Fund
Aditya Birla Sun Life Banking And Financial Services Fund
Growth Launch Date 14 Dec 13 NAV (31 Jul 26) ₹63.22 ↑ 0.50 (0.80 %) Net Assets (Cr) ₹3,676 on 30 Jun 26 Category Equity - Sectoral AMC Birla Sun Life Asset Management Co Ltd Rating ☆☆☆☆☆ Risk High Expense Ratio 1.99 Sharpe Ratio -0.06 Information Ratio 0.24 Alpha Ratio 3.47 Min Investment 1,000 Min SIP Investment 1,000 Exit Load 0-365 Days (1%),365 Days and above(NIL) Growth of 10,000 investment over the years.
Date Value 31 Jul 21 ₹10,000 31 Jul 22 ₹10,150 31 Jul 23 ₹12,850 31 Jul 24 ₹15,342 31 Jul 25 ₹16,422 31 Jul 26 ₹17,240 Returns for Aditya Birla Sun Life Banking And Financial Services Fund
absolute basis & more than 1 year are on CAGR (Compound Annual Growth Rate) basis. as on 30 Jul 26 Duration Returns 1 Month -0.6% 3 Month 3.6% 6 Month -0.6% 1 Year 5% 3 Year 10.3% 5 Year 11.5% 10 Year 15 Year Since launch 15.7% Historical performance (Yearly) on absolute basis
Year Returns 2024 17.5% 2023 8.7% 2022 21.7% 2021 11.5% 2020 16.8% 2019 1.1% 2018 14.9% 2017 -2.4% 2016 47.6% 2015 15.7% Fund Manager information for Aditya Birla Sun Life Banking And Financial Services Fund
Name Since Tenure Dhaval Gala 26 Aug 15 10.85 Yr. Data below for Aditya Birla Sun Life Banking And Financial Services Fund as on 30 Jun 26
Equity Sector Allocation
Sector Value Financial Services 95.86% Technology 1.2% Asset Allocation
Asset Class Value Cash 2.2% Equity 97.8% Top Securities Holdings / Portfolio
Name Holding Value Quantity ICICI Bank Ltd (Financial Services)
Equity, Since 31 Dec 13 | ICICIBANK13% ₹467 Cr 3,717,929 HDFC Bank Ltd (Financial Services)
Equity, Since 31 Dec 13 | HDFCBANK11% ₹377 Cr 5,058,496
↓ -350,000 Axis Bank Ltd (Financial Services)
Equity, Since 31 Oct 18 | AXISBANK9% ₹296 Cr 2,302,100 Bajaj Finance Ltd (Financial Services)
Equity, Since 30 Sep 16 | BAJFINANCE6% ₹194 Cr 2,137,250 State Bank of India (Financial Services)
Equity, Since 31 Oct 17 | SBIN5% ₹185 Cr 1,918,689 Shriram Finance Ltd (Financial Services)
Equity, Since 30 Jun 23 | SHRIRAMFIN5% ₹179 Cr 1,886,669 Kotak Mahindra Bank Ltd (Financial Services)
Equity, Since 31 Jan 19 | KOTAKBANK4% ₹129 Cr 3,346,665
↓ -200,000 AU Small Finance Bank Ltd (Financial Services)
Equity, Since 30 Nov 23 | AUBANK3% ₹103 Cr 1,046,861
↓ -300,000 Bank of Maharashtra (Financial Services)
Equity, Since 31 Dec 25 | MAHABANK3% ₹99 Cr 12,546,499 SBI Life Insurance Co Ltd (Financial Services)
Equity, Since 31 Mar 21 | SBILIFE3% ₹98 Cr 533,402 5. Kotak Equity Opportunities Fund
Kotak Equity Opportunities Fund
Growth Launch Date 9 Sep 04 NAV (31 Jul 26) ₹354.938 ↑ 1.80 (0.51 %) Net Assets (Cr) ₹31,263 on 30 Jun 26 Category Equity - Large & Mid Cap AMC Kotak Mahindra Asset Management Co Ltd Rating ☆☆☆☆☆ Risk Moderately High Expense Ratio 1.6 Sharpe Ratio -0.19 Information Ratio -0.05 Alpha Ratio 0.2 Min Investment 5,000 Min SIP Investment 1,000 Exit Load 0-1 Years (1%),1 Years and above(NIL) Growth of 10,000 investment over the years.
Date Value 31 Jul 21 ₹10,000 31 Jul 22 ₹10,681 31 Jul 23 ₹13,030 31 Jul 24 ₹18,726 31 Jul 25 ₹18,461 31 Jul 26 ₹19,278 Returns for Kotak Equity Opportunities Fund
absolute basis & more than 1 year are on CAGR (Compound Annual Growth Rate) basis. as on 30 Jul 26 Duration Returns 1 Month 1.9% 3 Month 4% 6 Month 1.6% 1 Year 4.4% 3 Year 13.9% 5 Year 14% 10 Year 15 Year Since launch 17.7% Historical performance (Yearly) on absolute basis
Year Returns 2024 5.6% 2023 24.2% 2022 29.3% 2021 7% 2020 30.4% 2019 16.5% 2018 13.2% 2017 -5.6% 2016 34.9% 2015 9.6% Fund Manager information for Kotak Equity Opportunities Fund
Name Since Tenure Harsha Upadhyaya 4 Aug 12 13.91 Yr. Data below for Kotak Equity Opportunities Fund as on 30 Jun 26
Equity Sector Allocation
Sector Value Financial Services 30.64% Industrials 17.25% Consumer Cyclical 11.9% Basic Materials 11.28% Health Care 7.78% Technology 6.76% Energy 4.8% Utility 3.62% Communication Services 2.71% Consumer Defensive 0.92% Real Estate 0.79% Asset Allocation
Asset Class Value Cash 1.11% Equity 98.89% Other 0% Top Securities Holdings / Portfolio
Name Holding Value Quantity HDFC Bank Ltd (Financial Services)
Equity, Since 31 Jul 23 | HDFCBANK5% ₹1,452 Cr 19,500,000 State Bank of India (Financial Services)
Equity, Since 28 Feb 21 | SBIN4% ₹1,206 Cr 12,500,000 Bharat Electronics Ltd (Industrials)
Equity, Since 31 Oct 18 | BEL4% ₹1,150 Cr 28,000,000 Eternal Ltd (Consumer Cyclical)
Equity, Since 31 Aug 23 | ETERNAL3% ₹902 Cr 36,000,000 ICICI Bank Ltd (Financial Services)
Equity, Since 30 Sep 10 | ICICIBANK3% ₹879 Cr 7,000,000 BSE Ltd (Financial Services)
Equity, Since 30 Nov 25 | BSE3% ₹829 Cr 2,000,000 Axis Bank Ltd (Financial Services)
Equity, Since 31 Oct 12 | AXISBANK3% ₹798 Cr 6,200,000 Larsen & Toubro Ltd (Industrials)
Equity, Since 30 Sep 13 | LT3% ₹754 Cr 1,850,000 Bharti Airtel Ltd (Communication Services)
Equity, Since 28 Feb 21 | BHARTIARTL2% ₹695 Cr 3,800,000 Bharat Forge Ltd (Consumer Cyclical)
Equity, Since 31 Dec 20 | BHARATFORG2% ₹665 Cr 3,400,000
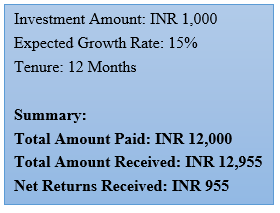
ایس آئی پی ریٹرن کیلکولیٹر
SIP کی واپسی مختلف ہوتی رہتی ہے۔ تاہم، یہ فرض کرتے ہوئے کہ منافع کی تاریخی شرح 15% ہے، آئیے دیکھتے ہیں کہ INR 1,000 کی SIP سرمایہ کاری 12 ماہ کی مدت میں کیسے بڑھتی ہے۔
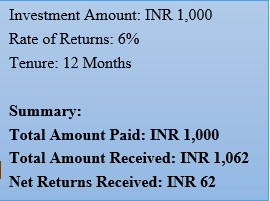
ایف ڈی کیلکولیٹر
ایف ڈی کی شرحیں بھی بینک سے بینکوں میں مختلف ہوتی رہتی ہیں۔ تاہم، سود کی شرح کو 6% مانتے ہوئے، آئیے دیکھتے ہیں کہ اگر سرمایہ کاری کی رقم INR 1,000 ہے تو FD 12 ماہ کی مدت میں کیسی کارکردگی دکھائے گا۔
MF SIP آن لائن میں کیسے سرمایہ کاری کی جائے؟
Fincash.com پر لائف ٹائم کے لیے مفت انویسٹمنٹ اکاؤنٹ کھولیں۔
اپنی رجسٹریشن اور KYC کا عمل مکمل کریں۔
دستاویزات اپ لوڈ کریں (PAN، آدھار، وغیرہ)۔اور، آپ سرمایہ کاری کے لیے تیار ہیں!
نتیجہ: ایس آئی پی یا ایف ڈی
نتیجہ اخذ کرنے کے لیے، یہ کہا جا سکتا ہے کہ FD کے مقابلے SIP کے زیادہ فوائد ہیں۔ تاہم، لوگوں کو ہمیشہ یہ مشورہ دیا جاتا ہے کہ وہ سرمایہ کاری کرنے سے پہلے کسی اسکیم کے کام کو پوری طرح سمجھ لیں۔ اس کے علاوہ، وہ کسی ذاتی سے بھی مشورہ کر سکتے ہیں۔مشیر خزانہ اس بات کو یقینی بنانے کے لیے کہ ان کی سرمایہ کاری محفوظ ہو اور ان کے مقاصد پورے ہوں۔
یہاں فراہم کردہ معلومات کے درست ہونے کو یقینی بنانے کے لیے تمام کوششیں کی گئی ہیں۔ تاہم، ڈیٹا کی درستگی کے حوالے سے کوئی ضمانت نہیں دی جاتی ہے۔ براہ کرم کوئی بھی سرمایہ کاری کرنے سے پہلے اسکیم کی معلومات کے دستاویز کے ساتھ تصدیق کریں۔


")

AMFI Registration No. 112358 | CIN: U74999MH2016PTC282153
Shepard Technologies Pvt. Ltd. (with ARN code 112358) makes no warranties or representations, express or implied, on products offered through the platform. It accepts no liability for any damages or losses, however caused, in connection with the use of, or on the reliance of its product or related services. Terms and conditions of the website are applicable.
©2026 Shepard Technologies Private Limited. All Rights Reserved
Research Highlights for DSP Natural Resources and New Energy Fund