ایس آئی پی بمقابلہ آر ڈی
سرمایہ کاری کا بہتر آپشن کون سا ہے؟
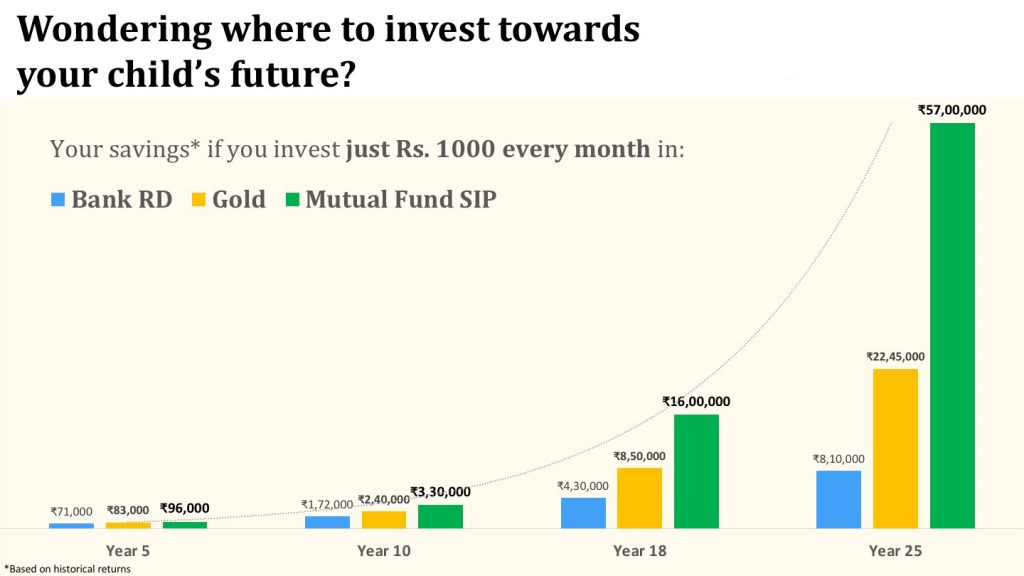
گھونٹ بمقابلہ آر ڈی؟کہاں سرمایہ کاری کرنا ہے بہتر دولت کی تخلیق کے لیے؟ دولت پیدا کرنے کا ایک حتمی طریقہ ہر ماہ پیسہ بچانا ہے۔ عام طور پر، ایک منظمسرمایہ کاری کا منصوبہ (SIP) اور ایک RD (ریکرنگ ڈپازٹ) ہندوستان میں سرمایہ کاری کے دو موثر ترین اختیارات ہیں۔پیسے بچانا ہر مہینے. SIP اور RD دونوں ہی سرمایہ کاروں کو اس قابل بناتے ہیں کہ وہ اچھے منافع کمانے کے لیے باقاعدہ وقفوں میں چھوٹی رقم کی سرمایہ کاری کریں۔ سیسٹیمیٹک انویسٹمنٹ پلان (SIP) کے ساتھ، سرمایہ کاروں کو کمانے کے لیے، ماہانہ یا سہ ماہی، تھوڑی سی رقم کی سرمایہ کاری کرنی پڑتی ہے۔مارکیٹ- منسلک واپسی ایک RD (بار بار جمع کرنے) کے ساتھ،سرمایہ کار مقررہ منافع حاصل کرنے کے لیے پہلے سے طے شدہ مدت کے لیے مقررہ رقم کی سرمایہ کاری کرتا ہے۔ اب، سرمایہ کار آسانی سے ایس آئی پی ریٹرن کا حساب لگا سکتے ہیں۔گھونٹ کیلکولیٹر اور RD ایک کا استعمال کرتے ہوئے واپسی کرتا ہے۔آر ڈی کیلکولیٹر ان کی سرمایہ کاری کی ضروریات کا اندازہ لگانے کے لیے۔
ہندوستان میں، چند سب سے آسان متواتر سرمایہ کاری کے اختیارات میں SIP، RD اور شامل ہیں۔پی پی ایف (ایس آئی پی سب سے زیادہ مقبول ہے)۔
SIP بمقابلہ RD - پروڈکٹ کا ڈھانچہ
سیسٹیمیٹک انویسٹمنٹ پلان (SIP)
ایک SIP ایک ہے۔سرمایہ کاری ایک خاص رقم کی سرمایہ کاری کرنے کا موڈباہمی چندہ وقتا فوقتا کم از کم رقمSIP میں سرمایہ کاری کریں۔ INR 500 سے کم ہے۔ عام طور پر، ایکویٹی میں SIPs کو اچھا منافع پیش کیا جاتا ہے کیونکہ وہ مارکیٹ سے منسلک ہوتے ہیں اور مارکیٹ کے مطابق واپسی دے سکتے ہیں۔ مختلف ذرائع کے مطابق، طویل عرصے کے دوران SIP کی واپسی 12% سے 22% p.a. تک زیادہ ہو سکتی ہے، جو کہ RD (بار بار جمع ہونے والی جمع) کی طرف سے پیش کردہ سود کی شرح سے بہت زیادہ ہے۔ ایس آئی پی (سسٹمیٹک انویسٹمنٹ پلان) کا واحد نقصان یہ ہے کہ ایس آئی پی کی واپسی غیر مستحکم ہوتی ہے کیونکہ وہ مارکیٹ سے منسلک ہوتے ہیں، اس لیے خطرہعنصر بہت زیادہ ہے. تاہم، جب طویل مدتی کے لیے سرمایہ کاری کی جاتی ہے، تو SIPs کو اچھا منافع پیش کرنے کے لیے سمجھا جاتا ہے۔
اعادی جمع (RD)
ریکرنگ ڈپازٹ یا RD ایک سرمایہ کاری اسکیم ہے جس میں سرمایہ کار کو سرمایہ کاری سے پہلے سرمایہ کاری کی رقم اور سرمایہ کاری کی مدت کا انتخاب کرنا ہوتا ہے۔ ایک RD کے تحت، سرمایہ کار کو کچھ سود اور سرمایہ کاری کی گئی رقم حاصل کرنے کے لیے منتخب مدت میں ماہانہ سرمایہ کاری کرنی پڑتی ہے۔ عام طور پر، RD کی شرح سود 7% سے 9% p.a تک ہوتی ہے۔ اور اس کے نتیجے میں بزرگ شہریوں کے لیے زیادہ ہے۔ RD واپسی کی شرح فکسڈ ڈپازٹ اور SIP سے بہت کم ہے کیونکہ ایک RD پورے 12 ماہ کا سود صرف پہلی ڈپازٹ پر حاصل کرتا ہے۔ RD میں دوسرے ڈپازٹ پر، سود 11 مہینوں کے لیے، تیسرے ڈپازٹ پر 10 ماہ کے لیے حاصل کیا جاتا ہے وغیرہ۔ لہذا، اس کے برعکس، RD میں کوئی مرکب فوائد نہیں ہیں۔ایف ڈی اور SIP. RD ریٹرن طے شدہ ہیں اور RD کیلکولیٹر کا استعمال کرتے ہوئے آسانی سے شمار کیا جا سکتا ہے۔ ریکرنگ ڈپازٹ کا سب سے بڑا نقصان یہ ہے کہ یہ ٹیکس موثر نہیں ہے۔ TDS (ماخذ پر ٹیکس کٹوتی) سود پر لاگو ہوتا ہے۔آمدنی RD سے
Talk to our investment specialist
سرفہرست 7 پرفارمنگ بیلنسڈ فنڈ SIP
جیسا کہمتوازن فنڈ سے کم خطرہ ہےایکویٹی میوچل فنڈز، متوازن فنڈز طویل مدت کے دوران مستحکم منافع دے سکتے ہیں۔ نیچے دیے گئے فنڈز کی فہرست گزشتہ 3 سال کے سالانہ ریٹرن پر مبنی ہے (سی اے جی آر) اور فنڈز جن کے خالص اثاثے زیادہ ہیں۔500 کروڑ اور فنڈ کی عمر > 3 سال۔
(Erstwhile BOI AXA Mid Cap Equity And Debt Fund) The scheme's objective is to provide capital appreciation and income distribution to investors from a portfolio constituting of mid cap equity and equity related securities as well as fixed income securities.However there can be no assurance that the investment objectives of the Scheme will be realized Below is the key information for BOI AXA Mid and Small Cap Equity and Debt Fund Returns up to 1 year are on (Erstwhile Sundaram Balanced Fund) The scheme seeks to generate capital appreciation and current income through a judicious mix of investments in equities and fixed income securities. Research Highlights for Sundaram Equity Hybrid Fund Below is the key information for Sundaram Equity Hybrid Fund Returns up to 1 year are on (Erstwhile SBI Magnum Monthly Income Plan Floater) To provide regular income, liquidity and attractive returns to investors in addition
to mitigating the impact of interest rate risk through an actively managed
portfolio of floating rate and fixed rate debt instruments, equity, money market
instruments and derivatives. Research Highlights for SBI Multi Asset Allocation Fund Below is the key information for SBI Multi Asset Allocation Fund Returns up to 1 year are on (Erstwhile ICICI Prudential Dynamic Plan) To generate capital appreciation by actively investing in equity and equity related securities. For defensive considerations, the Scheme may invest in debt, money market instruments and derivatives. The investment manager will have the discretion to take aggressive asset calls i.e. by staying 100% invested in equity market/equity related instruments at a given point of time and 0% at another, in which case, the fund may be invested in debt related instruments at its discretion. The AMC may choose to churn the portfolio of the Scheme in order to achieve the investment objective. The Scheme is suitable for investors seeking high returns and for those who are willing to take commensurate risks. Research Highlights for ICICI Prudential Multi-Asset Fund Below is the key information for ICICI Prudential Multi-Asset Fund Returns up to 1 year are on (Erstwhile UTI Wealth Builder Fund) The objective of the Scheme is to achieve long term capital appreciation by investing predominantly in a diversified portfolio of equity and equity related instruments along with investments in Gold ETFs and Debt and Money Market Instruments. However, there can be no assurance that the investment objective of the Scheme will be achieved. Research Highlights for UTI Multi Asset Fund Below is the key information for UTI Multi Asset Fund Returns up to 1 year are on (Erstwhile ICICI Prudential Balanced Fund) To generate long term capital appreciation and current income from a portfolio
that is invested in equity and equity related securities as well as in fixed income
securities. Research Highlights for ICICI Prudential Equity and Debt Fund Below is the key information for ICICI Prudential Equity and Debt Fund Returns up to 1 year are on (Erstwhile IDFC Balanced Fund) The Fund seeks to generate long term capital appreciation along with current income by investing in a mix of equity and equity related securities, debt securities and money market instruments. There is no assurance or guarantee that the objectives of the scheme will be realised. Research Highlights for Bandhan Hybrid Equity Fund Below is the key information for Bandhan Hybrid Equity Fund Returns up to 1 year are on 1. BOI AXA Mid and Small Cap Equity and Debt Fund
BOI AXA Mid and Small Cap Equity and Debt Fund
Growth Launch Date 20 Jul 16 NAV (22 Jul 26) ₹41.84 ↓ -0.22 (-0.52 %) Net Assets (Cr) ₹1,695 on 30 Jun 26 Category Hybrid - Hybrid Equity AMC BOI AXA Investment Mngrs Private Ltd Rating Risk Moderately High Expense Ratio 2.27 Sharpe Ratio 0.17 Information Ratio 0 Alpha Ratio 0 Min Investment 5,000 Min SIP Investment 1,000 Exit Load 0-1 Years (1%),1 Years and above(NIL) Growth of 10,000 investment over the years.
Date Value 30 Jun 21 ₹10,000 30 Jun 22 ₹9,742 30 Jun 23 ₹12,045 30 Jun 24 ₹18,301 30 Jun 25 ₹18,914 30 Jun 26 ₹20,302 Returns for BOI AXA Mid and Small Cap Equity and Debt Fund
absolute basis & more than 1 year are on CAGR (Compound Annual Growth Rate) basis. as on 22 Jul 26 Duration Returns 1 Month -0.5% 3 Month 4% 6 Month 12.9% 1 Year 7.8% 3 Year 18% 5 Year 14% 10 Year 15 Year Since launch 15.4% Historical performance (Yearly) on absolute basis
Year Returns 2025 -0.9% 2024 25.8% 2023 33.7% 2022 -4.8% 2021 54.5% 2020 31.1% 2019 -4.7% 2018 -14.2% 2017 47.1% 2016 Fund Manager information for BOI AXA Mid and Small Cap Equity and Debt Fund
Name Since Tenure Alok Singh 16 Feb 17 9.38 Yr. Data below for BOI AXA Mid and Small Cap Equity and Debt Fund as on 30 Jun 26
Asset Allocation
Asset Class Value Cash 9.83% Equity 78.48% Debt 11.69% Equity Sector Allocation
Sector Value Industrials 16.69% Financial Services 16.24% Basic Materials 13.91% Health Care 10.42% Consumer Cyclical 10.21% Technology 4.93% Consumer Defensive 3.01% Energy 0.98% Real Estate 0.9% Utility 0.77% Communication Services 0.42% Debt Sector Allocation
Sector Value Corporate 7.58% Cash Equivalent 7.09% Government 6.86% Credit Quality
Rating Value AA 8.71% AAA 91.29% Top Securities Holdings / Portfolio
Name Holding Value Quantity Abbott India Ltd (Healthcare)
Equity, Since 31 Jan 23 | ABBOTINDIA3% ₹40 Cr 15,000 Lloyds Metals & Energy Ltd (Basic Materials)
Equity, Since 28 Feb 25 | 5124553% ₹40 Cr 221,723 UNO Minda Ltd (Consumer Cyclical)
Equity, Since 31 Jul 19 | UNOMINDA2% ₹36 Cr 331,037 Aurobindo Pharma Ltd (Healthcare)
Equity, Since 31 Jan 26 | AUROPHARMA2% ₹34 Cr 240,000 Glenmark Pharmaceuticals Ltd (Healthcare)
Equity, Since 31 Jul 25 | GLENMARK2% ₹34 Cr 150,000 Indian Bank (Financial Services)
Equity, Since 31 Aug 23 | INDIANB2% ₹34 Cr 405,000 Nippon Life India Asset Management Ltd Ordinary Shares (Financial Services)
Equity, Since 31 Jan 24 | NAM-INDIA2% ₹33 Cr 300,000 Max Financial Services Ltd (Financial Services)
Equity, Since 28 Feb 26 | MFSL2% ₹32 Cr 191,000
↑ 21,000 Bank of Maharashtra (Financial Services)
Equity, Since 31 May 24 | MAHABANK2% ₹31 Cr 3,910,000 Bharat Dynamics Ltd Ordinary Shares (Industrials)
Equity, Since 31 Jul 24 | BDL2% ₹29 Cr 242,000 2. Sundaram Equity Hybrid Fund
Sundaram Equity Hybrid Fund
Growth Launch Date 23 Jun 00 NAV (31 Dec 21) ₹135.137 ↑ 0.78 (0.58 %) Net Assets (Cr) ₹1,954 on 30 Nov 21 Category Hybrid - Hybrid Equity AMC Sundaram Asset Management Company Ltd Rating ☆☆ Risk Moderately High Expense Ratio 2.18 Sharpe Ratio 2.64 Information Ratio -0.12 Alpha Ratio 5.81 Min Investment 5,000 Min SIP Investment 100 Exit Load 0-12 Months (1%),12 Months and above(NIL) Growth of 10,000 investment over the years.
Date Value 30 Jun 21 ₹10,000 Returns for Sundaram Equity Hybrid Fund
absolute basis & more than 1 year are on CAGR (Compound Annual Growth Rate) basis. as on 22 Jul 26 Duration Returns 1 Month 1.8% 3 Month 0.5% 6 Month 10.5% 1 Year 27.1% 3 Year 16% 5 Year 14.2% 10 Year 15 Year Since launch 12.8% Historical performance (Yearly) on absolute basis
Year Returns 2025 2024 2023 2022 2021 2020 2019 2018 2017 2016 Fund Manager information for Sundaram Equity Hybrid Fund
Name Since Tenure Data below for Sundaram Equity Hybrid Fund as on 30 Nov 21
Asset Allocation
Asset Class Value Equity Sector Allocation
Sector Value Debt Sector Allocation
Sector Value Credit Quality
Rating Value Top Securities Holdings / Portfolio
Name Holding Value Quantity 3. SBI Multi Asset Allocation Fund
SBI Multi Asset Allocation Fund
Growth Launch Date 21 Dec 05 NAV (22 Jul 26) ₹66.5634 ↓ -0.41 (-0.61 %) Net Assets (Cr) ₹19,354 on 30 Jun 26 Category Hybrid - Multi Asset AMC SBI Funds Management Private Limited Rating ☆☆☆☆ Risk Moderate Expense Ratio 1.46 Sharpe Ratio 0.53 Information Ratio 0 Alpha Ratio 0 Min Investment 5,000 Min SIP Investment 500 Exit Load 0-12 Months (1%),12 Months and above(NIL) Growth of 10,000 investment over the years.
Date Value 30 Jun 21 ₹10,000 30 Jun 22 ₹10,098 30 Jun 23 ₹11,987 30 Jun 24 ₹15,440 30 Jun 25 ₹16,916 30 Jun 26 ₹18,817 Returns for SBI Multi Asset Allocation Fund
absolute basis & more than 1 year are on CAGR (Compound Annual Growth Rate) basis. as on 22 Jul 26 Duration Returns 1 Month -0.1% 3 Month 0.7% 6 Month 0.7% 1 Year 10.6% 3 Year 15.4% 5 Year 13.1% 10 Year 15 Year Since launch 9.6% Historical performance (Yearly) on absolute basis
Year Returns 2025 18.6% 2024 12.8% 2023 24.4% 2022 6% 2021 13% 2020 14.2% 2019 10.6% 2018 0.4% 2017 10.9% 2016 8.7% Fund Manager information for SBI Multi Asset Allocation Fund
Name Since Tenure Dinesh Balachandran 31 Oct 21 4.67 Yr. Mansi Sajeja 1 Dec 23 2.58 Yr. Vandna Soni 1 Jan 24 2.5 Yr. Data below for SBI Multi Asset Allocation Fund as on 30 Jun 26
Asset Allocation
Asset Class Value Cash 10.43% Equity 50.44% Debt 29.33% Other 9.8% Equity Sector Allocation
Sector Value Financial Services 13.27% Consumer Cyclical 5.88% Health Care 4.76% Real Estate 4.48% Utility 4.27% Energy 3.97% Basic Materials 3.94% Industrials 2.47% Consumer Defensive 2.36% Technology 2% Communication Services 1.98% Debt Sector Allocation
Sector Value Corporate 25.16% Cash Equivalent 9.53% Government 5.07% Credit Quality
Rating Value A 5.4% AA 52.44% AAA 42.16% Top Securities Holdings / Portfolio
Name Holding Value Quantity SBI Gold ETF
- | -6% ₹1,097 Cr 85,591,000 SBI Silver ETF
- | -4% ₹791 Cr 32,296,178 Brookfield India Real Estate Trust (Real Estate)
-, Since 30 Apr 25 | 5432613% ₹484 Cr 15,164,234 Bandhan Bank Ltd (Financial Services)
Equity, Since 30 Sep 24 | 5411532% ₹432 Cr 20,500,000 GAIL (India) Ltd (Utilities)
Equity, Since 31 Mar 21 | 5321552% ₹410 Cr 23,350,297 Indus Towers Ltd Ordinary Shares (Communication Services)
Equity, Since 31 Jan 26 | 5348162% ₹339 Cr 8,200,000 Biocon Ltd (Healthcare)
Equity, Since 30 Nov 24 | 5325232% ₹330 Cr 7,920,476 Syngene International Ltd (Healthcare)
Equity, Since 15 Mar 26 | 5392682% ₹317 Cr 7,000,000 ICICI Bank Ltd (Financial Services)
Equity, Since 15 Apr 22 | ICICIBANK2% ₹308 Cr 2,320,000 National Bank For Agriculture And Rural Development
Debentures | -2% ₹301 Cr 30,000 4. ICICI Prudential Multi-Asset Fund
ICICI Prudential Multi-Asset Fund
Growth Launch Date 31 Oct 02 NAV (21 Jul 26) ₹810.593 ↑ 0.84 (0.10 %) Net Assets (Cr) ₹84,991 on 30 Jun 26 Category Hybrid - Multi Asset AMC ICICI Prudential Asset Management Company Limited Rating ☆☆ Risk Moderately High Expense Ratio 1.47 Sharpe Ratio 0.01 Information Ratio 0 Alpha Ratio 0 Min Investment 5,000 Min SIP Investment 100 Exit Load 0-1 Years (1%),1 Years and above(NIL) Growth of 10,000 investment over the years.
Date Value 30 Jun 21 ₹10,000 30 Jun 22 ₹11,640 30 Jun 23 ₹14,219 30 Jun 24 ₹18,823 30 Jun 25 ₹21,063 30 Jun 26 ₹22,143 Returns for ICICI Prudential Multi-Asset Fund
absolute basis & more than 1 year are on CAGR (Compound Annual Growth Rate) basis. as on 22 Jul 26 Duration Returns 1 Month 0.7% 3 Month -0.2% 6 Month 0% 1 Year 6.5% 3 Year 15.3% 5 Year 17.5% 10 Year 15 Year Since launch 20.4% Historical performance (Yearly) on absolute basis
Year Returns 2025 18.6% 2024 16.1% 2023 24.1% 2022 16.8% 2021 34.7% 2020 9.9% 2019 7.7% 2018 -2.2% 2017 28.2% 2016 12.5% Fund Manager information for ICICI Prudential Multi-Asset Fund
Name Since Tenure Sankaran Naren 1 Feb 12 14.42 Yr. Manish Banthia 22 Jan 24 2.44 Yr. Akhil Kakkar 22 Jan 24 2.44 Yr. Sri Sharma 30 Apr 21 5.17 Yr. Gaurav Chikane 2 Aug 21 4.91 Yr. Sharmila D'Silva 31 Jul 22 3.92 Yr. Masoomi Jhurmarvala 4 Nov 24 1.65 Yr. Antariksha Banerjee 15 Jun 26 0.04 Yr. Data below for ICICI Prudential Multi-Asset Fund as on 30 Jun 26
Asset Allocation
Asset Class Value Cash 16.68% Equity 61.7% Debt 10.87% Other 10.74% Equity Sector Allocation
Sector Value Financial Services 22.64% Consumer Cyclical 12.36% Industrials 5.86% Consumer Defensive 5.41% Basic Materials 4.65% Technology 4.38% Health Care 3.13% Energy 2.78% Real Estate 2.25% Utility 2.1% Communication Services 2% Debt Sector Allocation
Sector Value Cash Equivalent 14.32% Corporate 7.18% Government 6.05% Credit Quality
Rating Value A 1.13% AA 24.49% AAA 72.52% Top Securities Holdings / Portfolio
Name Holding Value Quantity ICICI Pru Gold ETF
- | -11% ₹9,200 Cr 691,140,357
↑ 19,800,000 HDFC Bank Ltd (Financial Services)
Equity, Since 31 Jan 22 | HDFCBANK6% ₹4,834 Cr 64,922,283
↑ 13,682,715 ICICI Bank Ltd (Financial Services)
Equity, Since 31 May 06 | ICICIBANK3% ₹2,678 Cr 21,315,375 Bajaj Finserv Ltd (Financial Services)
Equity, Since 31 Jan 24 | BAJAJFINSV3% ₹2,236 Cr 12,533,749
↓ -421,423 Axis Bank Ltd (Financial Services)
Equity, Since 31 Dec 20 | AXISBANK2% ₹2,067 Cr 16,068,164
↓ -628,125 Infosys Ltd (Technology)
Equity, Since 31 Oct 19 | INFY2% ₹1,966 Cr 16,935,773
↓ -400,000 InterGlobe Aviation Ltd (Industrials)
Equity, Since 28 Feb 23 | INDIGO2% ₹1,822 Cr 4,135,656
↓ -361,200 ITC Ltd (Consumer Defensive)
Equity, Since 31 Mar 24 | ITC2% ₹1,683 Cr 58,664,918 Reliance Industries Ltd (Energy)
Equity, Since 31 Dec 20 | RELIANCE2% ₹1,587 Cr 12,011,792 Maruti Suzuki India Ltd (Consumer Cyclical)
Equity, Since 31 Aug 21 | MARUTI2% ₹1,506 Cr 1,147,022 5. UTI Multi Asset Fund
UTI Multi Asset Fund
Growth Launch Date 21 Oct 08 NAV (22 Jul 26) ₹78.4242 ↓ -0.26 (-0.33 %) Net Assets (Cr) ₹6,890 on 30 Jun 26 Category Hybrid - Multi Asset AMC UTI Asset Management Company Ltd Rating ☆ Risk Moderately High Expense Ratio 1.79 Sharpe Ratio -0.11 Information Ratio 0 Alpha Ratio 0 Min Investment 5,000 Min SIP Investment 500 Exit Load 0-12 Months (1%),12 Months and above(NIL) Growth of 10,000 investment over the years.
Date Value 30 Jun 21 ₹10,000 30 Jun 22 ₹9,764 30 Jun 23 ₹12,070 30 Jun 24 ₹16,534 30 Jun 25 ₹17,943 30 Jun 26 ₹18,542 Returns for UTI Multi Asset Fund
absolute basis & more than 1 year are on CAGR (Compound Annual Growth Rate) basis. as on 22 Jul 26 Duration Returns 1 Month 0% 3 Month 0.4% 6 Month -1.2% 1 Year 5% 3 Year 15.2% 5 Year 13.2% 10 Year 15 Year Since launch 12.3% Historical performance (Yearly) on absolute basis
Year Returns 2025 11.1% 2024 20.7% 2023 29.1% 2022 4.4% 2021 11.8% 2020 13.1% 2019 3.9% 2018 -0.5% 2017 17.1% 2016 7.3% Fund Manager information for UTI Multi Asset Fund
Name Since Tenure Sharwan Goyal 12 Nov 21 4.63 Yr. Jaydeep Bhowal 1 Oct 24 1.75 Yr. Lokesh Kulthia 19 Jun 26 0.03 Yr. Data below for UTI Multi Asset Fund as on 30 Jun 26
Asset Allocation
Asset Class Value Cash 7.54% Equity 67.52% Debt 11.29% Other 13.65% Equity Sector Allocation
Sector Value Financial Services 19.56% Consumer Defensive 9.96% Industrials 9.32% Technology 8.3% Consumer Cyclical 5.92% Basic Materials 5.19% Real Estate 4.3% Health Care 3.11% Energy 2.25% Communication Services 2.2% Debt Sector Allocation
Sector Value Government 8.36% Corporate 6.45% Cash Equivalent 4.02% Credit Quality
Rating Value AA 5.12% AAA 94.88% Top Securities Holdings / Portfolio
Name Holding Value Quantity UTI Gold ETF
- | -14% ₹955 Cr 73,012,656
↑ 250,000 ICICI Bank Ltd (Financial Services)
Equity, Since 29 Feb 24 | ICICIBANK3% ₹203 Cr 1,616,413
↑ 160,843 Kotak Mahindra Bank Ltd (Financial Services)
Equity, Since 30 Apr 25 | KOTAKBANK3% ₹192 Cr 4,993,006
↑ 1,673,435 ITC Ltd (Consumer Defensive)
Equity, Since 31 Oct 22 | ITC3% ₹187 Cr 6,503,210
↑ 233,088 HDFC Bank Ltd (Financial Services)
Equity, Since 30 Apr 25 | HDFCBANK3% ₹186 Cr 2,497,446
↑ 55,228 Nestle India Ltd (Consumer Defensive)
Equity, Since 29 Feb 24 | NESTLEIND3% ₹185 Cr 1,299,989
↑ 34,136 Tata Consultancy Services Ltd (Technology)
Equity, Since 29 Feb 24 | TCS2% ₹173 Cr 766,007
↑ 33,048 Infosys Ltd (Technology)
Equity, Since 31 Mar 24 | INFY2% ₹130 Cr 1,121,776 Bharat Electronics Ltd (Industrials)
Equity, Since 31 Oct 25 | BEL2% ₹128 Cr 3,118,720
↑ 85,870 Cummins India Ltd (Industrials)
Equity, Since 30 Apr 23 | CUMMINSIND2% ₹123 Cr 208,758 6. ICICI Prudential Equity and Debt Fund
ICICI Prudential Equity and Debt Fund
Growth Launch Date 3 Nov 99 NAV (22 Jul 26) ₹404.56 ↓ -2.66 (-0.65 %) Net Assets (Cr) ₹51,481 on 30 Jun 26 Category Hybrid - Hybrid Equity AMC ICICI Prudential Asset Management Company Limited Rating ☆☆☆☆ Risk Moderately High Expense Ratio 1.6 Sharpe Ratio -0.22 Information Ratio 1.74 Alpha Ratio 2.04 Min Investment 5,000 Min SIP Investment 100 Exit Load 0-1 Years (1%),1 Years and above(NIL) Growth of 10,000 investment over the years.
Date Value 30 Jun 21 ₹10,000 30 Jun 22 ₹11,521 30 Jun 23 ₹13,970 30 Jun 24 ₹19,252 30 Jun 25 ₹21,180 30 Jun 26 ₹21,663 Returns for ICICI Prudential Equity and Debt Fund
absolute basis & more than 1 year are on CAGR (Compound Annual Growth Rate) basis. as on 22 Jul 26 Duration Returns 1 Month 0% 3 Month -0.2% 6 Month 0.8% 1 Year 3.2% 3 Year 14.8% 5 Year 16.4% 10 Year 15 Year Since launch 14.9% Historical performance (Yearly) on absolute basis
Year Returns 2025 13.3% 2024 17.2% 2023 28.2% 2022 11.7% 2021 41.7% 2020 9% 2019 9.3% 2018 -1.9% 2017 24.8% 2016 13.7% Fund Manager information for ICICI Prudential Equity and Debt Fund
Name Since Tenure Sankaran Naren 7 Dec 15 10.57 Yr. Manish Banthia 19 Sep 13 12.79 Yr. Mittul Kalawadia 29 Dec 20 5.51 Yr. Akhil Kakkar 22 Jan 24 2.44 Yr. Sri Sharma 30 Apr 21 5.17 Yr. Sharmila D'Silva 31 Jul 22 3.92 Yr. Nitya Mishra 4 Nov 24 1.65 Yr. Data below for ICICI Prudential Equity and Debt Fund as on 30 Jun 26
Asset Allocation
Asset Class Value Cash 4.92% Equity 76.32% Debt 18.73% Equity Sector Allocation
Sector Value Financial Services 20.37% Consumer Cyclical 10.24% Industrials 7.7% Consumer Defensive 6.77% Energy 6.5% Health Care 5.82% Utility 4.65% Technology 4.17% Basic Materials 3.19% Real Estate 2.76% Communication Services 2.5% Debt Sector Allocation
Sector Value Corporate 12.18% Government 10.22% Cash Equivalent 1.29% Credit Quality
Rating Value A 2.66% AA 23.39% AAA 70.99% Top Securities Holdings / Portfolio
Name Holding Value Quantity HDFC Bank Ltd (Financial Services)
Equity, Since 30 Apr 21 | HDFCBANK6% ₹3,037 Cr 40,783,778
↑ 4,100,000 ICICI Bank Ltd (Financial Services)
Equity, Since 31 Jul 12 | ICICIBANK5% ₹2,439 Cr 19,413,840 Reliance Industries Ltd (Energy)
Equity, Since 30 Jun 22 | RELIANCE5% ₹2,357 Cr 17,839,980 Sun Pharmaceuticals Industries Ltd (Healthcare)
Equity, Since 31 May 16 | SUNPHARMA4% ₹2,083 Cr 11,576,148
↓ -487,900 NTPC Ltd (Utilities)
Equity, Since 28 Feb 17 | NTPC4% ₹2,010 Cr 51,962,814
↓ -2,799,000 Axis Bank Ltd (Financial Services)
Equity, Since 31 Mar 21 | AXISBANK3% ₹1,485 Cr 11,540,676
↑ 300,000 TVS Motor Co Ltd (Consumer Cyclical)
Equity, Since 28 Feb 18 | TVSMOTOR3% ₹1,336 Cr 3,981,427 Avenue Supermarts Ltd (Consumer Defensive)
Equity, Since 31 Jan 23 | DMART3% ₹1,285 Cr 3,168,463 InterGlobe Aviation Ltd (Industrials)
Equity, Since 28 Feb 23 | INDIGO2% ₹1,187 Cr 2,694,191
↑ 73,747 Tata Consultancy Services Ltd (Technology)
Equity, Since 31 Mar 24 | TCS2% ₹938 Cr 4,151,035 7. Bandhan Hybrid Equity Fund
Bandhan Hybrid Equity Fund
Growth Launch Date 30 Dec 16 NAV (22 Jul 26) ₹27.488 ↓ -0.17 (-0.61 %) Net Assets (Cr) ₹2,184 on 30 Jun 26 Category Hybrid - Hybrid Equity AMC IDFC Asset Management Company Limited Rating Risk Moderately High Expense Ratio 2.35 Sharpe Ratio 0.05 Information Ratio 0.71 Alpha Ratio 5.97 Min Investment 5,000 Min SIP Investment 100 Exit Load 0-1 Years (1%),1 Years and above(NIL) Growth of 10,000 investment over the years.
Date Value 30 Jun 21 ₹10,000 30 Jun 22 ₹9,911 30 Jun 23 ₹11,798 30 Jun 24 ₹14,680 30 Jun 25 ₹16,490 30 Jun 26 ₹17,375 Returns for Bandhan Hybrid Equity Fund
absolute basis & more than 1 year are on CAGR (Compound Annual Growth Rate) basis. as on 22 Jul 26 Duration Returns 1 Month 0.3% 3 Month 2.6% 6 Month 4.5% 1 Year 5.4% 3 Year 13.5% 5 Year 11.4% 10 Year 15 Year Since launch 11.2% Historical performance (Yearly) on absolute basis
Year Returns 2025 7.7% 2024 21% 2023 20.4% 2022 -1.1% 2021 30.8% 2020 13.9% 2019 4.7% 2018 -3.8% 2017 16.2% 2016 Fund Manager information for Bandhan Hybrid Equity Fund
Name Since Tenure Harshal Joshi 28 Jul 21 4.93 Yr. Brijesh Shah 10 Jun 24 2.06 Yr. Prateek Poddar 7 Jun 24 2.07 Yr. Ritika Behera 7 Oct 23 2.73 Yr. Gaurav Satra 7 Jun 24 2.07 Yr. Data below for Bandhan Hybrid Equity Fund as on 30 Jun 26
Asset Allocation
Asset Class Value Cash 4.48% Equity 78.25% Debt 17.27% Equity Sector Allocation
Sector Value Financial Services 22.07% Consumer Cyclical 12.02% Technology 7.44% Industrials 7.25% Basic Materials 6.07% Health Care 5.92% Consumer Defensive 4.67% Utility 4.06% Energy 4.01% Communication Services 2.53% Real Estate 1.4% Debt Sector Allocation
Sector Value Corporate 13.32% Government 4.66% Cash Equivalent 3.77% Credit Quality
Rating Value AA 3.2% AAA 96.8% Top Securities Holdings / Portfolio
Name Holding Value Quantity Small Industries Development Bank Of India
Debentures | -7% ₹141 Cr 14,500,000 ICICI Bank Ltd (Financial Services)
Equity, Since 31 Jul 24 | ICICIBANK6% ₹114 Cr 904,699
↑ 49,456 HDFC Bank Ltd (Financial Services)
Equity, Since 30 Jun 24 | HDFCBANK5% ₹93 Cr 1,253,726
↑ 114,404 Reliance Industries Ltd (Energy)
Equity, Since 30 Apr 20 | RELIANCE4% ₹74 Cr 562,469
↑ 42,433 NTPC Ltd (Utilities)
Equity, Since 28 Feb 23 | NTPC4% ₹74 Cr 1,909,614
↑ 69,913 State Bank of India (Financial Services)
Equity, Since 28 Feb 21 | SBIN3% ₹56 Cr 578,627
↑ 49,160 Bajaj Housing Finance Limited
Debentures | -2% ₹49 Cr 5,000,000
↑ 2,500,000 Infosys Ltd (Technology)
Equity, Since 31 Jan 17 | INFY2% ₹48 Cr 413,181
↓ -5,370 JSW Steel Ltd (Basic Materials)
Equity, Since 31 Mar 25 | JSWSTEEL2% ₹43 Cr 334,106
↑ 26,012 Larsen & Toubro Ltd (Industrials)
Equity, Since 31 Jan 17 | LT2% ₹40 Cr 98,379
↑ 1,222
SIP بمقابلہ RD: بہتر RD یا SIP کون سا ہے؟
ریکرنگ ڈپازٹ اور ایس آئی پی کے درمیان فرق
یہاں استعمال ہونے والے عوامل ہیں واپسی کی شرح،لیکویڈیٹیٹیکسیشن، اتار چڑھاؤ، خطرے کے عوامل، وغیرہ۔
| عوامل | اعادی جمع (RD) | سیسٹیمیٹک انویسٹمنٹ پلان (SIP) |
|---|---|---|
| واپسی کی شرح | SIP ریٹرن مارکیٹ سے منسلک ہیں اور فنڈ کی قسم اور فنڈ کی کارکردگی کے لحاظ سے مختلف ہو سکتے ہیں۔ تاہم، طویل مدت کے لیے سرمایہ کاری کرنے پر SIP کا منافع عام طور پر اچھا ہوتا ہے۔ | ایک RD کی واپسی کی شرح اس کی وجہ سے طے ہوتی ہے۔مقررہ شرح سود. لہذا، اس سرمایہ کاری پر مارکیٹ کے اتار چڑھاؤ کا کوئی اثر نہیں ہے۔ |
| سرمایہ کاری اسکیم | آر ڈی اسکیم میں، آپ کو ایک ڈپازٹ پلان میں سرمایہ کاری کرنا ہوگی جو آپ کو منافع کی مقررہ شرح دے گی۔ اگر آپ مزید لچک تلاش کر رہے ہیں تو آپ لچکدار ریکرینگ ڈپازٹ سکیم کا بھی انتخاب کر سکتے ہیں۔ | میوچل فنڈز کے لیے ایس آئی پی میں، آپ اپنی خطرے کی صلاحیت کے لحاظ سے قرض یا ایکویٹی قسم کے فنڈز میں سے انتخاب کر سکتے ہیں۔ |
| سرمایہ کاری کی قسم | ریکرنگ ڈپازٹ اسکیم میں، سرمایہ کار کو ہر ماہ ایک مقررہ رقم جمع کرنی ہوتی ہے۔ | سیسٹیمیٹک انویسٹمنٹ پلان آپ کے پیسے کو میوچل فنڈز پر لگانے کا ایک طریقہ ہے۔ سرمایہ کاری متواتر پر کی جا سکتی ہے۔بنیاد - روزانہ، ہفتہ وار، ماہانہ یا سہ ماہی۔ |
| لیکویڈیٹی | کوSIP منسوخ کریں۔، سرمایہ کار بغیر کسی جرمانہ کے اپنی سرمایہ کاری کو بند کر سکتے ہیں اور اپنی رقم نکال سکتے ہیں۔ | RD کی صورت میں، سرمایہ کاری کی قبل از وقت واپسی یا بندش جرمانہ چارجز کا سبب بنے گی۔ |
| ٹیکس لگانا | ریکرنگ ڈپازٹ کی رقم یا اس پر حاصل ہونے والا سود ٹیکس سے مستثنیٰ نہیں ہے۔ | ایس آئی پی کی سرمایہ کاری اور ریٹرن صرف اس وقت ٹیکس سے مستثنیٰ ہیں جب ایکویٹی لنکڈ سیونگ اسکیم (ای ایل ایس ایس) فنڈز۔ |
| اتار چڑھاؤ | مارکیٹ سے منسلک ہونے کی وجہ سے، ایس آئی پی کی واپسی غیر مستحکم ہوتی ہے اور فنڈ سے دوسرے فنڈ میں مختلف ہو سکتی ہے۔ | RD ریٹرن طے شدہ ہیں اور اس طرح یہ غیر مستحکم سرمایہ کاری نہیں ہے۔ |
| خطرے کا عنصر | RD سرمایہ کاری میں رسک فیکٹر تقریباً کالعدم ہے کیونکہ واپسی طے شدہ ہے۔ یہ سب سے محفوظ سرمایہ کاری میں سے ایک ہے۔ | ایس آئی پی میں خطرہ آر ڈی کے مقابلے میں زیادہ ہے، کیونکہ ایس آئی پی کی واپسی کا انحصار اسٹاک مارکیٹ اوراثاثہ تین ہلاک. |
| سرمایہ کاری کا مقصد | ریکرنگ ڈپازٹس عام طور پر قلیل مدتی بچت کا مقصد پورا کرتے ہیں اور طویل مدتی دولت کی ترقی میں مدد نہیں کرتے۔ | SIPs ہر قسم کے سرمایہ کاری کے اہداف میں مدد کر سکتے ہیں، چاہے وہ مختصر ہو یا طویل مدتی، سرمایہ کاری کی فریکوئنسی، منتخب کردہ فنڈز اور دیگر عوامل پر منحصر ہے۔ |
| قسط کی تعدد | ریکرنگ ڈپازٹ عام طور پر ماہانہ اقساط کے ساتھ آتا ہے۔ | SIPs روزانہ، ہفتہ وار، ماہانہ، سہ ماہی وغیرہ کے لچکدار قسطوں کے منصوبے پیش کرتے ہیں۔ |
تشخیص: SIP بمقابلہ RD کی واپسی۔
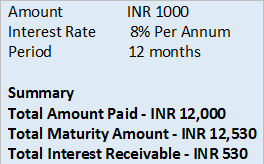
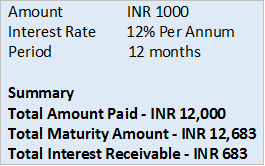
سرمایہ کاری کا بہتر آپشن کون سا ہے- SIP بمقابلہ RD؟ اس سوال کا جواب انفرادی ضروریات کے لحاظ سے مختلف ہو سکتا ہے۔ جیسا کہ آپ جانتے ہیں، SIP ریٹرن متغیر ہوتے ہیں جب کہ RD ریٹرن فکسڈ ہوتے ہیں، آئیے دیکھتے ہیں کہ اگر کوئی INR 1 کی سرمایہ کاری کرتا ہے تو سرمایہ کاری میں کتنا اضافہ ہوتا ہے،000 RD اور SIP دونوں میں 1 سال (12 ماہ) کے لیے۔
آر ڈی ریٹرن کیلکولیٹر
RD سود کی شرح ہر جگہ مختلف ہو سکتی ہے۔بینکلیکن عام طور پر، شرح سود 7% سے 9% p.a تک ہوتی ہے۔ شرح سود کو 8% مانتے ہوئے، آئیے 12 ماہ کے لیے ماہانہ INR 1,000 کی RD سرمایہ کاری میں اضافے کا تجزیہ کریں۔
ایس آئی پی ریٹرن کیلکولیٹر
یہ فرض کرتے ہوئے کہ SIP کی شرح سود 12% ہے، آئیے مانیٹر کریں کہ اگر آپ 1 سال کے لیے ماہانہ INR 1000 کی سرمایہ کاری کرتے ہیں تو آپ کا SIP کس طرح بڑھتا ہے۔کمپاؤنڈنگ کی طاقت.
آخر میں، سرمایہ کاروں کے لیے کچھ حتمی تجاویز یہ ہیں۔
- اگر آپ خطرے سے بچنے والے سرمایہ کار ہیں، تو RD یا ریکرینگ ڈپازٹ ایک بہتر آپشن ہے۔ RD سود کی شرح اور ریٹرن پہلے سے محدود ہیں اور عام طور پر بہت زیادہ نہیں ہوتے ہیں، 7-9% p.a سے مختلف ہو سکتے ہیں۔
- اگر آپ تھوڑا سا خطرہ مول لینا چاہتے ہیں تو طویل مدتی سرمایہ کاری کے لیے SIP بہترین سرمایہ کاری کے اختیارات میں سے ایک ہے۔ تجزیہ کے مطابق، SIPs اچھا منافع پیش کرتے ہیں اور شرح سود عام طور پر زیادہ ہوتی ہے، جو کہ 15% p.a سے زیادہ ہوتی ہے۔ کچھ صورتو میں.
- 5 سال کے لیے سرمایہ کاری کرتے وقت، RD ان سرمایہ کاروں کے لیے ایک محفوظ آپشن ہے جو مقررہ منافع کی تلاش میں ہیں۔
- تاہم، جب کسی خاص کے لیے طویل مدت (5 سال سے زیادہ) کے لیے سرمایہ کاری کرتے ہیں۔مالی مقصد، SIP اچھا منافع پیش کرتا ہے اور رقم کی ترقی بہت زیادہ ہے۔
"ایس آئی پی کے ذریعے ایکویٹی میں سرمایہ کاری ایک درخت لگانے کے مترادف ہے، پھل حاصل کرنے کے لیے صبر کرنا ہوگا۔"
یہاں فراہم کردہ معلومات کے درست ہونے کو یقینی بنانے کے لیے تمام کوششیں کی گئی ہیں۔ تاہم، ڈیٹا کی درستگی کے حوالے سے کوئی ضمانت نہیں دی جاتی ہے۔ براہ کرم کوئی بھی سرمایہ کاری کرنے سے پہلے اسکیم کی معلومات کے دستاویز کے ساتھ تصدیق کریں۔


AMFI Registration No. 112358 | CIN: U74999MH2016PTC282153
Shepard Technologies Pvt. Ltd. (with ARN code 112358) makes no warranties or representations, express or implied, on products offered through the platform. It accepts no liability for any damages or losses, however caused, in connection with the use of, or on the reliance of its product or related services. Terms and conditions of the website are applicable.
©2026 Shepard Technologies Private Limited. All Rights Reserved
Research Highlights for BOI AXA Mid and Small Cap Equity and Debt Fund