ایس آئی پی میں رسک: ایس آئی پی انویسٹمنٹ میں رسک کا اندازہ
میں خطرہگھونٹ مختلف کے لیے مختلف ہوتی ہے۔میوچل فنڈز کی اقسام.میوچل فنڈز میں سرمایہ کاری ایس آئی پی کے ذریعے (سیسٹیمیٹکسرمایہ کاری کا منصوبہ) شامل ہے۔مارکیٹ منسلک خطرات، جو یقینی طور پر زیادہ ہیں۔ایکویٹی فنڈز قرض سے زیادہ اور متوازنباہمی چندہ. ایس آئی پی میں خطرہ سرمایہ کاری کے آپشن پر منحصر ہوتا ہے جسے غور کرتے ہوئے منتخب کیا جاتا ہے۔رسک پروفائل، خطرے کی بھوک اورلیکویڈیٹی. تاہم، SIP میں خطرے کو فنڈ مینیجرز اور فنڈ ہاؤس کے ذریعے منظم اور کم کیا جا سکتا ہے۔
SIP میں خطرے کا حساب لگانے کے لیے مختلف ٹولز دستیاب ہیں جیسےگھونٹ کیلکولیٹر (ایس آئی پی ریٹرن کیلکولیٹر کے نام سے بھی جانا جاتا ہے)۔
ایس آئی پی میں خطرہ: ایس آئی پی کے خطرات کا اندازہ
خطرہ 1: SIP کا منفی ریٹرن یا قیمت کا خطرہ
میوچل فنڈ کی سرمایہ کاری مارکیٹ کے خطرات سے مشروط ہوتی ہے، یہ عام طور پر سنی جانے والی اصطلاح ہے۔ اس کا مطلب یہ ہے کہ SIP میں آپ کی سرمایہ کاری کم ہو سکتی ہے اور مارکیٹ کے برتاؤ کے لحاظ سے آپ کی سرمایہ کاری سے کم قیمت ہو سکتی ہے۔
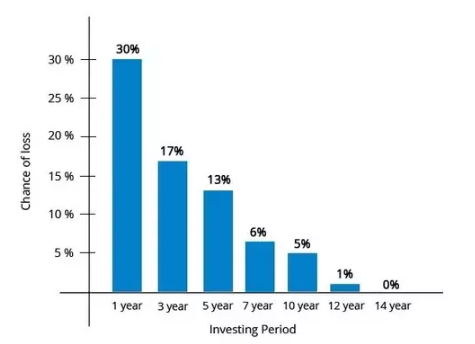
تاہم ایس آئی پی میں خطرہ انعقاد کی مدت سے متعلق ہے اور عام طور پر، انعقاد کی مدت جتنی لمبی ہوگی، خطرہ اتنا ہی کم ہوگا۔ زیادہ انعقاد کی مدت کے ساتھ منافع کمانے کا امکان بڑھ جاتا ہے۔ مثلاً ایکویٹی کے لیے ذیل میں ایک نظر ڈالیں، ایکویٹی کے لیے طویل انعقاد کی مدت کے نتیجے میں نقصان کا امکان کم ہوتا ہے۔ (ذیل میں 1979 سے 2016 تک بی ایس ای سینسیکس پر کیا گیا تجزیہ ہے)۔
خطرہ 2: آپ کے پیسے کو جلدی واپس حاصل کرنے کا خطرہ یا لیکویڈیٹی کا خطرہ
آپ کے پیسے کو جلدی سے واپس حاصل کرنے کی صلاحیت اس پر منحصر ہے۔زیرِ نظر سرمایہ کاری عام طور پر میوچل فنڈز کے ساتھ، یہ کوئی مسئلہ نہیں ہے، تاہم، ایسے ادوار آئے ہیں (جیسے 2008 میں)، جب سیکیورٹیز کی فروخت میں کوئی مسئلہ تھا(بانڈز) اور یہ کہ بعض میوچل فنڈز کو کچھ اسکیموں سے نکلوانے کو محدود کرنا پڑتا تھا۔ ایکویٹی مارکیٹ کافی مائع ہے (مطلب کہ خرید و فروخت میں کوئی مسئلہ نہیں ہے)۔ تاہم، اگر فروخت کی مقدار خریداروں کی تعداد سے بڑی رقم سے تجاوز کر جاتی ہے، تو اس کے نتیجے میں ایک مسئلہ پیدا ہو جائے گا، اس لیے بعد میں ادائیگیوں کو ایک مسئلہ بنا دیا جائے گا اور اس وجہ سے لیکویڈیٹی کا خطرہ ہے۔
رسک 3: سیکیورٹی یا کریڈٹ رسک کے نیچے گرنے کا خطرہ
جب کسی خاص کمپنی/اینٹی کے بانڈ کو کریڈٹ ریٹنگ ایجنسی کی طرف سے کمی کی جاتی ہے، تو اس کی قیمت گر جاتی ہے۔ اگر قیمت گرتی ہے تو اس سے پورٹ فولیو کی مجموعی قدر متاثر ہوتی ہے۔ اسے کریڈٹ رسک کہتے ہیں۔
Talk to our investment specialist
خطرہ 4: کمپنی کا بانڈ کے مالکان کو ان کا واجب یا طے شدہ خطرہ ادا نہ کرنے کا خطرہ
جب کوئی کمپنی بانڈ ہولڈرز کو اپنی ادائیگیوں میں ڈیفالٹ کرتی ہے، تو اسے کہا جاتا ہے۔پہلے سے موجود خطرہ.
کے ساتہسرمایہ کار ان کے پیسے واپس نہ ملنا، اس سے ان کے پورٹ فولیو پر منفی اثر پڑے گا۔
خطرہ 5: آپ کے لین دین کو درست طریقے سے پروسیس کرنے کا خطرہ یا ٹیکنالوجی کا خطرہ
آج تمام لین دین الیکٹرانک موڈ میں ہوتے ہیں۔ مختلف ٹچ پوائنٹس کے ساتھ، مختلف جگہوں پر، آر اینڈ ٹی ایجنٹ میں تکنیکی خرابی کا امکان ہے،بینک ڈیبٹ فنڈز وغیرہ
لین دین کی عدم پروسیسنگ بھی SIP میں ایک خطرہ ہے۔
خطرہ 6: پورٹ فولیو مینیجر کے ذریعہ اسکیم کی کارکردگی کا خطرہ یا فنڈ مینجمنٹ کا خطرہ
SIP میں ایک اور خطرہ یہ ہے کہ منتخب کردہ اسکیم توقعات کے مطابق نہیں ہوسکتی ہے، اور کارکردگی توقع سے بہت کم ہوسکتی ہے۔ فنڈ مینیجر کارکردگی پر کم ڈیلیور کر سکتا ہے، اور یہ اس پر کم منافع کا باعث بنے گا۔SIP سرمایہ کاری.
یہ ایک SIP میں بڑے خطرات ہیں، جبکہ ہم آگے بڑھ سکتے ہیں اور SIP میں مزید خطرات کی وضاحت کر سکتے ہیں جیسےمعیشت خطرہ وغیرہ، ان میں سے زیادہ تر خطرات مندرجہ بالا زمروں میں سے ایک یا زیادہ کے تحت آتے ہیں۔
اگرچہ SIP میں یقینی طور پر خطرہ ہے، لیکن کسی کو ہمیشہ یاد رکھنا چاہیے کہ SIP یا یکمشت، یہ صرف ایک سرمایہ کاری کا راستہ ہے نہ کہ بنیادی سرمایہ کاری۔ کسی کو بنیادی سرمایہ کاری، اس کے خطرات کو دیکھنے اور پھر حتمی فیصلہ کرنے کی ضرورت ہے۔
*نیچے درج ذیل کی فہرست ہے۔ٹاپ ایس آئی پیمیں سرمایہ کاری کرنے کا اندازہ لگا سکتا ہے۔ "The primary investment objective of the Scheme is to seek capital appreciation by investing predominantly in units of MLIIF - WGF. The Scheme may, at the discretion of the Investment Manager, also invest in the units of other similar overseas mutual fund schemes, which may constitute a significant part of its corpus. The Scheme may also invest a certain portion of its corpus in money market securities and/or units of money market/liquid schemes of DSP Merrill Lynch Mutual Fund, in order to meet liquidity requirements from time to time. However, there is no assurance that the investment objective of the Scheme will be realized." Below is the key information for DSP World Gold Fund Returns up to 1 year are on The primary investment objective of the Scheme is to seek capital appreciation by investing predominantly in units of BGF – USFEF. The Scheme may, at the discretion of the Investment Manager also invest in the units of other similar overseas mutual fund schemes, which may constitute a significant part of its corpus. The Scheme may also invest a certain portion of its corpus in money market securities and/or money market/liquid schemes of DSP BlackRock Mutual Fund, in order to meet liquidity requirements from time to time. However, there is no assurance that the investment objective of the Scheme will be realized. It shall be noted ‘similar overseas mutual fund schemes’ shall have investment objective, investment strategy and risk profile/consideration similar to those of BGF – USFEF. Research Highlights for DSP US Flexible Equity Fund Below is the key information for DSP US Flexible Equity Fund Returns up to 1 year are on The investment objective of the scheme is to provide long term growth from a portfolio of equity / equity related instruments of companies engaged either directly or indirectly in the infrastructure sector. Research Highlights for LIC MF Infrastructure Fund Below is the key information for LIC MF Infrastructure Fund Returns up to 1 year are on The Scheme seeks to provide long term capital appreciation by investing in a portfolio that is predominantly constituted of equity and equity related instruments of mid cap companies. However, there can be no assurance that the funds objectives will be achieved. Research Highlights for Invesco India Mid Cap Fund Below is the key information for Invesco India Mid Cap Fund Returns up to 1 year are on (Erstwhile UTI Pharma & Healthcare Fund) The Investment objective of the Scheme is capital appreciation through investments in equities and equity related instruments of the Pharma & Healthcare sectors. Research Highlights for UTI Healthcare Fund Below is the key information for UTI Healthcare Fund Returns up to 1 year are on 1. DSP World Gold Fund
DSP World Gold Fund
Growth Launch Date 14 Sep 07 NAV (30 Jul 26) ₹50.4247 ↑ 1.63 (3.33 %) Net Assets (Cr) ₹1,433 on 30 Jun 26 Category Equity - Global AMC DSP BlackRock Invmt Managers Pvt. Ltd. Rating ☆☆☆ Risk High Expense Ratio 1.41 Sharpe Ratio 1.22 Information Ratio -0.5 Alpha Ratio 2.12 Min Investment 1,000 Min SIP Investment 500 Exit Load 0-12 Months (1%),12 Months and above(NIL) Growth of 10,000 investment over the years.
Date Value 31 Jul 21 ₹10,000 31 Jul 22 ₹7,373 31 Jul 23 ₹9,366 31 Jul 24 ₹11,150 31 Jul 25 ₹16,504 31 Jul 26 ₹26,355 Returns for DSP World Gold Fund
absolute basis & more than 1 year are on CAGR (Compound Annual Growth Rate) basis. as on 30 Jul 26 Duration Returns 1 Month 2.3% 3 Month -12.7% 6 Month -17.8% 1 Year 62.8% 3 Year 43.6% 5 Year 22.1% 10 Year 15 Year Since launch 8.9% Historical performance (Yearly) on absolute basis
Year Returns 2025 167.1% 2024 15.9% 2023 7% 2022 -7.7% 2021 -9% 2020 31.4% 2019 35.1% 2018 -10.7% 2017 -4% 2016 52.7% Fund Manager information for DSP World Gold Fund
Name Since Tenure Kaivalya Nadkarni 1 May 25 1.17 Yr. Data below for DSP World Gold Fund as on 30 Jun 26
Equity Sector Allocation
Sector Value Basic Materials 94.47% Asset Allocation
Asset Class Value Cash 3.62% Equity 94.47% Debt 0% Other 1.91% Top Securities Holdings / Portfolio
Name Holding Value Quantity BGF World Gold I2
Investment Fund | -68% ₹1,141 Cr 1,005,044 VanEck Gold Miners ETF
- | GDX29% ₹490 Cr 573,719 Treps / Reverse Repo Investments
CBLO/Reverse Repo | -3% ₹54 Cr Net Receivables/Payables
Net Current Assets | -0% -₹6 Cr 2. DSP US Flexible Equity Fund
DSP US Flexible Equity Fund
Growth Launch Date 3 Aug 12 NAV (30 Jul 26) ₹90.0193 ↑ 0.77 (0.86 %) Net Assets (Cr) ₹1,291 on 30 Jun 26 Category Equity - Global AMC DSP BlackRock Invmt Managers Pvt. Ltd. Rating ☆☆☆☆☆ Risk High Expense Ratio 1.55 Sharpe Ratio 1.93 Information Ratio 0.15 Alpha Ratio -4.1 Min Investment 1,000 Min SIP Investment 500 Exit Load 0-12 Months (1%),12 Months and above(NIL) Growth of 10,000 investment over the years.
Date Value 31 Jul 21 ₹10,000 31 Jul 22 ₹10,023 31 Jul 23 ₹11,458 31 Jul 24 ₹13,332 31 Jul 25 ₹16,454 31 Jul 26 ₹22,370 Returns for DSP US Flexible Equity Fund
absolute basis & more than 1 year are on CAGR (Compound Annual Growth Rate) basis. as on 30 Jul 26 Duration Returns 1 Month -4.1% 3 Month 1.5% 6 Month 11.7% 1 Year 36.9% 3 Year 24.6% 5 Year 17.2% 10 Year 15 Year Since launch 17% Historical performance (Yearly) on absolute basis
Year Returns 2025 33.8% 2024 17.8% 2023 22% 2022 -5.9% 2021 24.2% 2020 22.6% 2019 27.5% 2018 -1.1% 2017 15.5% 2016 9.8% Fund Manager information for DSP US Flexible Equity Fund
Name Since Tenure Kaivalya Nadkarni 1 May 25 1.17 Yr. Data below for DSP US Flexible Equity Fund as on 30 Jun 26
Equity Sector Allocation
Sector Value Technology 33.05% Industrials 13.62% Financial Services 12.17% Communication Services 12.05% Consumer Cyclical 9.62% Health Care 7.65% Basic Materials 2.45% Energy 2.43% Asset Allocation
Asset Class Value Cash 6.96% Equity 93.02% Debt 0.01% Top Securities Holdings / Portfolio
Name Holding Value Quantity BGF US Flexible Equity I2
Investment Fund | -96% ₹1,265 Cr 1,784,131
↓ -32,921 Treps / Reverse Repo Investments
CBLO/Reverse Repo | -4% ₹59 Cr Net Receivables/Payables
Net Current Assets | -0% -₹2 Cr 3. LIC MF Infrastructure Fund
LIC MF Infrastructure Fund
Growth Launch Date 29 Feb 08 NAV (31 Jul 26) ₹54.5662 ↑ 0.75 (1.39 %) Net Assets (Cr) ₹1,137 on 30 Jun 26 Category Equity - Sectoral AMC LIC Mutual Fund Asset Mgmt Co Ltd Rating Risk High Expense Ratio 2.21 Sharpe Ratio 0.22 Information Ratio 0.58 Alpha Ratio 8.41 Min Investment 5,000 Min SIP Investment 1,000 Exit Load 0-1 Years (1%),1 Years and above(NIL) Growth of 10,000 investment over the years.
Date Value 31 Jul 21 ₹10,000 31 Jul 22 ₹11,519 31 Jul 23 ₹14,236 31 Jul 24 ₹26,350 31 Jul 25 ₹25,021 31 Jul 26 ₹27,470 Returns for LIC MF Infrastructure Fund
absolute basis & more than 1 year are on CAGR (Compound Annual Growth Rate) basis. as on 30 Jul 26 Duration Returns 1 Month -0.9% 3 Month 5.3% 6 Month 14.5% 1 Year 9.8% 3 Year 24.5% 5 Year 22.4% 10 Year 15 Year Since launch 9.7% Historical performance (Yearly) on absolute basis
Year Returns 2025 -3.7% 2024 47.8% 2023 44.4% 2022 7.9% 2021 46.6% 2020 -0.1% 2019 13.3% 2018 -14.6% 2017 42.2% 2016 -2.2% Fund Manager information for LIC MF Infrastructure Fund
Name Since Tenure Sumit Bhatnagar 7 Apr 26 0.23 Yr. Mahesh Bendre 1 Jul 24 2 Yr. Data below for LIC MF Infrastructure Fund as on 30 Jun 26
Equity Sector Allocation
Sector Value Industrials 37.05% Consumer Cyclical 20.88% Basic Materials 12.42% Utility 11.88% Communication Services 5.02% Financial Services 3.98% Real Estate 1.97% Health Care 1.89% Technology 1.08% Asset Allocation
Asset Class Value Cash 3.82% Equity 96.18% Top Securities Holdings / Portfolio
Name Holding Value Quantity Larsen & Toubro Ltd (Industrials)
Equity, Since 30 Apr 09 | LT4% ₹44 Cr 106,968
↓ -10,884 Garware Hi-Tech Films Ltd (Basic Materials)
Equity, Since 31 Aug 23 | 5006554% ₹40 Cr 65,325
↓ -7,684 Tata Motors Passenger Vehicles Ltd (Consumer Cyclical)
Equity, Since 28 Feb 26 | TMPV4% ₹39 Cr 982,891
↓ -332,760 Tata Motors Ltd (Consumer Cyclical)
Equity, Since 31 Oct 25 | TMCV4% ₹39 Cr 1,015,933
↑ 26,983 Tata Power Co Ltd (Utilities)
Equity, Since 29 Feb 24 | TATAPOWER3% ₹36 Cr 861,040
↑ 524,312 KSH International Ltd (Industrials)
Equity, Since 31 Dec 25 | KSHINTL3% ₹34 Cr 432,816
↑ 6,280 Siemens Energy India Ltd (Utilities)
Equity, Since 31 Aug 25 | ENRIN3% ₹34 Cr 87,106
↑ 24,800 JSW Infrastructure Ltd (Industrials)
Equity, Since 30 Apr 26 | JSWINFRA3% ₹31 Cr 1,133,858
↑ 745,681 Carraro India Ltd (Consumer Cyclical)
Equity, Since 31 Dec 24 | CARRARO3% ₹31 Cr 572,991 Bharat Dynamics Ltd Ordinary Shares (Industrials)
Equity, Since 31 Jan 26 | BDL3% ₹29 Cr 242,954
↑ 157,744 4. Invesco India Mid Cap Fund
Invesco India Mid Cap Fund
Growth Launch Date 19 Apr 07 NAV (31 Jul 26) ₹197.72 ↑ 0.24 (0.12 %) Net Assets (Cr) ₹13,767 on 30 Jun 26 Category Equity - Mid Cap AMC Invesco Asset Management (India) Private Ltd Rating ☆☆ Risk Moderately High Expense Ratio 1.82 Sharpe Ratio 0.19 Information Ratio 0 Alpha Ratio 0 Min Investment 5,000 Min SIP Investment 500 Exit Load 0-1 Years (1%),1 Years and above(NIL) Growth of 10,000 investment over the years.
Date Value 31 Jul 21 ₹10,000 31 Jul 22 ₹10,219 31 Jul 23 ₹12,600 31 Jul 24 ₹19,551 31 Jul 25 ₹21,829 31 Jul 26 ₹24,059 Returns for Invesco India Mid Cap Fund
absolute basis & more than 1 year are on CAGR (Compound Annual Growth Rate) basis. as on 30 Jul 26 Duration Returns 1 Month 1.3% 3 Month 10.5% 6 Month 14.9% 1 Year 10.2% 3 Year 24.1% 5 Year 19.2% 10 Year 15 Year Since launch 16.7% Historical performance (Yearly) on absolute basis
Year Returns 2025 6.3% 2024 43.1% 2023 34.1% 2022 0.5% 2021 43.1% 2020 24.4% 2019 3.8% 2018 -5.3% 2017 44.3% 2016 1.1% Fund Manager information for Invesco India Mid Cap Fund
Name Since Tenure Aditya Khemani 9 Nov 23 2.64 Yr. Data below for Invesco India Mid Cap Fund as on 30 Jun 26
Equity Sector Allocation
Sector Value Financial Services 30.63% Health Care 18.1% Consumer Cyclical 16.29% Industrials 15.05% Real Estate 8.55% Technology 4.13% Basic Materials 3.85% Utility 1.93% Asset Allocation
Asset Class Value Cash 1.46% Equity 98.54% Top Securities Holdings / Portfolio
Name Holding Value Quantity BSE Ltd (Financial Services)
Equity, Since 31 Dec 23 | BSE6% ₹750 Cr 1,809,521
↓ -89,716 Prestige Estates Projects Ltd (Real Estate)
Equity, Since 30 Nov 23 | PRESTIGE6% ₹725 Cr 5,296,606
↑ 150,291 The Federal Bank Ltd (Financial Services)
Equity, Since 31 Oct 22 | FEDERALBNK5% ₹644 Cr 22,304,132 AU Small Finance Bank Ltd (Financial Services)
Equity, Since 31 Jul 25 | AUBANK5% ₹585 Cr 5,936,790 Eternal Ltd (Consumer Cyclical)
Equity, Since 31 Aug 25 | ETERNAL4% ₹555 Cr 22,166,702
↑ 799,446 Global Health Ltd (Healthcare)
Equity, Since 30 Nov 23 | MEDANTA4% ₹544 Cr 4,577,395 InterGlobe Aviation Ltd (Industrials)
Equity, Since 30 Apr 24 | INDIGO4% ₹523 Cr 1,186,438
↑ 53,285 Max Healthcare Institute Ltd Ordinary Shares (Healthcare)
Equity, Since 31 Dec 22 | MAXHEALTH4% ₹506 Cr 5,241,044 L&T Finance Ltd (Financial Services)
Equity, Since 31 Dec 23 | LTF4% ₹483 Cr 16,854,973 IndusInd Bank Ltd (Financial Services)
Equity, Since 31 Jan 26 | INDUSINDBK4% ₹472 Cr 5,164,015 5. UTI Healthcare Fund
UTI Healthcare Fund
Growth Launch Date 28 Jun 99 NAV (31 Jul 26) ₹334.51 ↑ 0.45 (0.14 %) Net Assets (Cr) ₹1,308 on 30 Jun 26 Category Equity - Sectoral AMC UTI Asset Management Company Ltd Rating ☆ Risk High Expense Ratio 2.26 Sharpe Ratio 0.58 Information Ratio 0.2 Alpha Ratio 2.15 Min Investment 5,000 Min SIP Investment 500 Exit Load 0-1 Years (1%),1 Years and above(NIL) Growth of 10,000 investment over the years.
Date Value 31 Jul 21 ₹10,000 31 Jul 22 ₹8,749 31 Jul 23 ₹10,615 31 Jul 24 ₹15,542 31 Jul 25 ₹17,610 31 Jul 26 ₹19,855 Returns for UTI Healthcare Fund
absolute basis & more than 1 year are on CAGR (Compound Annual Growth Rate) basis. as on 30 Jul 26 Duration Returns 1 Month 2.6% 3 Month 14.3% 6 Month 22.9% 1 Year 12.7% 3 Year 23.2% 5 Year 14.7% 10 Year 15 Year Since launch 15% Historical performance (Yearly) on absolute basis
Year Returns 2025 -3.1% 2024 42.9% 2023 38.2% 2022 -12.3% 2021 19.1% 2020 67.4% 2019 1.2% 2018 -7.5% 2017 6.2% 2016 -9.7% Fund Manager information for UTI Healthcare Fund
Name Since Tenure Kamal Gada 2 May 22 4.17 Yr. Data below for UTI Healthcare Fund as on 30 Jun 26
Equity Sector Allocation
Sector Value Health Care 94.45% Asset Allocation
Asset Class Value Cash 5.55% Equity 94.45% Top Securities Holdings / Portfolio
Name Holding Value Quantity Sun Pharmaceuticals Industries Ltd (Healthcare)
Equity, Since 31 Oct 06 | SUNPHARMA9% ₹108 Cr 600,000 Divi's Laboratories Ltd (Healthcare)
Equity, Since 30 Sep 17 | DIVISLAB5% ₹59 Cr 88,814
↑ 28,076 Ajanta Pharma Ltd (Healthcare)
Equity, Since 31 Jul 17 | AJANTPHARM5% ₹57 Cr 195,295
↓ -41,216 Gland Pharma Ltd (Healthcare)
Equity, Since 30 Nov 20 | GLAND4% ₹48 Cr 215,251 Lupin Ltd (Healthcare)
Equity, Since 28 Feb 25 | LUPIN4% ₹46 Cr 203,834
↓ -6,166 Apollo Hospitals Enterprise Ltd (Healthcare)
Equity, Since 30 Apr 21 | APOLLOHOSP4% ₹43 Cr 53,000 Dr Reddy's Laboratories Ltd (Healthcare)
Equity, Since 28 Feb 18 | DRREDDY3% ₹38 Cr 290,000 Caplin Point Laboratories Ltd (Healthcare)
Equity, Since 31 Dec 23 | CAPLIPOINT3% ₹37 Cr 185,000
↑ 39,847 Alkem Laboratories Ltd (Healthcare)
Equity, Since 31 May 21 | ALKEM3% ₹37 Cr 68,000 Fortis Healthcare Ltd (Healthcare)
Equity, Since 31 Dec 20 | FORTIS3% ₹37 Cr 400,000
یہاں فراہم کردہ معلومات کے درست ہونے کو یقینی بنانے کے لیے تمام کوششیں کی گئی ہیں۔ تاہم، ڈیٹا کی درستگی کے حوالے سے کوئی ضمانت نہیں دی جاتی ہے۔ براہ کرم کوئی بھی سرمایہ کاری کرنے سے پہلے اسکیم کی معلومات کے دستاویز کے ساتھ تصدیق کریں۔


AMFI Registration No. 112358 | CIN: U74999MH2016PTC282153
Shepard Technologies Pvt. Ltd. (with ARN code 112358) makes no warranties or representations, express or implied, on products offered through the platform. It accepts no liability for any damages or losses, however caused, in connection with the use of, or on the reliance of its product or related services. Terms and conditions of the website are applicable.
©2026 Shepard Technologies Private Limited. All Rights Reserved
Research Highlights for DSP World Gold Fund