Table of Contents
FD Vs Debt Mutual Fund
FD vs Debt fund? Thinking where to invest your savings to earn good returns. Generally, people consider Investing in fixed deposit or FD to be the most convenient option as it is safe and offers fixed returns. But is it the best way? Though Fixed Deposit is an easy investment option for all, however, the returns of fixed deposits being taxable are much less as compared to a Debt Fund. Moreover, when held for a longer duration, Debt Mutual Funds offer good returns. Before making a final decision to invest in debt mutual funds or fixed deposits, go through the detailed comparison of these investments.
In summary:
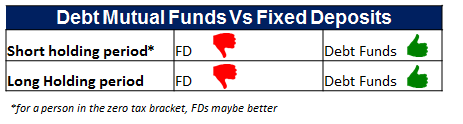
Debt Mutual Funds (Debt Fund) Vs Fixed Deposits (FD)
We would need to break this up by the ability to take a risk and the intended holding period of the investor in question.
Short Holding Period (1 Year or Less)
Here the options for debt fund would be limited to Liquid Funds, ultra-short term funds and short-term Income funds. While the returns or yields normally would go higher from liquid to ultra-short to Short term fund, the yield differential between these debt funds and a Fixed Deposit can be determined considering their returns in last one year.
Debt Mutual Fund (Category Average Return)
| Type Of Debt Mutual Fund | Last 1 yr. Return (%) |
|---|---|
| Liquid Fund | 7.36 |
| Ultra Short-term Debt Funds | 9.18 |
| Short-term Debt Funds | 9.78 |
| Dynamic Debt Funds | 13.89 |
| Long-term Debt Funds | 13.19 |
| Gilt Short-term Funds | 11.76 |
| Gilt Long-term Funds | 15.06 |
| Data as of 20th Feb 2017 |
Fixed Deposit or FD Average Return Rate
The Average Return rate of Fixed Deposits ranged from 8-8.5% p.a. in the year 2016 (so one can compare the above returns in the table). However, in the past one year, the return rate has dropped to 6.6-7.5% p.a.
With the above illustration, it is clear that the average rate of return of Debt Funds is better than that of Fixed Deposits.
Talk to our investment specialist
Long-Term Holding Period
With a long intended holding period, debt funds may prove to be better than FDs.
The options to invest here would be:
- Long term income funds
- Long-term gilt,
- Corporate bond funds (high yield funds), in addition to the options mentioned above the liquid, ultra-short and short term funds may also be used.
Given that the holding period could be 3 years or more, we can say the following:
- With Capital gains tax at 20% with indexation benefits, the net tax incidence would be minimal ( however one should calculate the tax incidence given the year of incurring tax)
- Long term income funds/Gilt Funds with high yields and additionally, if interest rates move down would give very higher returns.
- One could end up with high double digit returns with these debt funds.
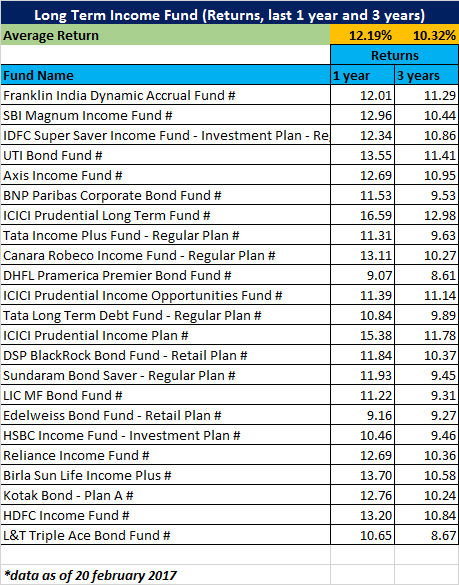
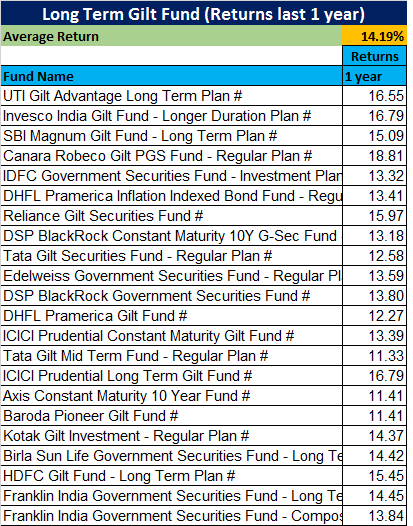
Take the example below of returns on long-term income funds, the average last 1-year return for the category is 12.19% and last 3 years is 10.32% p.a. No FD could have given a similar return in the period. Gilt Fund returns are even higher. In the same period, last year FD rates would have been close to 8-8.5% per annum across most banks, (albeit today the rates have dropped further to 6.5 - 7.5%)
So with an investor having a long intended holding period and interest rates falling, a debt fund (Long term income or Gilt) would give much better returns than an FD. Even in the case of interest rates not falling, high yield corporate bond funds would beat FDs in the same period.
Taxation on Debt Mutual Funds and Fixed Deposits
Taxation also plays an important role in determining the returns of the debt funds and fixed deposits. Typically, taxation on Fixed Deposits is 33% (marginal rate of tax) while on Debt Funds if one invests with a less than 3-year view then incurring dividend distribution tax would be a better option given that DDT (Dividend Distribution Tax) is deducted at approximately 25% (+surcharge etc). This shows that taxation on debt mutual funds is relatively lower than that in fixed deposits.
The additional benefits that come with debt funds are:
- liquidity: money available within 1–2 days from Redemption
- Professional management: ability to dynamically change strategy and take advantage of markets
- No premature withdrawal penalty.
To sum up:
| Parameters | Mutual Funds | Fixed Deposits |
|---|---|---|
| Rate of Returns | No Assured Returns | Fixed Returns |
| Inflation Adjusted Returns | Potential of High Inflation Adjusted Returns | Usually Low Inflation Adjusted Returns |
| Risk | Low to High Risk (Depends of Fund | Low Risk |
| Liquidity | Liquid | Liquid |
| Premature Withdrawal | Allowed with Exit Load/No Load | Allowed with Penalty |
| Cost of Investment | Management Cost/Expense Ratio | No Cost |
Top 8 Best Performing Debt Funds 2024
Below is the list of Debt funds having Net Assets/AUM above 1000 Crore and sorted on 3 Year compounded (CAGR) returns.
The primary investment objective of the Scheme is to generate regular income through investments in debt & money market instruments in order to make regular dividend payments to unit holders & secondary objective is growth of capital. Aditya Birla Sun Life Medium Term Plan is a Debt - Medium term Bond fund was launched on 25 Mar 09. It is a fund with Moderate risk and has given a Below is the key information for Aditya Birla Sun Life Medium Term Plan Returns up to 1 year are on (Erstwhile Reliance Regular Savings Fund - Debt Plan) The primary investment objective of this option is to generate optimal returns consistent with moderate level of risk. This income may be complemented by capital appreciation of the portfolio. Accordingly investments shall predominantly be made in Debt & Money Market Instruments. Nippon India Credit Risk Fund is a Debt - Credit Risk fund was launched on 8 Jun 05. It is a fund with Moderate risk and has given a Below is the key information for Nippon India Credit Risk Fund Returns up to 1 year are on The scheme will endeavour to generate an attractive return for its investors consistent with capital preservation and liquidity by investing in a portfolio of quality debt securities, money market instruments and structured obligations. UTI Treasury Advantage Fund is a Debt - Low Duration fund was launched on 23 Apr 07. It is a fund with Moderately Low risk and has given a Below is the key information for UTI Treasury Advantage Fund Returns up to 1 year are on To generate steady and reasonable income with low risk and high level of liquidity from a portfolio of money market securities and high quality debt. UTI Short Term Income Fund is a Debt - Short term Bond fund was launched on 19 Sep 07. It is a fund with Moderate risk and has given a Below is the key information for UTI Short Term Income Fund Returns up to 1 year are on (Erstwhile Reliance Liquid Fund - Cash Plan) The investment objective of the Scheme is to generate optimal returns consistent with moderate levels of risk and high liquidity. Accordingly, investments shall predominantly be made in Debt and Money Market Instruments. Nippon India Ultra Short Duration Fund is a Debt - Ultrashort Bond fund was launched on 7 Dec 01. It is a fund with Low risk and has given a Below is the key information for Nippon India Ultra Short Duration Fund Returns up to 1 year are on The fund’s objective is to provide reasonable returns, by maintaining an optimum balance of safety, liquidity and yield, through investments in a basket of debt and money market instruments with a view to delivering consistent performance. However, there can be no assurance that the investment objective of the Scheme will be realized. ICICI Prudential Regular Savings Fund is a Debt - Credit Risk fund was launched on 3 Dec 10. It is a fund with Moderate risk and has given a Below is the key information for ICICI Prudential Regular Savings Fund Returns up to 1 year are on (Erstwhile SBI Corporate Bond Fund) The investment objective will be to actively manage a portfolio of good
quality corporate debt as well as Money Market Instruments so as to provide
reasonable returns and liquidity to the Unit holders. However there is no
guarantee or assurance that the investment objective of the scheme will
be achieved. SBI Credit Risk Fund is a Debt - Credit Risk fund was launched on 19 Jul 04. It is a fund with Moderate risk and has given a Below is the key information for SBI Credit Risk Fund Returns up to 1 year are on (Erstwhile UTI - Floating Rate Fund - Short Term Plan) To generate regular income through investment in a portfolio comprising substantially of floating rate debt / money market instruments, fixed rate debt / money market instruments swapped for floating rate returns. The Scheme may also invest a portion of its net assets in fixed rate debt securities and money market instruments .However there can be no assurance that the investment objective of the Scheme will be achieved. The Scheme does not guarantee / indicate any returns. UTI Ultra Short Term Fund is a Debt - Ultrashort Bond fund was launched on 29 Aug 03. It is a fund with Moderately Low risk and has given a Below is the key information for UTI Ultra Short Term Fund Returns up to 1 year are on 1. Aditya Birla Sun Life Medium Term Plan
CAGR/Annualized return of 8.5% since its launch. Ranked 6 in Medium term Bond category. Return for 2023 was 6.9% , 2022 was 24.8% and 2021 was 7.1% . Aditya Birla Sun Life Medium Term Plan
Growth Launch Date 25 Mar 09 NAV (25 Apr 24) ₹34.346 ↓ -0.01 (-0.02 %) Net Assets (Cr) ₹1,863 on 31 Mar 24 Category Debt - Medium term Bond AMC Birla Sun Life Asset Management Co Ltd Rating ☆☆☆☆ Risk Moderate Expense Ratio 1.52 Sharpe Ratio 0.3 Information Ratio 0 Alpha Ratio 0 Min Investment 1,000 Min SIP Investment 1,000 Exit Load 0-365 Days (1%),365 Days and above(NIL) Yield to Maturity 8.07% Effective Maturity 6 Years 2 Months 26 Days Modified Duration 3 Years 9 Months 14 Days Growth of 10,000 investment over the years.
Date Value 31 Mar 19 ₹10,000 31 Mar 20 ₹9,642 31 Mar 21 ₹10,594 31 Mar 22 ₹11,595 31 Mar 23 ₹14,046 31 Mar 24 ₹15,075 Returns for Aditya Birla Sun Life Medium Term Plan
absolute basis & more than 1 year are on CAGR (Compound Annual Growth Rate) basis. as on 25 Apr 24 Duration Returns 1 Month 0.3% 3 Month 1.6% 6 Month 3.7% 1 Year 6.2% 3 Year 12.2% 5 Year 8.6% 10 Year 15 Year Since launch 8.5% Historical performance (Yearly) on absolute basis
Year Returns 2023 6.9% 2022 24.8% 2021 7.1% 2020 8.1% 2019 -4.4% 2018 5.6% 2017 7% 2016 10.9% 2015 9.5% 2014 12% Fund Manager information for Aditya Birla Sun Life Medium Term Plan
Name Since Tenure Sunaina Cunha 1 Sep 14 9.59 Yr. Mohit Sharma 6 Aug 20 3.65 Yr. Dhaval Joshi 21 Nov 22 1.36 Yr. Data below for Aditya Birla Sun Life Medium Term Plan as on 31 Mar 24
Asset Allocation
Asset Class Value Cash 8.71% Equity 2.12% Debt 88.54% Other 0.63% Debt Sector Allocation
Sector Value Government 49.81% Corporate 38.73% Cash Equivalent 8.71% Credit Quality
Rating Value A 3.96% AA 30.68% AAA 64.98% BB 0.38% Top Securities Holdings / Portfolio
Name Holding Value Quantity 7.26% Govt Stock 2033
Sovereign Bonds | -24% ₹450 Cr 44,500,000 7.18% Govt Stock 2033
Sovereign Bonds | -14% ₹267 Cr 26,500,000
↓ -2,500,000 7.18% Govt Stock 2037
Sovereign Bonds | -5% ₹101 Cr 10,000,000
↑ 1,500,000 Belstar Investment And Finance Private Limited
Debentures | -3% ₹50 Cr 5,000 Creditaccess Grameen Limited
Debentures | -3% ₹50 Cr 500,000 JSW Steel Limited
Debentures | -3% ₹50 Cr 500 Hinduja Housing Finance Limited 8.85%
Debentures | -2% ₹46 Cr 4,600 JM Financial Credit Solutions Limited
Debentures | -2% ₹44 Cr 440 Nexus Select Trust
Debentures | -2% ₹40 Cr 4,000 JM Financial Products Limited
Debentures | -2% ₹40 Cr 4,000 2. Nippon India Credit Risk Fund
CAGR/Annualized return of 6.3% since its launch. Ranked 21 in Credit Risk category. Return for 2023 was 7.9% , 2022 was 3.9% and 2021 was 13.5% . Nippon India Credit Risk Fund
Growth Launch Date 8 Jun 05 NAV (25 Apr 24) ₹31.5436 ↑ 0.01 (0.04 %) Net Assets (Cr) ₹1,024 on 31 Mar 24 Category Debt - Credit Risk AMC Nippon Life Asset Management Ltd. Rating ☆☆ Risk Moderate Expense Ratio 1.64 Sharpe Ratio 2.07 Information Ratio 0 Alpha Ratio 0 Min Investment 500 Min SIP Investment 100 Exit Load 0-12 Months (1%),12 Months and above(NIL) Yield to Maturity 9.02% Effective Maturity 2 Years 2 Months 16 Days Modified Duration 1 Year 10 Months 2 Days Growth of 10,000 investment over the years.
Date Value 31 Mar 19 ₹10,000 31 Mar 20 ₹8,876 31 Mar 21 ₹9,556 31 Mar 22 ₹10,773 31 Mar 23 ₹11,282 31 Mar 24 ₹12,192 Returns for Nippon India Credit Risk Fund
absolute basis & more than 1 year are on CAGR (Compound Annual Growth Rate) basis. as on 25 Apr 24 Duration Returns 1 Month 0.7% 3 Month 1.9% 6 Month 3.8% 1 Year 7.5% 3 Year 8.4% 5 Year 4.1% 10 Year 15 Year Since launch 6.3% Historical performance (Yearly) on absolute basis
Year Returns 2023 7.9% 2022 3.9% 2021 13.5% 2020 -5.9% 2019 1.9% 2018 6.1% 2017 7% 2016 10% 2015 8.8% 2014 11% Fund Manager information for Nippon India Credit Risk Fund
Name Since Tenure Kinjal Desai 25 May 18 5.86 Yr. Sushil Budhia 1 Feb 20 4.16 Yr. Data below for Nippon India Credit Risk Fund as on 31 Mar 24
Asset Allocation
Asset Class Value Cash 4.42% Debt 95.33% Other 0.25% Debt Sector Allocation
Sector Value Corporate 84.78% Government 10.55% Cash Equivalent 4.42% Credit Quality
Rating Value A 23.35% AA 47.98% AAA 28.67% Top Securities Holdings / Portfolio
Name Holding Value Quantity Summit Digitel Infrastructure Limited
Debentures | -6% ₹60 Cr 620 JSW Steel Limited
Debentures | -5% ₹55 Cr 550 7.1% Govt Stock 2029
Sovereign Bonds | -5% ₹50 Cr 5,000,000 7.06% Govt Stock 2028
Sovereign Bonds | -5% ₹50 Cr 5,000,000 Indinfravit Trust
Debentures | -5% ₹49 Cr 5,000 Godrej Properties Limited
Debentures | -4% ₹45 Cr 4,500 Greenlam Industries Limited
Debentures | -4% ₹44 Cr 450 Prestige Projects Private Limited 11.75%
Debentures | -4% ₹40 Cr 4,000
↑ 4,000 DLF Cyber City Developers Limited 8.4%
Debentures | -4% ₹40 Cr 4,000 Lodha Developers Private Limited
Debentures | -4% ₹38 Cr 378 3. UTI Treasury Advantage Fund
CAGR/Annualized return of 7.2% since its launch. Ranked 15 in Low Duration category. Return for 2023 was 7.1% , 2022 was 4.5% and 2021 was 9% . UTI Treasury Advantage Fund
Growth Launch Date 23 Apr 07 NAV (25 Apr 24) ₹3,240.72 ↑ 0.33 (0.01 %) Net Assets (Cr) ₹2,672 on 31 Mar 24 Category Debt - Low Duration AMC UTI Asset Management Company Ltd Rating ☆☆☆☆ Risk Moderately Low Expense Ratio 0.44 Sharpe Ratio 1.13 Information Ratio 0 Alpha Ratio 0 Min Investment 10,000 Min SIP Investment 500 Exit Load NIL Yield to Maturity 7.84% Effective Maturity 1 Year 2 Months 23 Days Modified Duration 1 Year 29 Days Growth of 10,000 investment over the years.
Date Value 31 Mar 19 ₹10,000 31 Mar 20 ₹9,537 31 Mar 21 ₹10,145 31 Mar 22 ₹11,078 31 Mar 23 ₹11,654 31 Mar 24 ₹12,511 Returns for UTI Treasury Advantage Fund
absolute basis & more than 1 year are on CAGR (Compound Annual Growth Rate) basis. as on 25 Apr 24 Duration Returns 1 Month 0.7% 3 Month 1.9% 6 Month 3.7% 1 Year 7.2% 3 Year 7.3% 5 Year 4.6% 10 Year 15 Year Since launch 7.2% Historical performance (Yearly) on absolute basis
Year Returns 2023 7.1% 2022 4.5% 2021 9% 2020 7.3% 2019 -4.2% 2018 7.3% 2017 7% 2016 8.9% 2015 8.8% 2014 9.3% Fund Manager information for UTI Treasury Advantage Fund
Name Since Tenure Anurag Mittal 1 Dec 21 2.33 Yr. Data below for UTI Treasury Advantage Fund as on 31 Mar 24
Asset Allocation
Asset Class Value Cash 57.69% Debt 42.05% Other 0.27% Debt Sector Allocation
Sector Value Corporate 44.64% Cash Equivalent 39.22% Government 15.88% Credit Quality
Rating Value AA 6.02% AAA 93.98% Top Securities Holdings / Portfolio
Name Holding Value Quantity National Bank For Agriculture And Rural Development
Debentures | -3% ₹100 Cr 10,000
↑ 2,500 National Bank For Agriculture And Rural Development
Debentures | -3% ₹100 Cr 10,000 Power Finance Corporation Ltd.
Debentures | -3% ₹99 Cr 10,000
↑ 5,000 182 DTB 29032024
Sovereign Bonds | -2% ₹75 Cr 750,000,000 ICICI Bank Ltd.
Debentures | -2% ₹70 Cr 750,000,000 Rural Electrification Corporation Limited
Debentures | -2% ₹55 Cr 5,500 7.18% Govt Stock 2033
Sovereign Bonds | -2% ₹50 Cr 500,000,000
↑ 250,000,000 Small Industries Development Bank Of India
Debentures | -2% ₹50 Cr 5,000 Rural Electrification Corporation Limited
Debentures | -2% ₹50 Cr 5,000 Nirma Limited
Debentures | -2% ₹50 Cr 5,000 4. UTI Short Term Income Fund
CAGR/Annualized return of 6.6% since its launch. Ranked 10 in Short term Bond category. Return for 2023 was 6.9% , 2022 was 3.8% and 2021 was 8.4% . UTI Short Term Income Fund
Growth Launch Date 19 Sep 07 NAV (25 Apr 24) ₹28.8415 ↓ 0.00 (0.00 %) Net Assets (Cr) ₹2,689 on 31 Mar 24 Category Debt - Short term Bond AMC UTI Asset Management Company Ltd Rating ☆☆☆☆ Risk Moderate Expense Ratio 0.95 Sharpe Ratio 0.88 Information Ratio 0 Alpha Ratio 0 Min Investment 10,000 Min SIP Investment 500 Exit Load NIL Yield to Maturity 7.51% Effective Maturity 3 Years 8 Months 5 Days Modified Duration 2 Years 5 Months 8 Days Growth of 10,000 investment over the years.
Date Value 31 Mar 19 ₹10,000 31 Mar 20 ₹9,610 31 Mar 21 ₹10,419 31 Mar 22 ₹11,372 31 Mar 23 ₹11,879 31 Mar 24 ₹12,787 Returns for UTI Short Term Income Fund
absolute basis & more than 1 year are on CAGR (Compound Annual Growth Rate) basis. as on 25 Apr 24 Duration Returns 1 Month 0.5% 3 Month 1.9% 6 Month 3.9% 1 Year 7% 3 Year 7% 5 Year 5.1% 10 Year 15 Year Since launch 6.6% Historical performance (Yearly) on absolute basis
Year Returns 2023 6.9% 2022 3.8% 2021 8.4% 2020 10.5% 2019 -3.9% 2018 6% 2017 6.1% 2016 10.1% 2015 8.3% 2014 10.9% Fund Manager information for UTI Short Term Income Fund
Name Since Tenure Sudhir Agarwal 25 Oct 12 11.44 Yr. Data below for UTI Short Term Income Fund as on 31 Mar 24
Asset Allocation
Asset Class Value Cash 7.8% Debt 91.98% Other 0.22% Debt Sector Allocation
Sector Value Government 49.63% Corporate 42.34% Cash Equivalent 7.8% Credit Quality
Rating Value AA 9.94% AAA 90.06% Top Securities Holdings / Portfolio
Name Holding Value Quantity 7.37% Govt Stock 2028
Sovereign Bonds | -16% ₹430 Cr 4,250,000,000
↓ -1,000,000,000 182 DTB 29082024
Sovereign Bonds | -13% ₹339 Cr 3,500,000,000 India (Republic of)
- | -10% ₹266 Cr 2,750,000,000
↑ 2,750,000,000 National Bank For Agriculture And Rural Development
Debentures | -8% ₹226 Cr 22,500 Power Finance Corporation Ltd.
Debentures | -7% ₹202 Cr 20,000 Small Industries Development Bank of India
Debentures | -7% ₹201 Cr 20,000 Rural Electrification Corporation Limited
Debentures | -7% ₹183 Cr 18,000 LIC Housing Finance Limited
Debentures | -5% ₹125 Cr 1,250
↑ 1,250 India Grid TRust
Debentures | -3% ₹75 Cr 750 Shriram Finance Limited
Debentures | -3% ₹70 Cr 7,000 5. Nippon India Ultra Short Duration Fund
CAGR/Annualized return of 6% since its launch. Ranked 62 in Ultrashort Bond category. Return for 2023 was 6.7% , 2022 was 4.6% and 2021 was 7.8% . Nippon India Ultra Short Duration Fund
Growth Launch Date 7 Dec 01 NAV (25 Apr 24) ₹3,709.56 ↑ 0.39 (0.01 %) Net Assets (Cr) ₹4,332 on 31 Mar 24 Category Debt - Ultrashort Bond AMC Nippon Life Asset Management Ltd. Rating ☆☆ Risk Low Expense Ratio 1.17 Sharpe Ratio -0.34 Information Ratio 0 Alpha Ratio 0 Min Investment 100 Min SIP Investment 100 Exit Load NIL Yield to Maturity 7.89% Effective Maturity 5 Months 25 Days Modified Duration 5 Months 7 Days Growth of 10,000 investment over the years.
Date Value 31 Mar 19 ₹10,000 31 Mar 20 ₹9,975 31 Mar 21 ₹10,468 31 Mar 22 ₹11,275 31 Mar 23 ₹11,861 31 Mar 24 ₹12,682 Returns for Nippon India Ultra Short Duration Fund
absolute basis & more than 1 year are on CAGR (Compound Annual Growth Rate) basis. as on 25 Apr 24 Duration Returns 1 Month 0.8% 3 Month 1.9% 6 Month 3.6% 1 Year 6.9% 3 Year 6.7% 5 Year 4.9% 10 Year 15 Year Since launch 6% Historical performance (Yearly) on absolute basis
Year Returns 2023 6.7% 2022 4.6% 2021 7.8% 2020 4.9% 2019 0.9% 2018 7.3% 2017 5.8% 2016 6.8% 2015 7.6% 2014 8.4% Fund Manager information for Nippon India Ultra Short Duration Fund
Name Since Tenure Vivek Sharma 1 Oct 13 10.5 Yr. Kinjal Desai 25 May 18 5.85 Yr. Akshay Sharma 1 Dec 22 1.33 Yr. Data below for Nippon India Ultra Short Duration Fund as on 31 Mar 24
Asset Allocation
Asset Class Value Cash 56.59% Debt 43.15% Other 0.26% Debt Sector Allocation
Sector Value Corporate 57.24% Cash Equivalent 27.6% Government 14.9% Credit Quality
Rating Value AA 18.47% AAA 81.53% Top Securities Holdings / Portfolio
Name Holding Value Quantity India (Republic of)
- | -9% ₹483 Cr 50,000,000
↑ 50,000,000 Canara Bank
Domestic Bonds | -5% ₹270 Cr 5,500
↑ 5,500 Indinfravit Trust
Debentures | -4% ₹216 Cr 22,000 Dlf Cyber City Developers Ltd
Debentures | -3% ₹187 Cr 1,890 Power Finance Corporation Limited
Debentures | -2% ₹101 Cr 1,000 PNb Housing Finance Limited
Debentures | -2% ₹100 Cr 10,000 L&T Metro Rail (Hyderabad) Limited
Debentures | -2% ₹98 Cr 1,000 182 DTB 22082024
Sovereign Bonds | -2% ₹97 Cr 10,000,000 Shriram Transport Finance Company Limited
Debentures | -2% ₹95 Cr 9,500 Indusind Bank Ltd.
Debentures | -2% ₹93 Cr 2,000
↑ 2,000 6. ICICI Prudential Regular Savings Fund
CAGR/Annualized return of 8.2% since its launch. Ranked 26 in Credit Risk category. Return for 2023 was 7.2% , 2022 was 5.1% and 2021 was 6.2% . ICICI Prudential Regular Savings Fund
Growth Launch Date 3 Dec 10 NAV (25 Apr 24) ₹28.6722 ↑ 0.01 (0.04 %) Net Assets (Cr) ₹7,187 on 31 Mar 24 Category Debt - Credit Risk AMC ICICI Prudential Asset Management Company Limited Rating ☆ Risk Moderate Expense Ratio 1.54 Sharpe Ratio 1.16 Information Ratio 0 Alpha Ratio 0 Min Investment 10,000 Min SIP Investment 100 Exit Load 0-1 Years (1%),1 Years and above(NIL) Yield to Maturity 8.73% Effective Maturity 4 Years 4 Days Modified Duration 2 Years 6 Months 18 Days Growth of 10,000 investment over the years.
Date Value 31 Mar 19 ₹10,000 31 Mar 20 ₹10,954 31 Mar 21 ₹11,882 31 Mar 22 ₹12,680 31 Mar 23 ₹13,338 31 Mar 24 ₹14,405 Returns for ICICI Prudential Regular Savings Fund
absolute basis & more than 1 year are on CAGR (Compound Annual Growth Rate) basis. as on 25 Apr 24 Duration Returns 1 Month 0.4% 3 Month 1.7% 6 Month 4.3% 1 Year 7.5% 3 Year 6.6% 5 Year 7.6% 10 Year 15 Year Since launch 8.2% Historical performance (Yearly) on absolute basis
Year Returns 2023 7.2% 2022 5.1% 2021 6.2% 2020 9.8% 2019 9.5% 2018 6.6% 2017 6.8% 2016 9.5% 2015 9% 2014 11% Fund Manager information for ICICI Prudential Regular Savings Fund
Name Since Tenure Manish Banthia 7 Nov 16 7.4 Yr. Akhil Kakkar 22 Jan 24 0.19 Yr. Data below for ICICI Prudential Regular Savings Fund as on 31 Mar 24
Asset Allocation
Asset Class Value Cash 7.74% Equity 1.7% Debt 90.29% Other 0.28% Debt Sector Allocation
Sector Value Corporate 64.3% Government 20.64% Cash Equivalent 7.74% Securitized 5.34% Credit Quality
Rating Value A 12.83% AA 53.64% AAA 33.53% Top Securities Holdings / Portfolio
Name Holding Value Quantity 7.18% Govt Stock 2033
Sovereign Bonds | -14% ₹1,007 Cr 99,942,330 Embassy Office Parks Reit
Unlisted bonds | -5% ₹334 Cr 8,456,117 7.06% Govt Stock 2028
Sovereign Bonds | -4% ₹264 Cr 26,430,750 Varroc Engineering Limited
Debentures | -3% ₹247 Cr 25,000 Ongc Petro Additions Limited
Debentures | -3% ₹224 Cr 2,250 Aadhar Housing Finance Ltd
Debentures | -2% ₹174 Cr 17,500 Nirma Limited
Debentures | -2% ₹150 Cr 15,000 Kalpataru Projects International Limited
Debentures | -2% ₹149 Cr 15,000 Aadharshila Infratech Pvt Ltd.
Debentures | -2% ₹148 Cr 15,000 7.38% Govt Stock 2027
Sovereign Bonds | -2% ₹131 Cr 12,937,900
↓ -15,000,000 7. SBI Credit Risk Fund
CAGR/Annualized return of 7.4% since its launch. Ranked 3 in Credit Risk category. Return for 2023 was 8.3% , 2022 was 4.2% and 2021 was 5% . SBI Credit Risk Fund
Growth Launch Date 19 Jul 04 NAV (25 Apr 24) ₹41.2837 ↑ 0.00 (0.01 %) Net Assets (Cr) ₹2,506 on 31 Mar 24 Category Debt - Credit Risk AMC SBI Funds Management Private Limited Rating ☆☆☆☆ Risk Moderate Expense Ratio 1.95 Sharpe Ratio 0.94 Information Ratio 0 Alpha Ratio 0 Min Investment 5,000 Min SIP Investment 500 Exit Load 0-12 Months (3%),12-24 Months (1.5%),24-36 Months (0.75%),36 Months and above(NIL) Yield to Maturity 8.49% Effective Maturity 2 Years 8 Months 12 Days Modified Duration 2 Years 14 Days Growth of 10,000 investment over the years.
Date Value 31 Mar 19 ₹10,000 31 Mar 20 ₹10,620 31 Mar 21 ₹11,474 31 Mar 22 ₹12,112 31 Mar 23 ₹12,679 31 Mar 24 ₹13,793 Returns for SBI Credit Risk Fund
absolute basis & more than 1 year are on CAGR (Compound Annual Growth Rate) basis. as on 25 Apr 24 Duration Returns 1 Month 0.5% 3 Month 1.8% 6 Month 3.6% 1 Year 6.7% 3 Year 6.2% 5 Year 6.8% 10 Year 15 Year Since launch 7.4% Historical performance (Yearly) on absolute basis
Year Returns 2023 8.3% 2022 4.2% 2021 5% 2020 9.8% 2019 6.5% 2018 6.2% 2017 6.9% 2016 10.5% 2015 9.7% 2014 10.6% Fund Manager information for SBI Credit Risk Fund
Name Since Tenure Lokesh Mallya 1 Feb 17 7.16 Yr. Pradeep Kesavan 1 Dec 23 0.33 Yr. Adesh Sharma 1 Dec 23 0.33 Yr. Data below for SBI Credit Risk Fund as on 31 Mar 24
Asset Allocation
Asset Class Value Cash 10.97% Equity 2.18% Debt 86.56% Other 0.29% Debt Sector Allocation
Sector Value Corporate 66.8% Government 19.76% Cash Equivalent 10.97% Credit Quality
Rating Value A 3.42% AA 64.88% AAA 31.7% Top Securities Holdings / Portfolio
Name Holding Value Quantity 7.18% Govt Stock 2033
Sovereign Bonds | -7% ₹181 Cr 18,000,000
↓ -4,000,000 7.16% Govt Stock 2050
Sovereign Bonds | -5% ₹125 Cr 12,500,000
↑ 12,500,000 Aadhar Housing Finance Limited
Debentures | -5% ₹121 Cr 12,200 Nirma Limited
Debentures | -5% ₹115 Cr 11,500 Jindal Stainless Limited
Debentures | -3% ₹88 Cr 900 Avanse Financial Services Limited
Debentures | -3% ₹80 Cr 8,000 Ongc Petro Additions Limited
Debentures | -3% ₹75 Cr 7,500 JSW Steel Limited
Debentures | -3% ₹75 Cr 750 Nuvoco Vistas Corporation Limited
Debentures | -3% ₹74 Cr 750 Godrej Industries Limited
Debentures | -3% ₹74 Cr 750 8. UTI Ultra Short Term Fund
CAGR/Annualized return of 6.8% since its launch. Ranked 27 in Ultrashort Bond category. Return for 2023 was 6.7% , 2022 was 4.2% and 2021 was 6.1% . UTI Ultra Short Term Fund
Growth Launch Date 29 Aug 03 NAV (25 Apr 24) ₹3,905.27 ↑ 0.21 (0.01 %) Net Assets (Cr) ₹2,093 on 31 Mar 24 Category Debt - Ultrashort Bond AMC UTI Asset Management Company Ltd Rating ☆☆☆☆ Risk Moderately Low Expense Ratio 0.95 Sharpe Ratio -0.28 Information Ratio 0 Alpha Ratio 0 Min Investment 5,000 Min SIP Investment 500 Exit Load NIL Yield to Maturity 7.91% Effective Maturity 6 Months 13 Days Modified Duration 6 Months 1 Day Growth of 10,000 investment over the years.
Date Value 31 Mar 19 ₹10,000 31 Mar 20 ₹10,249 31 Mar 21 ₹10,759 31 Mar 22 ₹11,426 31 Mar 23 ₹11,994 31 Mar 24 ₹12,828 Returns for UTI Ultra Short Term Fund
absolute basis & more than 1 year are on CAGR (Compound Annual Growth Rate) basis. as on 25 Apr 24 Duration Returns 1 Month 0.7% 3 Month 1.9% 6 Month 3.5% 1 Year 6.9% 3 Year 6.1% 5 Year 5.1% 10 Year 15 Year Since launch 6.8% Historical performance (Yearly) on absolute basis
Year Returns 2023 6.7% 2022 4.2% 2021 6.1% 2020 5.3% 2019 3.3% 2018 7% 2017 6.6% 2016 8.9% 2015 8.5% 2014 8.8% Fund Manager information for UTI Ultra Short Term Fund
Name Since Tenure Ritesh Nambiar 1 Jul 15 8.76 Yr. Data below for UTI Ultra Short Term Fund as on 31 Mar 24
Asset Allocation
Asset Class Value Cash 69.83% Debt 29.95% Other 0.22% Debt Sector Allocation
Sector Value Corporate 51.82% Cash Equivalent 41.62% Government 6.34% Credit Quality
Rating Value AA 20.4% AAA 79.6% Top Securities Holdings / Portfolio
Name Holding Value Quantity 364 DTB 22032024
Sovereign Bonds | -4% ₹100 Cr 1,000,000,000 G R Infraprojects Limited
Debentures | -2% ₹50 Cr 500 182 DTB 29032024
Sovereign Bonds | -2% ₹50 Cr 500,000,000 LIC Housing Finance Ltd
Debentures | -2% ₹50 Cr 500 National Bank For Agriculture And Rural Development
Debentures | -2% ₹50 Cr 500 National Bank For Agriculture And Rural Development
Debentures | -2% ₹49 Cr 500
↑ 250 ICICI Bank Ltd.
Debentures | -2% ₹47 Cr 500,000,000 Jamnagar Utilities & Power Private Limited
Debentures | -2% ₹40 Cr 400 Axis Finance Limited
Debentures | -1% ₹28 Cr 250
↑ 250 India Grid TRust
Debentures | -1% ₹25 Cr 250
All efforts have been made to ensure the information provided here is accurate. However, no guarantees are made regarding correctness of data. Please verify with scheme information document before making any investment.
You Might Also Like
")


AMFI Registration No. 112358 | CIN: U74999MH2016PTC282153
Shepard Technologies Pvt. Ltd. (with ARN code 112358) makes no warranties or representations, express or implied, on products offered through the platform. It accepts no liability for any damages or losses, however caused, in connection with the use of, or on the reliance of its product or related services. Terms and conditions of the website are applicable.
©2024 Shepard Technologies Private Limited. All Rights Reserved