Benefits Of SIP (Systematic Investment Plans)
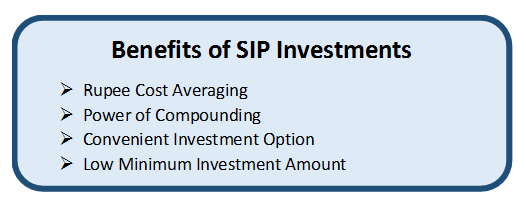
The benefits of SIP or Systematic Investment Plans range from rupee cost averaging, to Power of Compounding to inculcating the habit of saving to name a few. Investors today are always searching for the Top SIP, or the best systematic Investment plan to invest in. There are various SIP calculators available in the market that try and help investors make investment plans. But before choosing the best SIP or the best SIP Mutual Fund, those Investing must know the benefits of taking the route of the SIP.
Why Should One Invest in Systematic Investment Plan?

SIP & Rupee Cost Averaging
Rupee cost averaging or dollar cost averaging (as it’s known internationally) is a technique used to invest money in the stock market at regular intervals of time (mostly monthly). Since investors sign-up for a long-term investment plan, by virtue of the fact that investing continues during the bad cycles of the stock market, investors are able to “buy low”. For lump sum investments, most investors when they see a falling market or a bad phase, they defer their decisions to invest. During these periods a SIP continues its investing and ensures that the investor gets the benefit of a falling market.
Long Term Nature Of SIP Investments
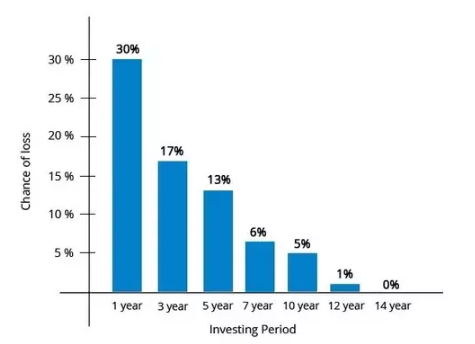
Another benefit of a systematic investment plan(SIP) is that by nature it is a long-term investment plan. Typically, a SIP can be taken for even 10, 20 or 30 years and it can a really long-term investment plan. The minimum tenure for a SIP can be as low as 6 months. However, since a systematic investment plan is used as a savings tool, it is a structured as a long-term savings plan with a tenure of many years.
Talk to our investment specialist
Power Of Compounding Of Systematic Investment Plans
It is well known that “it is not market timing that makes money, but the amount of time that you spend in the market”. With the invested amount increasing over time, the accumulated amount keeps on increasing and this being invested in the market would be subject to market growth and returns. The power of compounding is a benefit of SIPs that the investor realises over the long term when his/her investment period is maturing.
Minimum Investment Amount Of a SIP
A big benefit of SIPs is that it allows one to participate in the share market at very low amounts.The minimum investment amount in a systematic investment plan can be as low as 500 rupees (though some Mutual Funds companies allow for even INR 100). With such a low investment amount being a threshold, this makes investing into a SIP within the reach for most individuals earning money.
Convenience Of SIPs
Convenience is one of the biggest benefits of a SIP. A user has to sign-up one-time and go through documentation. Once done, thereafter debits for subsequent investments take place automatically and the investor just has to monitor the investments.
Habit Of Saving
Another benefit of SIPs is that prospective investors see it as a tool that inculcates savings. With a low investment amount, systematic nature and one-time registration it becomes a method of forced saving.
How To Invest In a Systematic Investment Plan?
One can use the services of a financial planner/expert or one can use the various online providers of such services or go directly to the fund house. One needs to do some basic research before choosing which SIPs to invest in. Using a sip calculator one can decide the amount to invest in for a certain goal, using such an approach one would create a corpus for the long term.
Fund Selection Methodology used to find 10 funds
Best SIP Plans In India 2026
The Best SIP Plans to invest in India are:
Fund NAV Net Assets (Cr) Min SIP Investment 3 MO (%) 6 MO (%) 1 YR (%) 3 YR (%) 5 YR (%) 2024 (%) Franklin Asian Equity Fund Growth ₹38.996
↑ 0.18 ₹315 500 12.5 21.8 36.6 13.7 2.1 23.7 DSP Natural Resources and New Energy Fund Growth ₹107.348
↑ 1.00 ₹1,573 500 10 22.3 35.8 22.9 21.5 17.5 DSP US Flexible Equity Fund Growth ₹76.8065
↓ -1.83 ₹1,068 500 3.4 13 26 21.2 16.3 33.8 Aditya Birla Sun Life Banking And Financial Services Fund Growth ₹65.04
↑ 0.07 ₹3,694 1,000 0.6 8.7 24.5 17.8 12.6 17.5 Franklin Build India Fund Growth ₹148.907
↑ 0.61 ₹3,036 500 1.7 6.5 23 27.8 23.7 3.7 Invesco India Growth Opportunities Fund Growth ₹100.6
↑ 0.21 ₹9,344 100 -2.7 -0.3 20.8 25 17.4 4.7 Kotak Equity Opportunities Fund Growth ₹360.051
↑ 1.44 ₹30,039 1,000 1.9 7.3 20.6 20.1 17.1 5.6 Kotak Standard Multicap Fund Growth ₹88.548
↑ 0.17 ₹56,460 500 1 5.7 19.9 17.7 14 9.5 Aditya Birla Sun Life Small Cap Fund Growth ₹85.2986
↑ 0.54 ₹4,938 1,000 -3.3 2.2 18.4 18.4 15.6 -3.7 ICICI Prudential Banking and Financial Services Fund Growth ₹138.82
↑ 0.32 ₹11,154 100 -0.5 4.3 17.7 16.6 12.3 15.9 Note: Returns up to 1 year are on absolute basis & more than 1 year are on CAGR basis. as on 16 Feb 26 Research Highlights & Commentary of 10 Funds showcased
Commentary Franklin Asian Equity Fund DSP Natural Resources and New Energy Fund DSP US Flexible Equity Fund Aditya Birla Sun Life Banking And Financial Services Fund Franklin Build India Fund Invesco India Growth Opportunities Fund Kotak Equity Opportunities Fund Kotak Standard Multicap Fund Aditya Birla Sun Life Small Cap Fund ICICI Prudential Banking and Financial Services Fund Point 1 Bottom quartile AUM (₹315 Cr). Bottom quartile AUM (₹1,573 Cr). Bottom quartile AUM (₹1,068 Cr). Lower mid AUM (₹3,694 Cr). Lower mid AUM (₹3,036 Cr). Upper mid AUM (₹9,344 Cr). Top quartile AUM (₹30,039 Cr). Highest AUM (₹56,460 Cr). Upper mid AUM (₹4,938 Cr). Upper mid AUM (₹11,154 Cr). Point 2 Established history (18+ yrs). Established history (17+ yrs). Established history (13+ yrs). Established history (12+ yrs). Established history (16+ yrs). Established history (18+ yrs). Oldest track record among peers (21 yrs). Established history (16+ yrs). Established history (18+ yrs). Established history (17+ yrs). Point 3 Top rated. Rating: 5★ (top quartile). Rating: 5★ (upper mid). Rating: 5★ (upper mid). Rating: 5★ (upper mid). Rating: 5★ (lower mid). Rating: 5★ (lower mid). Rating: 5★ (bottom quartile). Rating: 5★ (bottom quartile). Rating: 5★ (bottom quartile). Point 4 Risk profile: High. Risk profile: High. Risk profile: High. Risk profile: High. Risk profile: High. Risk profile: Moderately High. Risk profile: Moderately High. Risk profile: Moderately High. Risk profile: Moderately High. Risk profile: High. Point 5 5Y return: 2.06% (bottom quartile). 5Y return: 21.51% (top quartile). 5Y return: 16.34% (upper mid). 5Y return: 12.59% (bottom quartile). 5Y return: 23.70% (top quartile). 5Y return: 17.41% (upper mid). 5Y return: 17.13% (upper mid). 5Y return: 13.95% (lower mid). 5Y return: 15.62% (lower mid). 5Y return: 12.26% (bottom quartile). Point 6 3Y return: 13.69% (bottom quartile). 3Y return: 22.95% (upper mid). 3Y return: 21.20% (upper mid). 3Y return: 17.81% (lower mid). 3Y return: 27.85% (top quartile). 3Y return: 24.98% (top quartile). 3Y return: 20.06% (upper mid). 3Y return: 17.71% (bottom quartile). 3Y return: 18.45% (lower mid). 3Y return: 16.58% (bottom quartile). Point 7 1Y return: 36.56% (top quartile). 1Y return: 35.79% (top quartile). 1Y return: 26.03% (upper mid). 1Y return: 24.50% (upper mid). 1Y return: 22.96% (upper mid). 1Y return: 20.78% (lower mid). 1Y return: 20.56% (lower mid). 1Y return: 19.92% (bottom quartile). 1Y return: 18.43% (bottom quartile). 1Y return: 17.66% (bottom quartile). Point 8 Alpha: 0.00 (upper mid). Alpha: 0.00 (upper mid). Alpha: 2.48 (top quartile). Alpha: -1.32 (bottom quartile). Alpha: 0.00 (upper mid). Alpha: -3.20 (bottom quartile). Alpha: -2.40 (bottom quartile). Alpha: 1.61 (top quartile). Alpha: 0.00 (lower mid). Alpha: -0.56 (lower mid). Point 9 Sharpe: 1.54 (top quartile). Sharpe: 0.74 (upper mid). Sharpe: 1.20 (top quartile). Sharpe: 0.84 (upper mid). Sharpe: -0.05 (bottom quartile). Sharpe: 0.01 (bottom quartile). Sharpe: 0.04 (lower mid). Sharpe: 0.28 (lower mid). Sharpe: -0.32 (bottom quartile). Sharpe: 0.88 (upper mid). Point 10 Information ratio: 0.00 (upper mid). Information ratio: 0.00 (upper mid). Information ratio: -0.26 (bottom quartile). Information ratio: 0.25 (top quartile). Information ratio: 0.00 (lower mid). Information ratio: 0.75 (top quartile). Information ratio: -0.05 (bottom quartile). Information ratio: -0.04 (bottom quartile). Information ratio: 0.00 (lower mid). Information ratio: 0.16 (upper mid). Franklin Asian Equity Fund
DSP Natural Resources and New Energy Fund
DSP US Flexible Equity Fund
Aditya Birla Sun Life Banking And Financial Services Fund
Franklin Build India Fund
Invesco India Growth Opportunities Fund
Kotak Equity Opportunities Fund
Kotak Standard Multicap Fund
Aditya Birla Sun Life Small Cap Fund
ICICI Prudential Banking and Financial Services Fund
How to Invest in Mutual Fund SIP Online?
Open Free Investment Account for Lifetime at Fincash.com.
Complete your Registration and KYC Process
Upload Documents (PAN, Aadhaar, etc.). And, You are Ready to Invest!
Conclusion
In conclusion, SIPs offer a great way for retail investors to save money for the long term. While the returns generated over the long term against lump sum investments may be better also (may not be also!), however, they still remain a great tool to save money and reduce the risk of investing.
All efforts have been made to ensure the information provided here is accurate. However, no guarantees are made regarding correctness of data. Please verify with scheme information document before making any investment.


