Best SIP Plans for Long Term Investment 2026
The concept of Systematic Investment plan (SIP) has been gaining a lot of popularity amongst Indian investors since last few years. It is an excellent way to create a long-term savings habit. It helps in creating a large corpus for the future Financial goals. In a SIP, a fixed amount is invested monthly in a fund on a specific date by the investor.

Once you begin Investing monthly in a SIP for a longer period of time, your money starts growing every day (being invested in the stock market). Systematic Investment Plan helps you to average your purchase cost and maximise returns. When an investor invests regularly over a period, irrespective of the market conditions, he would get more units when the market is low & less units when the market is high. This averages out the purchase cost of your mutual fund units. Similarly, let’s check some of the most important benefits of a SIP in the long-run.
Talk to our investment specialist
Benefits of Long Term SIP Investment
Some of the important benefits of a SIP are:
Power of Compounding
When you invest over a longer duration, your investment starts compounding. This means that when you earn returns on the returns earned by your investment, your money would start compounding. This helps you to build a large corpus over the long run with regular small investments.
Helps in Achieving Goals
SIP is a smart way to achieve all your long-term financial goals like retirement, marriage, purchase of a house/car, etc. Investors can simply start investing in Mutual Funds as per their financial goals and attain them at certain period of time. If one starts investing at an early age, there is enough time for their SIP to grow. In this way it also becomes easier to fulfil all their goals on time.
Affordable
One of the most attractive parts of a systematic investment plan is its affordability. One can invest an amount as low as INR 500, which enables a route to a large number of Indians to initiate into investments. So, one who can’t make a lump sum payment, can invest via a SIP in Mutual Funds.
Why SIP is Best for Long Term Investment?
Investors often wonder of how SIPs are more profitable in the long-run than lump sum mode. Well, the historical data says so! Let’s check the data of the worst period of the stock market.
The worst period to start investing was around September 1994 (this was the time when the stock market had peaked). If one looks at the market data, the investor who had invested a lump sum sat on negative returns for 59 months (nearly 5 years!). The investor broke even in about July of 1999. The next year though some returns were generated, these returns were short lived due to the 2000 stock market crash subsequently. After suffering for another 4 years (with negative returns) and the investor finally became positive in October 2003. This was possibly the worst time to have invested a lump sum.
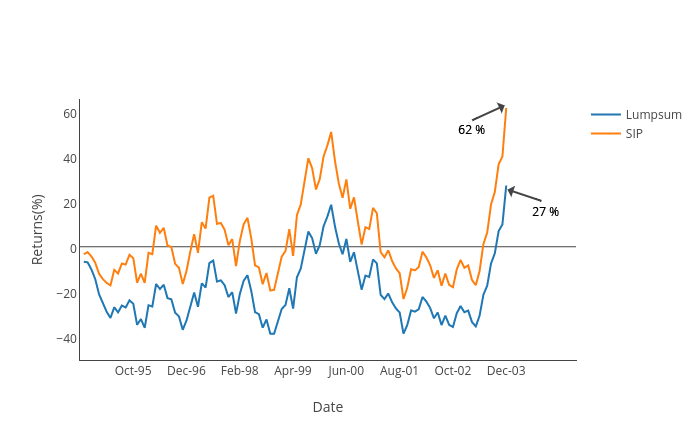
What happened to the SIP investor? The systematic Investment Plan investor was negative for only 19 months and started posting profits, however, these were short-lived. The SIP investors were up again by May 1999 after suffering interim losses. While the journey still continued to be shaky, SIP investors showed profits in the Portfolio much earlier.
So, who made better profits? The maximum loss for the lump sum investor was nearly 40%, whereas for the SIP investor was 23%. The systematic investment plan investor had a faster recovery period as well as a lower loss in the portfolio.
Best Mutual Funds for Long Term SIP Investment
Some of the best mutual funds SIP for a long-term are as follows-
Fund Selection Methodology used to find 5 funds
Best Large Cap Funds for Long Term SIP
Large cap funds are a type of Equity Mutual Funds where the corpus is invested in the stocks of companies with large market capitalization. These companies are mainly large firms with large businesses & big teams. The market capitalization of these companies is INR 1000 Cr & more. Since, the investments are made in big companies, these firms have more possibility of showing year on year steady growth, which in turns also offers stability over a time. These funds are considered to be safe & less volatile to the market fluctuations compared to mid & Small cap funds.
Fund NAV Net Assets (Cr) Min SIP Investment 3 MO (%) 6 MO (%) 1 YR (%) 3 YR (%) 5 YR (%) 2024 (%) Invesco India Largecap Fund Growth ₹72.03
↑ 0.67 ₹1,847 100 6 4 4.9 13.6 12 5.5 Bandhan Large Cap Fund Growth ₹78.32
↑ 0.81 ₹2,061 100 2.9 0.3 2 12.4 11.5 8.2 ICICI Prudential Bluechip Fund Growth ₹109.03
↑ 0.92 ₹79,421 100 1.5 -2.8 -0.6 12.1 13.1 11.3 Nippon India Large Cap Fund Growth ₹90.1734
↑ 1.06 ₹53,227 100 0.8 -1.3 0.4 12 14.8 9.2 DSP TOP 100 Equity Growth ₹460.797
↑ 3.84 ₹7,190 500 1.5 -3.2 -2.5 11.5 10.3 8.4 Note: Returns up to 1 year are on absolute basis & more than 1 year are on CAGR basis. as on 29 Jul 26 Research Highlights & Commentary of 5 Funds showcased
Commentary Invesco India Largecap Fund Bandhan Large Cap Fund ICICI Prudential Bluechip Fund Nippon India Large Cap Fund DSP TOP 100 Equity Point 1 Bottom quartile AUM (₹1,847 Cr). Bottom quartile AUM (₹2,061 Cr). Highest AUM (₹79,421 Cr). Upper mid AUM (₹53,227 Cr). Lower mid AUM (₹7,190 Cr). Point 2 Established history (16+ yrs). Established history (20+ yrs). Established history (18+ yrs). Established history (18+ yrs). Oldest track record among peers (23 yrs). Point 3 Rating: 3★ (lower mid). Rating: 2★ (bottom quartile). Top rated. Rating: 4★ (upper mid). Rating: 2★ (bottom quartile). Point 4 Risk profile: Moderately High. Risk profile: Moderately High. Risk profile: Moderately High. Risk profile: Moderately High. Risk profile: Moderately High. Point 5 5Y return: 12.02% (lower mid). 5Y return: 11.50% (bottom quartile). 5Y return: 13.11% (upper mid). 5Y return: 14.84% (top quartile). 5Y return: 10.32% (bottom quartile). Point 6 3Y return: 13.60% (top quartile). 3Y return: 12.41% (upper mid). 3Y return: 12.11% (lower mid). 3Y return: 12.00% (bottom quartile). 3Y return: 11.48% (bottom quartile). Point 7 1Y return: 4.89% (top quartile). 1Y return: 2.03% (upper mid). 1Y return: -0.61% (bottom quartile). 1Y return: 0.41% (lower mid). 1Y return: -2.53% (bottom quartile). Point 8 Alpha: 3.75 (top quartile). Alpha: 2.34 (upper mid). Alpha: -1.21 (bottom quartile). Alpha: 1.07 (lower mid). Alpha: -2.70 (bottom quartile). Point 9 Sharpe: -0.25 (top quartile). Sharpe: -0.35 (upper mid). Sharpe: -0.55 (bottom quartile). Sharpe: -0.43 (lower mid). Sharpe: -0.68 (bottom quartile). Point 10 Information ratio: 0.82 (lower mid). Information ratio: 0.63 (bottom quartile). Information ratio: 0.85 (upper mid). Information ratio: 0.98 (top quartile). Information ratio: 0.53 (bottom quartile). Invesco India Largecap Fund
Bandhan Large Cap Fund
ICICI Prudential Bluechip Fund
Nippon India Large Cap Fund
DSP TOP 100 Equity
Best Mid & Small Cap Funds for Long Term SIP
Mid cap and small cap funds are a type of equity mutual fund that invests in emerging companies in India. mid cap funds invest in companies which have a market capitalization of INR 500 to 1000 Cr. And, small caps are typically defined as firms with a market cap of around INR 500 Crore. These firms are called the future leader of the market. If the company does well in the future, these funds have a great potential to deliver good returns in the long-run. But, the risk is higher in mid & small cap funds. So, when an investor is investing in these funds, they should invest for a longer duration.
Fund NAV Net Assets (Cr) Min SIP Investment 3 MO (%) 6 MO (%) 1 YR (%) 3 YR (%) 5 YR (%) 2024 (%) Motilal Oswal Midcap 30 Fund Growth ₹100.335
↑ 0.90 ₹37,474 500 9.3 8.3 -1.2 19.3 21.9 -12.1 Invesco India Mid Cap Fund Growth ₹199.01
↑ 1.38 ₹13,767 500 10.3 15.7 10.3 24.7 19.5 6.3 Nippon India Small Cap Fund Growth ₹179.697
↑ 1.91 ₹78,407 100 4.9 14.1 5.6 16.2 18.5 -4.7 Edelweiss Mid Cap Fund Growth ₹108.502
↑ 0.46 ₹17,748 500 4.4 6.6 8.8 21.9 18.2 3.8 Sundaram Mid Cap Fund Growth ₹1,507.82
↑ 12.16 ₹14,026 100 5.6 8.9 9.9 20.8 18 4.1 Note: Returns up to 1 year are on absolute basis & more than 1 year are on CAGR basis. as on 29 Jul 26 Research Highlights & Commentary of 5 Funds showcased
Commentary Motilal Oswal Midcap 30 Fund Invesco India Mid Cap Fund Nippon India Small Cap Fund Edelweiss Mid Cap Fund Sundaram Mid Cap Fund Point 1 Upper mid AUM (₹37,474 Cr). Bottom quartile AUM (₹13,767 Cr). Highest AUM (₹78,407 Cr). Lower mid AUM (₹17,748 Cr). Bottom quartile AUM (₹14,026 Cr). Point 2 Established history (12+ yrs). Established history (19+ yrs). Established history (15+ yrs). Established history (18+ yrs). Oldest track record among peers (24 yrs). Point 3 Rating: 3★ (lower mid). Rating: 2★ (bottom quartile). Top rated. Rating: 3★ (bottom quartile). Rating: 4★ (upper mid). Point 4 Risk profile: Moderately High. Risk profile: Moderately High. Risk profile: Moderately High. Risk profile: High. Risk profile: Moderately High. Point 5 5Y return: 21.93% (top quartile). 5Y return: 19.49% (upper mid). 5Y return: 18.46% (lower mid). 5Y return: 18.20% (bottom quartile). 5Y return: 18.04% (bottom quartile). Point 6 3Y return: 19.35% (bottom quartile). 3Y return: 24.72% (top quartile). 3Y return: 16.22% (bottom quartile). 3Y return: 21.86% (upper mid). 3Y return: 20.76% (lower mid). Point 7 1Y return: -1.24% (bottom quartile). 1Y return: 10.29% (top quartile). 1Y return: 5.56% (bottom quartile). 1Y return: 8.78% (lower mid). 1Y return: 9.87% (upper mid). Point 8 Alpha: -14.72 (bottom quartile). Alpha: 0.00 (lower mid). Alpha: 3.21 (top quartile). Alpha: -1.09 (bottom quartile). Alpha: 0.71 (upper mid). Point 9 Sharpe: -0.71 (bottom quartile). Sharpe: 0.19 (top quartile). Sharpe: 0.02 (lower mid). Sharpe: -0.04 (bottom quartile). Sharpe: 0.06 (upper mid). Point 10 Information ratio: -0.25 (bottom quartile). Information ratio: 0.00 (lower mid). Information ratio: -0.27 (bottom quartile). Information ratio: 0.48 (top quartile). Information ratio: 0.32 (upper mid). Motilal Oswal Midcap 30 Fund
Invesco India Mid Cap Fund
Nippon India Small Cap Fund
Edelweiss Mid Cap Fund
Sundaram Mid Cap Fund
Best Diversified Funds for Long Term SIP
Diversified Funds are a class of equity mutual funds. These are the funds that invest across market capitalization, i.e., in large, mid & small cap funds. As, diversified funds invest across market caps, they master in balancing the portfolio. Investors can create a good balance in their portfolio by investing in diversified funds. However, they would still be affected by the Volatility of equities during an unstable market condition.
Fund NAV Net Assets (Cr) Min SIP Investment 3 MO (%) 6 MO (%) 1 YR (%) 3 YR (%) 5 YR (%) 2024 (%) IDBI Diversified Equity Fund Growth ₹37.99
↑ 0.14 ₹382 500 10.2 13.2 13.5 22.7 12 Aditya Birla Sun Life Manufacturing Equity Fund Growth ₹37.97
↑ 0.27 ₹1,229 1,000 6.9 18.3 19.5 19.5 14.2 3.5 Motilal Oswal Multicap 35 Fund Growth ₹61.5679
↑ 1.24 ₹13,294 500 8.9 6.5 0 18.9 12.5 -5.6 BNP Paribas Multi Cap Fund Growth ₹73.5154
↓ -0.01 ₹588 300 -4.6 -2.6 19.3 17.3 13.6 Mahindra Badhat Yojana Growth ₹38.436
↑ 0.42 ₹6,926 500 5.9 9.2 7.6 17 15.4 3.4 Note: Returns up to 1 year are on absolute basis & more than 1 year are on CAGR basis. as on 28 Jul 23 Research Highlights & Commentary of 5 Funds showcased
Commentary IDBI Diversified Equity Fund Aditya Birla Sun Life Manufacturing Equity Fund Motilal Oswal Multicap 35 Fund BNP Paribas Multi Cap Fund Mahindra Badhat Yojana Point 1 Bottom quartile AUM (₹382 Cr). Lower mid AUM (₹1,229 Cr). Highest AUM (₹13,294 Cr). Bottom quartile AUM (₹588 Cr). Upper mid AUM (₹6,926 Cr). Point 2 Established history (12+ yrs). Established history (11+ yrs). Established history (12+ yrs). Oldest track record among peers (20 yrs). Established history (9+ yrs). Point 3 Rating: 2★ (lower mid). Not Rated. Top rated. Rating: 4★ (upper mid). Not Rated. Point 4 Risk profile: Moderately High. Risk profile: High. Risk profile: Moderately High. Risk profile: Moderately High. Risk profile: Moderately High. Point 5 5Y return: 12.03% (bottom quartile). 5Y return: 14.17% (upper mid). 5Y return: 12.48% (bottom quartile). 5Y return: 13.57% (lower mid). 5Y return: 15.42% (top quartile). Point 6 3Y return: 22.73% (top quartile). 3Y return: 19.54% (upper mid). 3Y return: 18.86% (lower mid). 3Y return: 17.28% (bottom quartile). 3Y return: 16.96% (bottom quartile). Point 7 1Y return: 13.54% (lower mid). 1Y return: 19.48% (top quartile). 1Y return: 0.04% (bottom quartile). 1Y return: 19.34% (upper mid). 1Y return: 7.63% (bottom quartile). Point 8 Alpha: -1.07 (bottom quartile). Alpha: 0.00 (upper mid). Alpha: -7.36 (bottom quartile). Alpha: 0.00 (lower mid). Alpha: 4.46 (top quartile). Point 9 Sharpe: 1.01 (upper mid). Sharpe: 0.54 (lower mid). Sharpe: -0.74 (bottom quartile). Sharpe: 2.86 (top quartile). Sharpe: 0.01 (bottom quartile). Point 10 Information ratio: -0.53 (bottom quartile). Information ratio: 0.00 (lower mid). Information ratio: 0.53 (upper mid). Information ratio: 0.00 (bottom quartile). Information ratio: 0.64 (top quartile). IDBI Diversified Equity Fund
Aditya Birla Sun Life Manufacturing Equity Fund
Motilal Oswal Multicap 35 Fund
BNP Paribas Multi Cap Fund
Mahindra Badhat Yojana
Best Sector Funds for SIP Long Term
sector funds invests in securities of specific sectors of the economy, such as telecom, banking, FMCG, Information Technology (IT), pharmaceutical, and infrastructure, etc. For instance, a pharma fund can invest only in stocks of pharma companies and a banking sector fund can invest in banks. Being a sector-specific fund, the risk in such funds is higher. Thus, an investor should have an in-depth knowledge about the specific sector before investing in the fund.
Fund NAV Net Assets (Cr) Min SIP Investment 3 MO (%) 6 MO (%) 1 YR (%) 3 YR (%) 5 YR (%) 2024 (%) DSP Natural Resources and New Energy Fund Growth ₹105.283
↓ -0.41 ₹2,401 500 -6.6 -1.1 18.1 18.8 15.4 17.5 Aditya Birla Sun Life Banking And Financial Services Fund Growth ₹63.03
↑ 0.28 ₹3,676 1,000 2.3 -1.1 4.4 10.5 11.3 17.5 Franklin Build India Fund Growth ₹143.253
↑ 1.20 ₹3,256 500 -3.8 1.2 1.4 18.3 19.4 3.7 Bandhan Infrastructure Fund Growth ₹49.446
↑ 0.21 ₹1,545 100 0.7 8.4 -1.6 16.7 16.5 -6.9 Sundaram Rural and Consumption Fund Growth ₹94.7318
↑ 1.00 ₹1,422 100 4.6 5.5 -2.2 10.5 11.7 -0.1 Note: Returns up to 1 year are on absolute basis & more than 1 year are on CAGR basis. as on 28 Jul 26 Research Highlights & Commentary of 5 Funds showcased
Commentary DSP Natural Resources and New Energy Fund Aditya Birla Sun Life Banking And Financial Services Fund Franklin Build India Fund Bandhan Infrastructure Fund Sundaram Rural and Consumption Fund Point 1 Lower mid AUM (₹2,401 Cr). Highest AUM (₹3,676 Cr). Upper mid AUM (₹3,256 Cr). Bottom quartile AUM (₹1,545 Cr). Bottom quartile AUM (₹1,422 Cr). Point 2 Established history (18+ yrs). Established history (12+ yrs). Established history (16+ yrs). Established history (15+ yrs). Oldest track record among peers (20 yrs). Point 3 Top rated. Rating: 5★ (upper mid). Rating: 5★ (lower mid). Rating: 5★ (bottom quartile). Rating: 5★ (bottom quartile). Point 4 Risk profile: High. Risk profile: High. Risk profile: High. Risk profile: High. Risk profile: Moderately High. Point 5 5Y return: 15.37% (lower mid). 5Y return: 11.27% (bottom quartile). 5Y return: 19.36% (top quartile). 5Y return: 16.53% (upper mid). 5Y return: 11.73% (bottom quartile). Point 6 3Y return: 18.82% (top quartile). 3Y return: 10.53% (bottom quartile). 3Y return: 18.26% (upper mid). 3Y return: 16.70% (lower mid). 3Y return: 10.55% (bottom quartile). Point 7 1Y return: 18.06% (top quartile). 1Y return: 4.37% (upper mid). 1Y return: 1.39% (lower mid). 1Y return: -1.60% (bottom quartile). 1Y return: -2.20% (bottom quartile). Point 8 Alpha: 0.00 (upper mid). Alpha: 3.47 (top quartile). Alpha: 0.00 (lower mid). Alpha: 0.00 (bottom quartile). Alpha: -6.29 (bottom quartile). Point 9 Sharpe: 0.72 (top quartile). Sharpe: -0.06 (lower mid). Sharpe: -0.04 (upper mid). Sharpe: -0.25 (bottom quartile). Sharpe: -0.67 (bottom quartile). Point 10 Information ratio: 0.00 (upper mid). Information ratio: 0.24 (top quartile). Information ratio: 0.00 (lower mid). Information ratio: 0.00 (bottom quartile). Information ratio: -0.56 (bottom quartile). DSP Natural Resources and New Energy Fund
Aditya Birla Sun Life Banking And Financial Services Fund
Franklin Build India Fund
Bandhan Infrastructure Fund
Sundaram Rural and Consumption Fund
All efforts have been made to ensure the information provided here is accurate. However, no guarantees are made regarding correctness of data. Please verify with scheme information document before making any investment.
You Might Also Like


AMFI Registration No. 112358 | CIN: U74999MH2016PTC282153
Shepard Technologies Pvt. Ltd. (with ARN code 112358) makes no warranties or representations, express or implied, on products offered through the platform. It accepts no liability for any damages or losses, however caused, in connection with the use of, or on the reliance of its product or related services. Terms and conditions of the website are applicable.
©2026 Shepard Technologies Private Limited. All Rights Reserved
Very good for young generation.