Top 5 Best Equity SIP Funds to Invest
If you want your investments to be favored in all market conditions, then take your investments SIP way! Systematic Investment Plans (SIPs) are considered to be the most efficient ways of investing in Mutual Funds. And if you are planning to invest in equities, then SIPs are the best way to make longing returns. Best equity SIP funds can give you the desirable returns in the long-term to fulfill Financial goals. So, let’s see how SIP works, benefits of SIP investment, significant use of a sip calculator along with the best performing SIP funds for equity investments.
Talk to our investment specialist
Systematic Investing for Equity Mutual Funds
Ideally, when investors plan to invest in equities, they often doubt about the stability of returns. This is because they are linked to the market and are often exposed to Volatility. Thus, to balance such volatility and ensure long-term stable returns, SIPs are highly recommendable in equity investments. Historically, in bad market phase, it is noticed that investors who had taken the SIP route earned more stable returns than those who took the lump sum route. SIP’s investment is spread out over time, unlike a lump sum investment which takes place all at once. Therefore, your money in SIP starts growing each day (being invested in the stock market).
A systematic Investment plan is also widely considered to achieve long-term financial goals like Retirement planning, child’s education, purchase of a house/car or any other assets. Before we look at some more benefits of investing in a SIP, let's check some of the best equity SIP funds to invest.
Best SIP Plans for Equity Funds 2026
Fund Selection Methodology used to find 5 funds
Best Large Cap Equity SIP Funds
Fund NAV Net Assets (Cr) Min SIP Investment 3 MO (%) 6 MO (%) 1 YR (%) 3 YR (%) 5 YR (%) 2025 (%) JM Core 11 Fund Growth ₹20.0893
↑ 0.06 ₹286 500 5 5.6 4.2 12.9 14 -1.9 SBI Bluechip Fund Growth ₹92.8736
↓ -0.30 ₹55,064 500 1.5 -1.6 1.4 9.1 10.7 9.7 Indiabulls Blue Chip Fund Growth ₹42.56
↓ -0.03 ₹132 500 1.4 -1 0.5 9.9 9.9 7.5 Nippon India Large Cap Fund Growth ₹89.1181
↓ -0.19 ₹53,227 100 0.1 -2 -0.3 11.6 14.8 9.2 ICICI Prudential Bluechip Fund Growth ₹108.11
↓ -0.05 ₹79,421 100 1.1 -3.2 -0.9 11.8 13 11.3 Note: Returns up to 1 year are on absolute basis & more than 1 year are on CAGR basis. as on 28 Jul 26 Research Highlights & Commentary of 5 Funds showcased
Commentary JM Core 11 Fund SBI Bluechip Fund Indiabulls Blue Chip Fund Nippon India Large Cap Fund ICICI Prudential Bluechip Fund Point 1 Bottom quartile AUM (₹286 Cr). Upper mid AUM (₹55,064 Cr). Bottom quartile AUM (₹132 Cr). Lower mid AUM (₹53,227 Cr). Highest AUM (₹79,421 Cr). Point 2 Established history (18+ yrs). Oldest track record among peers (20 yrs). Established history (14+ yrs). Established history (18+ yrs). Established history (18+ yrs). Point 3 Top rated. Rating: 4★ (upper mid). Rating: 4★ (lower mid). Rating: 4★ (bottom quartile). Rating: 4★ (bottom quartile). Point 4 Risk profile: High. Risk profile: Moderately High. Risk profile: Moderately High. Risk profile: Moderately High. Risk profile: Moderately High. Point 5 5Y return: 13.98% (upper mid). 5Y return: 10.74% (bottom quartile). 5Y return: 9.91% (bottom quartile). 5Y return: 14.76% (top quartile). 5Y return: 13.01% (lower mid). Point 6 3Y return: 12.88% (top quartile). 3Y return: 9.12% (bottom quartile). 3Y return: 9.90% (bottom quartile). 3Y return: 11.56% (lower mid). 3Y return: 11.79% (upper mid). Point 7 1Y return: 4.20% (top quartile). 1Y return: 1.44% (upper mid). 1Y return: 0.50% (lower mid). 1Y return: -0.26% (bottom quartile). 1Y return: -0.88% (bottom quartile). Point 8 Alpha: 2.17 (upper mid). Alpha: 3.45 (top quartile). Alpha: 1.28 (lower mid). Alpha: 1.07 (bottom quartile). Alpha: -1.21 (bottom quartile). Point 9 Sharpe: -0.23 (top quartile). Sharpe: -0.28 (upper mid). Sharpe: -0.39 (lower mid). Sharpe: -0.43 (bottom quartile). Sharpe: -0.55 (bottom quartile). Point 10 Information ratio: 0.15 (lower mid). Information ratio: -0.05 (bottom quartile). Information ratio: 0.06 (bottom quartile). Information ratio: 0.98 (top quartile). Information ratio: 0.85 (upper mid). JM Core 11 Fund
SBI Bluechip Fund
Indiabulls Blue Chip Fund
Nippon India Large Cap Fund
ICICI Prudential Bluechip Fund
Best Large & Mid Cap Equity SIP Funds
Fund NAV Net Assets (Cr) Min SIP Investment 3 MO (%) 6 MO (%) 1 YR (%) 3 YR (%) 5 YR (%) 2025 (%) Invesco India Growth Opportunities Fund Growth ₹109.44
↓ -0.11 ₹11,164 100 10.2 15.1 8.2 23 17.4 4.7 Kotak Equity Opportunities Fund Growth ₹350.536
↓ -0.78 ₹31,263 1,000 1.8 0.6 3.8 13.9 14.1 5.6 DSP Equity Opportunities Fund Growth ₹620.768
↑ 1.14 ₹17,906 500 1.8 -1.5 1.8 14.7 12.5 7.1 Aditya Birla Sun Life Equity Advantage Fund Growth ₹936.75
↓ -1.24 ₹5,784 1,000 3.1 4 5.1 11.7 9 3.5 Bandhan Core Equity Fund Growth ₹138.897
↓ -0.12 ₹18,783 100 0.6 2.8 5 18.1 16.5 7.5 Note: Returns up to 1 year are on absolute basis & more than 1 year are on CAGR basis. as on 28 Jul 26 Research Highlights & Commentary of 5 Funds showcased
Commentary Invesco India Growth Opportunities Fund Kotak Equity Opportunities Fund DSP Equity Opportunities Fund Aditya Birla Sun Life Equity Advantage Fund Bandhan Core Equity Fund Point 1 Bottom quartile AUM (₹11,164 Cr). Highest AUM (₹31,263 Cr). Lower mid AUM (₹17,906 Cr). Bottom quartile AUM (₹5,784 Cr). Upper mid AUM (₹18,783 Cr). Point 2 Established history (18+ yrs). Established history (21+ yrs). Established history (26+ yrs). Oldest track record among peers (31 yrs). Established history (20+ yrs). Point 3 Top rated. Rating: 5★ (upper mid). Rating: 5★ (lower mid). Rating: 4★ (bottom quartile). Rating: 4★ (bottom quartile). Point 4 Risk profile: Moderately High. Risk profile: Moderately High. Risk profile: Moderately High. Risk profile: Moderately High. Risk profile: Moderately High. Point 5 5Y return: 17.44% (top quartile). 5Y return: 14.05% (lower mid). 5Y return: 12.48% (bottom quartile). 5Y return: 8.99% (bottom quartile). 5Y return: 16.54% (upper mid). Point 6 3Y return: 23.04% (top quartile). 3Y return: 13.88% (bottom quartile). 3Y return: 14.74% (lower mid). 3Y return: 11.68% (bottom quartile). 3Y return: 18.11% (upper mid). Point 7 1Y return: 8.24% (top quartile). 1Y return: 3.83% (bottom quartile). 1Y return: 1.83% (bottom quartile). 1Y return: 5.12% (upper mid). 1Y return: 5.02% (lower mid). Point 8 Alpha: 6.78 (top quartile). Alpha: 0.20 (lower mid). Alpha: -2.56 (bottom quartile). Alpha: 0.16 (bottom quartile). Alpha: 2.69 (upper mid). Point 9 Sharpe: 0.12 (top quartile). Sharpe: -0.19 (lower mid). Sharpe: -0.35 (bottom quartile). Sharpe: -0.19 (bottom quartile). Sharpe: -0.05 (upper mid). Point 10 Information ratio: 1.15 (upper mid). Information ratio: -0.05 (bottom quartile). Information ratio: 0.20 (lower mid). Information ratio: -0.96 (bottom quartile). Information ratio: 1.42 (top quartile). Invesco India Growth Opportunities Fund
Kotak Equity Opportunities Fund
DSP Equity Opportunities Fund
Aditya Birla Sun Life Equity Advantage Fund
Bandhan Core Equity Fund
Best Mid Cap Equity SIP Funds
Fund NAV Net Assets (Cr) Min SIP Investment 3 MO (%) 6 MO (%) 1 YR (%) 3 YR (%) 5 YR (%) 2025 (%) Sundaram Mid Cap Fund Growth ₹1,495.67
↑ 3.40 ₹14,026 100 4.6 8.2 9.7 20.4 18 4.1 Kotak Emerging Equity Scheme Growth ₹145.247
↓ -0.23 ₹67,611 1,000 4.1 11 8 19 16.9 1.8 Taurus Discovery (Midcap) Fund Growth ₹124.45
↑ 0.48 ₹125 1,000 6.6 7.7 2.7 11 12.2 0.8 BNP Paribas Mid Cap Fund Growth ₹110.927
↓ -0.09 ₹2,513 300 3.2 8.2 11.5 17.8 14.9 2.5 Edelweiss Mid Cap Fund Growth ₹108.04
↑ 0.22 ₹17,748 500 4 6.3 8.9 21.7 18.2 3.8 Note: Returns up to 1 year are on absolute basis & more than 1 year are on CAGR basis. as on 28 Jul 26 Research Highlights & Commentary of 5 Funds showcased
Commentary Sundaram Mid Cap Fund Kotak Emerging Equity Scheme Taurus Discovery (Midcap) Fund BNP Paribas Mid Cap Fund Edelweiss Mid Cap Fund Point 1 Lower mid AUM (₹14,026 Cr). Highest AUM (₹67,611 Cr). Bottom quartile AUM (₹125 Cr). Bottom quartile AUM (₹2,513 Cr). Upper mid AUM (₹17,748 Cr). Point 2 Established history (24+ yrs). Established history (19+ yrs). Oldest track record among peers (31 yrs). Established history (20+ yrs). Established history (18+ yrs). Point 3 Top rated. Rating: 4★ (upper mid). Rating: 4★ (lower mid). Rating: 3★ (bottom quartile). Rating: 3★ (bottom quartile). Point 4 Risk profile: Moderately High. Risk profile: Moderately High. Risk profile: Moderately High. Risk profile: High. Risk profile: High. Point 5 5Y return: 18.02% (upper mid). 5Y return: 16.87% (lower mid). 5Y return: 12.19% (bottom quartile). 5Y return: 14.90% (bottom quartile). 5Y return: 18.23% (top quartile). Point 6 3Y return: 20.43% (upper mid). 3Y return: 18.96% (lower mid). 3Y return: 11.00% (bottom quartile). 3Y return: 17.80% (bottom quartile). 3Y return: 21.69% (top quartile). Point 7 1Y return: 9.74% (upper mid). 1Y return: 8.03% (bottom quartile). 1Y return: 2.66% (bottom quartile). 1Y return: 11.50% (top quartile). 1Y return: 8.91% (lower mid). Point 8 Alpha: 0.71 (upper mid). Alpha: 0.70 (lower mid). Alpha: -9.74 (bottom quartile). Alpha: 3.32 (top quartile). Alpha: -1.09 (bottom quartile). Point 9 Sharpe: 0.06 (upper mid). Sharpe: 0.06 (lower mid). Sharpe: -0.32 (bottom quartile). Sharpe: 0.22 (top quartile). Sharpe: -0.04 (bottom quartile). Point 10 Information ratio: 0.32 (upper mid). Information ratio: -0.07 (lower mid). Information ratio: -2.03 (bottom quartile). Information ratio: -0.21 (bottom quartile). Information ratio: 0.48 (top quartile). Sundaram Mid Cap Fund
Kotak Emerging Equity Scheme
Taurus Discovery (Midcap) Fund
BNP Paribas Mid Cap Fund
Edelweiss Mid Cap Fund
Best Small Cap Equity SIP Funds
Fund NAV Net Assets (Cr) Min SIP Investment 3 MO (%) 6 MO (%) 1 YR (%) 3 YR (%) 5 YR (%) 2025 (%) Aditya Birla Sun Life Small Cap Fund Growth ₹95.4591
↓ -0.63 ₹5,731 1,000 7.7 17.3 11.3 15.1 12.6 -3.7 SBI Small Cap Fund Growth ₹178.57
↓ -0.62 ₹40,157 500 6.3 13.3 3.5 11.5 13.7 -4.9 DSP Small Cap Fund Growth ₹220.932
↓ -1.23 ₹19,635 500 8.8 20.3 11.4 16.7 16.7 -2.8 Nippon India Small Cap Fund Growth ₹177.786
↓ -1.41 ₹78,407 100 4.1 12.8 5.4 15.8 18.4 -4.7 Franklin India Smaller Companies Fund Growth ₹175.738
↓ -0.66 ₹14,336 500 3.3 12.1 2 14.1 16.3 -8.4 Note: Returns up to 1 year are on absolute basis & more than 1 year are on CAGR basis. as on 28 Jul 26 Research Highlights & Commentary of 5 Funds showcased
Commentary Aditya Birla Sun Life Small Cap Fund SBI Small Cap Fund DSP Small Cap Fund Nippon India Small Cap Fund Franklin India Smaller Companies Fund Point 1 Bottom quartile AUM (₹5,731 Cr). Upper mid AUM (₹40,157 Cr). Lower mid AUM (₹19,635 Cr). Highest AUM (₹78,407 Cr). Bottom quartile AUM (₹14,336 Cr). Point 2 Established history (19+ yrs). Established history (16+ yrs). Established history (19+ yrs). Established history (15+ yrs). Oldest track record among peers (20 yrs). Point 3 Top rated. Rating: 5★ (upper mid). Rating: 4★ (lower mid). Rating: 4★ (bottom quartile). Rating: 4★ (bottom quartile). Point 4 Risk profile: Moderately High. Risk profile: Moderately High. Risk profile: Moderately High. Risk profile: Moderately High. Risk profile: Moderately High. Point 5 5Y return: 12.57% (bottom quartile). 5Y return: 13.66% (bottom quartile). 5Y return: 16.73% (upper mid). 5Y return: 18.45% (top quartile). 5Y return: 16.30% (lower mid). Point 6 3Y return: 15.09% (lower mid). 3Y return: 11.55% (bottom quartile). 3Y return: 16.66% (top quartile). 3Y return: 15.81% (upper mid). 3Y return: 14.06% (bottom quartile). Point 7 1Y return: 11.28% (upper mid). 1Y return: 3.51% (bottom quartile). 1Y return: 11.44% (top quartile). 1Y return: 5.40% (lower mid). 1Y return: 2.03% (bottom quartile). Point 8 Alpha: 0.00 (upper mid). Alpha: 0.00 (lower mid). Alpha: 0.00 (bottom quartile). Alpha: 3.21 (top quartile). Alpha: -0.56 (bottom quartile). Point 9 Sharpe: 0.22 (top quartile). Sharpe: -0.07 (bottom quartile). Sharpe: 0.19 (upper mid). Sharpe: 0.02 (lower mid). Sharpe: -0.15 (bottom quartile). Point 10 Information ratio: 0.00 (top quartile). Information ratio: 0.00 (upper mid). Information ratio: 0.00 (lower mid). Information ratio: -0.27 (bottom quartile). Information ratio: -0.65 (bottom quartile). Aditya Birla Sun Life Small Cap Fund
SBI Small Cap Fund
DSP Small Cap Fund
Nippon India Small Cap Fund
Franklin India Smaller Companies Fund
Best Multi Cap Equity SIP Funds
Fund NAV Net Assets (Cr) Min SIP Investment 3 MO (%) 6 MO (%) 1 YR (%) 3 YR (%) 5 YR (%) 2025 (%) Kotak Standard Multicap Fund Growth ₹84.625
↓ -0.35 ₹55,850 500 0.7 -2.5 0.2 12 11.4 9.5 Mirae Asset India Equity Fund Growth ₹111.493
↑ 0.11 ₹38,379 1,000 2.5 -1.7 -0.2 8.7 9.1 10.2 Motilal Oswal Multicap 35 Fund Growth ₹60.3295
↑ 0.31 ₹13,294 500 7 4.6 -1.4 18.1 12.1 -5.6 BNP Paribas Multi Cap Fund Growth ₹73.5154
↓ -0.01 ₹588 300 -4.6 -2.6 19.3 17.3 13.6 Aditya Birla Sun Life Equity Fund Growth ₹1,927.48
↓ -0.60 ₹26,727 100 5.3 5.1 9.4 15 12.6 11.2 Note: Returns up to 1 year are on absolute basis & more than 1 year are on CAGR basis. as on 28 Jul 26 Research Highlights & Commentary of 5 Funds showcased
Commentary Kotak Standard Multicap Fund Mirae Asset India Equity Fund Motilal Oswal Multicap 35 Fund BNP Paribas Multi Cap Fund Aditya Birla Sun Life Equity Fund Point 1 Highest AUM (₹55,850 Cr). Upper mid AUM (₹38,379 Cr). Bottom quartile AUM (₹13,294 Cr). Bottom quartile AUM (₹588 Cr). Lower mid AUM (₹26,727 Cr). Point 2 Established history (16+ yrs). Established history (18+ yrs). Established history (12+ yrs). Established history (20+ yrs). Oldest track record among peers (27 yrs). Point 3 Top rated. Rating: 5★ (upper mid). Rating: 5★ (lower mid). Rating: 4★ (bottom quartile). Rating: 4★ (bottom quartile). Point 4 Risk profile: Moderately High. Risk profile: Moderately High. Risk profile: Moderately High. Risk profile: Moderately High. Risk profile: Moderately High. Point 5 5Y return: 11.44% (bottom quartile). 5Y return: 9.13% (bottom quartile). 5Y return: 12.14% (lower mid). 5Y return: 13.57% (top quartile). 5Y return: 12.55% (upper mid). Point 6 3Y return: 12.00% (bottom quartile). 3Y return: 8.75% (bottom quartile). 3Y return: 18.06% (top quartile). 3Y return: 17.28% (upper mid). 3Y return: 15.04% (lower mid). Point 7 1Y return: 0.24% (lower mid). 1Y return: -0.19% (bottom quartile). 1Y return: -1.36% (bottom quartile). 1Y return: 19.34% (top quartile). 1Y return: 9.44% (upper mid). Point 8 Alpha: -1.04 (bottom quartile). Alpha: 0.72 (upper mid). Alpha: -7.36 (bottom quartile). Alpha: 0.00 (lower mid). Alpha: 4.61 (top quartile). Point 9 Sharpe: -0.38 (lower mid). Sharpe: -0.42 (bottom quartile). Sharpe: -0.74 (bottom quartile). Sharpe: 2.86 (top quartile). Sharpe: -0.05 (upper mid). Point 10 Information ratio: 0.11 (lower mid). Information ratio: -0.47 (bottom quartile). Information ratio: 0.53 (upper mid). Information ratio: 0.00 (bottom quartile). Information ratio: 1.19 (top quartile). Kotak Standard Multicap Fund
Mirae Asset India Equity Fund
Motilal Oswal Multicap 35 Fund
BNP Paribas Multi Cap Fund
Aditya Birla Sun Life Equity Fund
Best Sector Equity SIP Funds
Fund NAV Net Assets (Cr) Min SIP Investment 3 MO (%) 6 MO (%) 1 YR (%) 3 YR (%) 5 YR (%) 2025 (%) DSP Natural Resources and New Energy Fund Growth ₹105.693
↑ 0.13 ₹2,401 500 -5.6 2.5 17.7 19 15.5 17.5 Aditya Birla Sun Life Banking And Financial Services Fund Growth ₹62.75
↓ -0.07 ₹3,676 1,000 2.1 -1 4 10.4 11.4 17.5 Franklin Build India Fund Growth ₹142.055
↓ -1.06 ₹3,256 500 -4.7 1.4 1.3 17.9 19.3 3.7 Bandhan Infrastructure Fund Growth ₹49.232
↓ -0.40 ₹1,545 100 0.3 8 -1.1 16.5 16.6 -6.9 Sundaram Rural and Consumption Fund Growth ₹93.736
↑ 0.48 ₹1,422 100 5 3.4 -2.8 10.2 11.5 -0.1 Note: Returns up to 1 year are on absolute basis & more than 1 year are on CAGR basis. as on 27 Jul 26 Research Highlights & Commentary of 5 Funds showcased
Commentary DSP Natural Resources and New Energy Fund Aditya Birla Sun Life Banking And Financial Services Fund Franklin Build India Fund Bandhan Infrastructure Fund Sundaram Rural and Consumption Fund Point 1 Lower mid AUM (₹2,401 Cr). Highest AUM (₹3,676 Cr). Upper mid AUM (₹3,256 Cr). Bottom quartile AUM (₹1,545 Cr). Bottom quartile AUM (₹1,422 Cr). Point 2 Established history (18+ yrs). Established history (12+ yrs). Established history (16+ yrs). Established history (15+ yrs). Oldest track record among peers (20 yrs). Point 3 Top rated. Rating: 5★ (upper mid). Rating: 5★ (lower mid). Rating: 5★ (bottom quartile). Rating: 5★ (bottom quartile). Point 4 Risk profile: High. Risk profile: High. Risk profile: High. Risk profile: High. Risk profile: Moderately High. Point 5 5Y return: 15.53% (lower mid). 5Y return: 11.42% (bottom quartile). 5Y return: 19.32% (top quartile). 5Y return: 16.59% (upper mid). 5Y return: 11.53% (bottom quartile). Point 6 3Y return: 19.00% (top quartile). 3Y return: 10.36% (bottom quartile). 3Y return: 17.93% (upper mid). 3Y return: 16.53% (lower mid). 3Y return: 10.16% (bottom quartile). Point 7 1Y return: 17.72% (top quartile). 1Y return: 3.98% (upper mid). 1Y return: 1.31% (lower mid). 1Y return: -1.12% (bottom quartile). 1Y return: -2.79% (bottom quartile). Point 8 Alpha: 0.00 (upper mid). Alpha: 3.47 (top quartile). Alpha: 0.00 (lower mid). Alpha: 0.00 (bottom quartile). Alpha: -6.29 (bottom quartile). Point 9 Sharpe: 0.72 (top quartile). Sharpe: -0.06 (lower mid). Sharpe: -0.04 (upper mid). Sharpe: -0.25 (bottom quartile). Sharpe: -0.67 (bottom quartile). Point 10 Information ratio: 0.00 (upper mid). Information ratio: 0.24 (top quartile). Information ratio: 0.00 (lower mid). Information ratio: 0.00 (bottom quartile). Information ratio: -0.56 (bottom quartile). DSP Natural Resources and New Energy Fund
Aditya Birla Sun Life Banking And Financial Services Fund
Franklin Build India Fund
Bandhan Infrastructure Fund
Sundaram Rural and Consumption Fund
Best ELSS SIP Funds
Fund NAV Net Assets (Cr) Min SIP Investment 3 MO (%) 6 MO (%) 1 YR (%) 3 YR (%) 5 YR (%) 2025 (%) Tata India Tax Savings Fund Growth ₹46.2512
↓ -0.01 ₹4,597 500 2.3 3.8 5.8 12.2 13 4.9 Bandhan Tax Advantage (ELSS) Fund Growth ₹153.91
↑ 0.17 ₹6,911 500 2.3 0.3 2.7 9.7 12 8 Aditya Birla Sun Life Tax Relief '96 Growth ₹61.51
↓ -0.21 ₹14,467 500 2.4 1.1 2.3 11.7 8.7 9.3 DSP Tax Saver Fund Growth ₹138.19
↑ 0.08 ₹16,562 500 1.2 -2.5 -0.1 14 12.6 7.5 HDFC Long Term Advantage Fund Growth ₹595.168
↑ 0.28 ₹1,318 500 1.2 15.4 35.5 20.6 17.4 Note: Returns up to 1 year are on absolute basis & more than 1 year are on CAGR basis. as on 28 Jul 26 Research Highlights & Commentary of 5 Funds showcased
Commentary Tata India Tax Savings Fund Bandhan Tax Advantage (ELSS) Fund Aditya Birla Sun Life Tax Relief '96 DSP Tax Saver Fund HDFC Long Term Advantage Fund Point 1 Bottom quartile AUM (₹4,597 Cr). Lower mid AUM (₹6,911 Cr). Upper mid AUM (₹14,467 Cr). Highest AUM (₹16,562 Cr). Bottom quartile AUM (₹1,318 Cr). Point 2 Established history (11+ yrs). Established history (17+ yrs). Established history (18+ yrs). Established history (19+ yrs). Oldest track record among peers (25 yrs). Point 3 Top rated. Rating: 5★ (upper mid). Rating: 4★ (lower mid). Rating: 4★ (bottom quartile). Rating: 3★ (bottom quartile). Point 4 Risk profile: Moderately High. Risk profile: Moderately High. Risk profile: Moderately High. Risk profile: Moderately High. Risk profile: Moderately High. Point 5 5Y return: 13.01% (upper mid). 5Y return: 12.02% (bottom quartile). 5Y return: 8.75% (bottom quartile). 5Y return: 12.55% (lower mid). 5Y return: 17.39% (top quartile). Point 6 3Y return: 12.24% (lower mid). 3Y return: 9.70% (bottom quartile). 3Y return: 11.71% (bottom quartile). 3Y return: 14.04% (upper mid). 3Y return: 20.64% (top quartile). Point 7 1Y return: 5.76% (upper mid). 1Y return: 2.66% (lower mid). 1Y return: 2.30% (bottom quartile). 1Y return: -0.10% (bottom quartile). 1Y return: 35.51% (top quartile). Point 8 Alpha: 4.23 (top quartile). Alpha: 0.89 (lower mid). Alpha: 0.31 (bottom quartile). Alpha: -1.27 (bottom quartile). Alpha: 1.75 (upper mid). Point 9 Sharpe: -0.09 (upper mid). Sharpe: -0.29 (lower mid). Sharpe: -0.30 (bottom quartile). Sharpe: -0.39 (bottom quartile). Sharpe: 2.27 (top quartile). Point 10 Information ratio: 0.22 (upper mid). Information ratio: -0.51 (bottom quartile). Information ratio: -0.24 (bottom quartile). Information ratio: 0.70 (top quartile). Information ratio: -0.15 (lower mid). Tata India Tax Savings Fund
Bandhan Tax Advantage (ELSS) Fund
Aditya Birla Sun Life Tax Relief '96
DSP Tax Saver Fund
HDFC Long Term Advantage Fund
Best Value Equity SIP Funds
Fund NAV Net Assets (Cr) Min SIP Investment 3 MO (%) 6 MO (%) 1 YR (%) 3 YR (%) 5 YR (%) 2025 (%) Tata Equity PE Fund Growth ₹347.148
↓ -0.68 ₹8,342 150 0.4 -2.1 0.7 12.8 14.3 3.7 JM Value Fund Growth ₹92.512
↓ -0.55 ₹823 500 0.5 0.6 -4.6 11.9 14.5 -4.4 Aditya Birla Sun Life Pure Value Fund Growth ₹134.676
↓ -0.04 ₹6,603 1,000 4.3 6.6 10.2 15.5 14.4 2.6 HDFC Capital Builder Value Fund Growth ₹778.649
↓ -1.40 ₹7,583 300 4.4 3.2 5.6 15.7 14.6 8.6 Bandhan Sterling Value Fund Growth ₹145.849
↓ -0.03 ₹9,985 100 1 -1 0.2 10.3 12.9 5 Note: Returns up to 1 year are on absolute basis & more than 1 year are on CAGR basis. as on 28 Jul 26 Research Highlights & Commentary of 5 Funds showcased
Commentary Tata Equity PE Fund JM Value Fund Aditya Birla Sun Life Pure Value Fund HDFC Capital Builder Value Fund Bandhan Sterling Value Fund Point 1 Upper mid AUM (₹8,342 Cr). Bottom quartile AUM (₹823 Cr). Bottom quartile AUM (₹6,603 Cr). Lower mid AUM (₹7,583 Cr). Highest AUM (₹9,985 Cr). Point 2 Established history (22+ yrs). Established history (29+ yrs). Established history (18+ yrs). Oldest track record among peers (32 yrs). Established history (18+ yrs). Point 3 Top rated. Rating: 4★ (upper mid). Rating: 3★ (lower mid). Rating: 3★ (bottom quartile). Rating: 3★ (bottom quartile). Point 4 Risk profile: Moderately High. Risk profile: High. Risk profile: Moderately High. Risk profile: Moderately High. Risk profile: Moderately High. Point 5 5Y return: 14.35% (bottom quartile). 5Y return: 14.53% (upper mid). 5Y return: 14.35% (lower mid). 5Y return: 14.60% (top quartile). 5Y return: 12.89% (bottom quartile). Point 6 3Y return: 12.81% (lower mid). 3Y return: 11.94% (bottom quartile). 3Y return: 15.53% (upper mid). 3Y return: 15.67% (top quartile). 3Y return: 10.30% (bottom quartile). Point 7 1Y return: 0.70% (lower mid). 1Y return: -4.60% (bottom quartile). 1Y return: 10.16% (top quartile). 1Y return: 5.59% (upper mid). 1Y return: 0.25% (bottom quartile). Point 8 Alpha: -2.09 (bottom quartile). Alpha: -1.90 (bottom quartile). Alpha: 6.28 (top quartile). Alpha: 3.42 (upper mid). Alpha: -0.78 (lower mid). Point 9 Sharpe: -0.45 (bottom quartile). Sharpe: -0.42 (bottom quartile). Sharpe: 0.01 (top quartile). Sharpe: -0.13 (upper mid). Sharpe: -0.39 (lower mid). Point 10 Information ratio: 0.23 (bottom quartile). Information ratio: 0.30 (lower mid). Information ratio: 0.70 (upper mid). Information ratio: 1.47 (top quartile). Information ratio: -0.16 (bottom quartile). Tata Equity PE Fund
JM Value Fund
Aditya Birla Sun Life Pure Value Fund
HDFC Capital Builder Value Fund
Bandhan Sterling Value Fund
Best Focused Equity SIP Funds
Fund NAV Net Assets (Cr) Min SIP Investment 3 MO (%) 6 MO (%) 1 YR (%) 3 YR (%) 5 YR (%) 2025 (%) Axis Focused 25 Fund Growth ₹54.52
↑ 0.07 ₹11,078 500 5.9 4 -0.5 8.6 5.4 2.5 Aditya Birla Sun Life Focused Equity Fund Growth ₹147.14
↑ 0.78 ₹7,855 1,000 4.1 0.2 5.8 13.3 12.1 10.1 Sundaram Select Focus Fund Growth ₹264.968
↓ -1.18 ₹1,354 100 -5 8.5 24.5 17 17.3 Motilal Oswal Focused 25 Fund Growth ₹49.1197
↓ -0.16 ₹1,635 500 10.2 16.7 13.3 10.7 9.4 -1.7 HDFC Focused 30 Fund Growth ₹232.571
↑ 0.39 ₹27,303 300 3.8 -0.5 2.2 15.7 18.3 10.9 Note: Returns up to 1 year are on absolute basis & more than 1 year are on CAGR basis. as on 28 Jul 26 Research Highlights & Commentary of 5 Funds showcased
Commentary Axis Focused 25 Fund Aditya Birla Sun Life Focused Equity Fund Sundaram Select Focus Fund Motilal Oswal Focused 25 Fund HDFC Focused 30 Fund Point 1 Upper mid AUM (₹11,078 Cr). Lower mid AUM (₹7,855 Cr). Bottom quartile AUM (₹1,354 Cr). Bottom quartile AUM (₹1,635 Cr). Highest AUM (₹27,303 Cr). Point 2 Established history (14+ yrs). Established history (20+ yrs). Oldest track record among peers (24 yrs). Established history (13+ yrs). Established history (21+ yrs). Point 3 Top rated. Rating: 4★ (upper mid). Rating: 3★ (lower mid). Rating: 3★ (bottom quartile). Rating: 3★ (bottom quartile). Point 4 Risk profile: Moderately High. Risk profile: Moderately High. Risk profile: Moderately High. Risk profile: Moderately High. Risk profile: Moderately High. Point 5 5Y return: 5.35% (bottom quartile). 5Y return: 12.08% (lower mid). 5Y return: 17.29% (upper mid). 5Y return: 9.42% (bottom quartile). 5Y return: 18.34% (top quartile). Point 6 3Y return: 8.64% (bottom quartile). 3Y return: 13.26% (lower mid). 3Y return: 17.03% (top quartile). 3Y return: 10.72% (bottom quartile). 3Y return: 15.67% (upper mid). Point 7 1Y return: -0.46% (bottom quartile). 1Y return: 5.85% (lower mid). 1Y return: 24.49% (top quartile). 1Y return: 13.30% (upper mid). 1Y return: 2.19% (bottom quartile). Point 8 Alpha: -3.54 (bottom quartile). Alpha: -0.11 (upper mid). Alpha: -5.62 (bottom quartile). Alpha: 12.39 (top quartile). Alpha: -0.27 (lower mid). Point 9 Sharpe: -0.52 (bottom quartile). Sharpe: -0.32 (bottom quartile). Sharpe: 1.85 (top quartile). Sharpe: 0.35 (upper mid). Sharpe: -0.32 (lower mid). Point 10 Information ratio: -0.78 (bottom quartile). Information ratio: 0.12 (upper mid). Information ratio: -0.52 (bottom quartile). Information ratio: -0.21 (lower mid). Information ratio: 0.67 (top quartile). Axis Focused 25 Fund
Aditya Birla Sun Life Focused Equity Fund
Sundaram Select Focus Fund
Motilal Oswal Focused 25 Fund
HDFC Focused 30 Fund
Taxation on Equity Funds
As per the Budget 2018 speech, a new Long Term Capital Gains (LTCG) tax on equity oriented Mutual Funds & stocks will be applicable from 1st April. The Finance Bill 2018 was passed by voice vote in Lok Sabha on 14th March 2018. Here’s how new income tax changes will impact the equity investments from 1st April 2018. *
1. Long Term Capital Gains
LTCGs exceeding INR 1 lakh arising from redemption of Mutual Fund units or equities on or after 1st April 2018, will be taxed at 10 percent (plus cess) or at 10.4 percent. Long-term capital gains till INR 1 lakh will be exempt. For example, if you earn INR 3 lakhs in combined long-term capital gains from stocks or Mutual Fund investments in a financial year. The taxable LTCGs will be INR 2 lakh (INR 3 lakh - 1 lakh) and tax liability will be INR 20,000 (10 per cent of INR 2 lakh).
Long-term capital gains are the profit arising from selling or redemption of Equity Funds held more than a year.
2. Short Term Capital Gains
If Mutual Fund units are sold before one year of holding, Short Term Capital Gains (STCGs) tax will apply. The STCGs tax has been kept unchanged at 15 percent.
| Equity Schemes | Holding Period | Tax Rate |
|---|---|---|
| Long Term Capital Gains (LTCG) | More than 1 Year | 10% (with no indexation)***** |
| Short Term Capital Gains (STCG) | Less than or equal to a year | 15% |
| Tax on Distributed Dividend | - | 10%# |
*Gains up to INR 1 lakh are free of tax. Tax at 10% applies to gains above INR 1 lakh. Earlier rate was 0% cost calculated as closing price on Jan 31, 2018. #Dividend tax of 10% + Surcharge 12% + Cess 4% =11.648% Health & Education Cess of 4% introduced. Earlier, education Cess was 3%.
Benefits of SIP Investment
Some of the important Benefits of Systematic Investment Plans are:
Rupee Cost Averaging
One of the biggest advantages that a SIP offer is Rupee Cost Averaging, which helps an individual to average out the cost of an asset purchase. While making a lump sum investment in a mutual fund a certain number of units are purchased by the investor all at once, in the case of a SIP the purchase of units is done over a long period and these are spread out equally over monthly intervals (usually). Due to the investment being spread out over time, the investment is made into the stock market at different price points giving the investor the benefit of averaging cost, hence the term rupee cost averaging.
Power of Compounding
SIPs offer the benefit of the Power of Compounding. Simple interest is when you gain interest on only the principal. In the case of compound interest, the interest amount is added to the principal, and interest is calculated on the new principal (old principal plus gains). This process continues every time. Since the mutual funds in the SIP are in instalments, they are compounded, which adds more to the initially invested sum.
Affordability
SIPs are very affordable. The monthly minimum investment amount in SIP can be as low as INR 500. Some fund houses, even offer something called a “MicroSIP” where the ticket size is as low as INR 100. This gives a good option for young people to start their long-term investment at an early stage of life.
SIP Calculator
SIP calculator can be the most useful tool in your investment. It estimates the growth for your SIP investment till the time you would want to stay invested. So, before even Investing in a fund, one can predetermine their total SIP earnings via SIP calculator. The calculators normally take inputs such as the SIP investment amount one seeks to invest, the tenure of investing, expected inflation rates (one needs to account for this). The illustration of this is given below:
Let’s suppose, if you invest INR 5,000 for 10 years, see how your SIP investment grows-
Monthly Investment: INR 5,000
Investment Period: 10 years
Total Amount Invested: INR 6,00,000
Long-term Growth Rate (approx.): 14%
Expected Returns as per SIP calculator: INR 12,46,462
Net Profit: INR 6,46,462
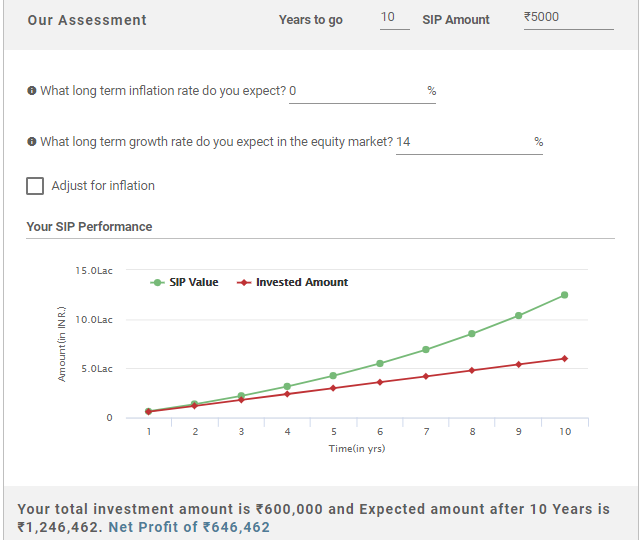
The above calculations show that if you invest INR 5,000 monthly for 10 years (a total of INR 6,00,000) you will earn INR 12,46,462 which means the net profit you make is INR 6,46,462. Isn’t it great!
All efforts have been made to ensure the information provided here is accurate. However, no guarantees are made regarding correctness of data. Please verify with scheme information document before making any investment.


AMFI Registration No. 112358 | CIN: U74999MH2016PTC282153
Shepard Technologies Pvt. Ltd. (with ARN code 112358) makes no warranties or representations, express or implied, on products offered through the platform. It accepts no liability for any damages or losses, however caused, in connection with the use of, or on the reliance of its product or related services. Terms and conditions of the website are applicable.
©2026 Shepard Technologies Private Limited. All Rights Reserved