Top 5 Mutual Funds to Invest in 2026
Mutual Funds off late have become a popular mode of investment, and many investors are inclining towards Investing in it. Mutual Funds don’t only offer good returns, but also gives a systematic opportunity to achieve Financial goals, which is of one the reason for their popularity in recent times. However, in order to achieve the desired investment goal or to earn good returns, investing in the right fund is important. That’s why we are here! Investors planning to invest in Mutual Funds, we bring you some of the Best Performing Mutual Funds that you need to consider while investing. These funds have been shortlisted by undertaking important parameters like AUM, NAV, past performances, peer average returns, information ratio, etc.
Talk to our investment specialist
Top 5 Best Performing Mutual Funds in India
Fund Selection Methodology used to find 5 funds
Best Equity Mutual Funds 2026
Fund NAV Net Assets (Cr) Min Investment Min SIP Investment 3 MO (%) 6 MO (%) 1 YR (%) 3 YR (%) 5 YR (%) 2024 (%) Information Ratio Sharpe Ratio DSP World Gold Fund Growth ₹50.1271
↓ -1.40 ₹1,433 1,000 500 -16.7 -23.5 57.5 42.3 23.2 167.1 -0.5 1.22 DSP US Flexible Equity Fund Growth ₹92.839
↓ -1.09 ₹1,291 1,000 500 7.5 16.8 44.5 26.4 18 33.8 0.15 1.93 Kotak Global Emerging Market Fund Growth ₹39.319
↑ 0.38 ₹1,767 5,000 1,000 6.9 16.2 49.5 25.1 11.3 39.1 -0.25 1.88 LIC MF Infrastructure Fund Growth ₹53.4108
↓ -0.10 ₹1,137 5,000 1,000 4 16.5 5.8 24.5 22.2 -3.7 0.58 0.22 UTI Healthcare Fund Growth ₹326.047
↓ -0.67 ₹1,308 5,000 500 14.5 21.1 9.8 24 13.9 -3.1 0.2 0.58 Note: Returns up to 1 year are on absolute basis & more than 1 year are on CAGR basis. as on 23 Jul 26 Note: Ratio's shown as on 30 Jun 26 Research Highlights & Commentary of 5 Funds showcased
Commentary DSP World Gold Fund DSP US Flexible Equity Fund Kotak Global Emerging Market Fund LIC MF Infrastructure Fund UTI Healthcare Fund Point 1 Upper mid AUM (₹1,433 Cr). Bottom quartile AUM (₹1,291 Cr). Highest AUM (₹1,767 Cr). Bottom quartile AUM (₹1,137 Cr). Lower mid AUM (₹1,308 Cr). Point 2 Established history (18+ yrs). Established history (13+ yrs). Established history (18+ yrs). Established history (18+ yrs). Oldest track record among peers (27 yrs). Point 3 Rating: 3★ (upper mid). Top rated. Rating: 3★ (lower mid). Not Rated. Rating: 1★ (bottom quartile). Point 4 Risk profile: High. Risk profile: High. Risk profile: High. Risk profile: High. Risk profile: High. Point 5 5Y return: 23.23% (top quartile). 5Y return: 17.97% (lower mid). 5Y return: 11.28% (bottom quartile). 5Y return: 22.24% (upper mid). 5Y return: 13.90% (bottom quartile). Point 6 3Y return: 42.34% (top quartile). 3Y return: 26.40% (upper mid). 3Y return: 25.09% (lower mid). 3Y return: 24.49% (bottom quartile). 3Y return: 23.98% (bottom quartile). Point 7 1Y return: 57.48% (top quartile). 1Y return: 44.48% (lower mid). 1Y return: 49.51% (upper mid). 1Y return: 5.84% (bottom quartile). 1Y return: 9.78% (bottom quartile). Point 8 Alpha: 2.12 (lower mid). Alpha: -4.10 (bottom quartile). Alpha: -1.76 (bottom quartile). Alpha: 8.41 (top quartile). Alpha: 2.15 (upper mid). Point 9 Sharpe: 1.22 (lower mid). Sharpe: 1.93 (top quartile). Sharpe: 1.88 (upper mid). Sharpe: 0.22 (bottom quartile). Sharpe: 0.58 (bottom quartile). Point 10 Information ratio: -0.50 (bottom quartile). Information ratio: 0.15 (lower mid). Information ratio: -0.25 (bottom quartile). Information ratio: 0.58 (top quartile). Information ratio: 0.20 (upper mid). DSP World Gold Fund
DSP US Flexible Equity Fund
Kotak Global Emerging Market Fund
LIC MF Infrastructure Fund
UTI Healthcare Fund
Best Debt Funds 2026
Fund NAV Net Assets (Cr) 3 MO (%) 6 MO (%) 1 YR (%) 3 YR (%) 2024 (%) Debt Yield (YTM) Mod. Duration Eff. Maturity Franklin India Ultra Short Bond Fund - Super Institutional Plan Growth ₹34.9131
↑ 0.04 ₹297 1.3 5.9 13.7 8.8 0% 1Y 15D Sundaram Short Term Debt Fund Growth ₹36.3802
↑ 0.01 ₹362 0.8 11.4 12.8 5.3 4.52% 1Y 2M 13D 1Y 7M 3D Sundaram Low Duration Fund Growth ₹28.8391
↑ 0.01 ₹550 1 10.2 11.8 5 4.19% 5M 18D 8M 1D Aditya Birla Sun Life Credit Risk Fund Growth ₹25.1903
↑ 0.00 ₹1,461 2.3 4.5 11.6 12.1 13.4 7.98% 2Y 29D 2Y 9M 4D DSP Credit Risk Fund Growth ₹54.8442
↑ 0.02 ₹275 1.8 7.8 9.9 15.9 21 7.73% 2Y 1M 28D 2Y 10M 17D Note: Returns up to 1 year are on absolute basis & more than 1 year are on CAGR basis. as on 7 Aug 22 Research Highlights & Commentary of 5 Funds showcased
Commentary Franklin India Ultra Short Bond Fund - Super Institutional Plan Sundaram Short Term Debt Fund Sundaram Low Duration Fund Aditya Birla Sun Life Credit Risk Fund DSP Credit Risk Fund Point 1 Bottom quartile AUM (₹297 Cr). Lower mid AUM (₹362 Cr). Upper mid AUM (₹550 Cr). Highest AUM (₹1,461 Cr). Bottom quartile AUM (₹275 Cr). Point 2 Established history (18+ yrs). Oldest track record among peers (23 yrs). Established history (19+ yrs). Established history (11+ yrs). Established history (23+ yrs). Point 3 Rating: 1★ (bottom quartile). Rating: 2★ (upper mid). Rating: 2★ (lower mid). Not Rated. Top rated. Point 4 Risk profile: Moderate. Risk profile: Moderately Low. Risk profile: Moderately Low. Risk profile: Moderate. Risk profile: Moderate. Point 5 1Y return: 13.69% (top quartile). 1Y return: 12.83% (upper mid). 1Y return: 11.79% (lower mid). 1Y return: 11.64% (bottom quartile). 1Y return: 9.89% (bottom quartile). Point 6 1M return: 0.59% (upper mid). 1M return: 0.20% (bottom quartile). 1M return: 0.28% (bottom quartile). 1M return: 0.77% (top quartile). 1M return: 0.47% (lower mid). Point 7 Sharpe: 2.57 (top quartile). Sharpe: 0.98 (bottom quartile). Sharpe: 0.99 (lower mid). Sharpe: 1.95 (upper mid). Sharpe: 0.76 (bottom quartile). Point 8 Information ratio: 0.00 (top quartile). Information ratio: 0.00 (upper mid). Information ratio: 0.00 (lower mid). Information ratio: 0.00 (bottom quartile). Information ratio: 0.00 (bottom quartile). Point 9 Yield to maturity (debt): 0.00% (bottom quartile). Yield to maturity (debt): 4.52% (lower mid). Yield to maturity (debt): 4.19% (bottom quartile). Yield to maturity (debt): 7.98% (top quartile). Yield to maturity (debt): 7.73% (upper mid). Point 10 Modified duration: 0.00 yrs (top quartile). Modified duration: 1.20 yrs (lower mid). Modified duration: 0.47 yrs (upper mid). Modified duration: 2.08 yrs (bottom quartile). Modified duration: 2.16 yrs (bottom quartile). Franklin India Ultra Short Bond Fund - Super Institutional Plan
Sundaram Short Term Debt Fund
Sundaram Low Duration Fund
Aditya Birla Sun Life Credit Risk Fund
DSP Credit Risk Fund
Best Hybrid Funds 2026
Fund NAV Net Assets (Cr) 3 MO (%) 6 MO (%) 1 YR (%) 3 YR (%) 5 YR (%) 2024 (%) BOI AXA Mid and Small Cap Equity and Debt Fund Growth ₹41.61
↑ 0.05 ₹1,695 3.8 13.9 7.9 17.8 13.7 -0.9 Sundaram Equity Hybrid Fund Growth ₹135.137
↑ 0.78 ₹1,954 0.5 10.5 27.1 16 14.2 SBI Multi Asset Allocation Fund Growth ₹66.1442
↓ -0.09 ₹19,354 1.2 0 10.1 15.2 13 18.6 ICICI Prudential Multi-Asset Fund Growth ₹803.186
↓ -3.58 ₹84,991 -0.6 -0.7 5.2 15 16.9 18.6 UTI Multi Asset Fund Growth ₹77.8855
↓ -0.14 ₹6,890 1 -1.4 4.8 14.9 13 11.1 Note: Returns up to 1 year are on absolute basis & more than 1 year are on CAGR basis. as on 24 Jul 26 Research Highlights & Commentary of 5 Funds showcased
Commentary BOI AXA Mid and Small Cap Equity and Debt Fund Sundaram Equity Hybrid Fund SBI Multi Asset Allocation Fund ICICI Prudential Multi-Asset Fund UTI Multi Asset Fund Point 1 Bottom quartile AUM (₹1,695 Cr). Bottom quartile AUM (₹1,954 Cr). Upper mid AUM (₹19,354 Cr). Highest AUM (₹84,991 Cr). Lower mid AUM (₹6,890 Cr). Point 2 Established history (10+ yrs). Oldest track record among peers (26 yrs). Established history (20+ yrs). Established history (23+ yrs). Established history (17+ yrs). Point 3 Not Rated. Rating: 2★ (upper mid). Top rated. Rating: 2★ (lower mid). Rating: 1★ (bottom quartile). Point 4 Risk profile: Moderately High. Risk profile: Moderately High. Risk profile: Moderate. Risk profile: Moderately High. Risk profile: Moderately High. Point 5 5Y return: 13.75% (lower mid). 5Y return: 14.20% (upper mid). 5Y return: 13.00% (bottom quartile). 5Y return: 16.94% (top quartile). 5Y return: 13.04% (bottom quartile). Point 6 3Y return: 17.78% (top quartile). 3Y return: 16.03% (upper mid). 3Y return: 15.23% (lower mid). 3Y return: 15.02% (bottom quartile). 3Y return: 14.90% (bottom quartile). Point 7 1Y return: 7.91% (lower mid). 1Y return: 27.10% (top quartile). 1Y return: 10.09% (upper mid). 1Y return: 5.24% (bottom quartile). 1Y return: 4.78% (bottom quartile). Point 8 1M return: -0.19% (bottom quartile). 1M return: 1.80% (top quartile). 1M return: -0.61% (bottom quartile). 1M return: 0.25% (upper mid). 1M return: 0.10% (lower mid). Point 9 Alpha: 0.00 (upper mid). Alpha: 5.81 (top quartile). Alpha: 0.00 (lower mid). Alpha: 0.00 (bottom quartile). Alpha: 0.00 (bottom quartile). Point 10 Sharpe: 0.17 (lower mid). Sharpe: 2.64 (top quartile). Sharpe: 0.53 (upper mid). Sharpe: 0.01 (bottom quartile). Sharpe: -0.11 (bottom quartile). BOI AXA Mid and Small Cap Equity and Debt Fund
Sundaram Equity Hybrid Fund
SBI Multi Asset Allocation Fund
ICICI Prudential Multi-Asset Fund
UTI Multi Asset Fund
Best Gold Mutual Funds 2026
Fund NAV Net Assets (Cr) 3 MO (%) 6 MO (%) 1 YR (%) 3 YR (%) 5 YR (%) 2024 (%) DSP World Gold Fund Growth ₹50.1271
↓ -1.40 ₹1,433 -16.7 -23.5 57.5 42.3 23.2 167.1 SBI Gold Fund Growth ₹41.5386
↓ -0.29 ₹15,294 -4.9 -7.6 43.2 32.3 23.1 71.5 Aditya Birla Sun Life Gold Fund Growth ₹41.2433
↓ -0.31 ₹1,648 -4.8 -7.7 43.4 32.2 22.8 72 ICICI Prudential Regular Gold Savings Fund Growth ₹43.8748
↓ -0.31 ₹6,265 -5 -7.9 42.8 32.2 23 72 HDFC Gold Fund Growth ₹42.3273
↓ -0.31 ₹11,019 -4.9 -7.9 42.7 32.2 22.9 71.3 Note: Returns up to 1 year are on absolute basis & more than 1 year are on CAGR basis. as on 23 Jul 26 Research Highlights & Commentary of 5 Funds showcased
Commentary DSP World Gold Fund SBI Gold Fund Aditya Birla Sun Life Gold Fund ICICI Prudential Regular Gold Savings Fund HDFC Gold Fund Point 1 Bottom quartile AUM (₹1,433 Cr). Highest AUM (₹15,294 Cr). Bottom quartile AUM (₹1,648 Cr). Lower mid AUM (₹6,265 Cr). Upper mid AUM (₹11,019 Cr). Point 2 Oldest track record among peers (18 yrs). Established history (14+ yrs). Established history (14+ yrs). Established history (14+ yrs). Established history (14+ yrs). Point 3 Top rated. Rating: 2★ (lower mid). Rating: 3★ (upper mid). Rating: 1★ (bottom quartile). Rating: 1★ (bottom quartile). Point 4 Risk profile: High. Risk profile: Moderately High. Risk profile: Moderately High. Risk profile: Moderately High. Risk profile: Moderately High. Point 5 5Y return: 23.23% (top quartile). 5Y return: 23.10% (upper mid). 5Y return: 22.79% (bottom quartile). 5Y return: 22.98% (lower mid). 5Y return: 22.89% (bottom quartile). Point 6 3Y return: 42.34% (top quartile). 3Y return: 32.32% (upper mid). 3Y return: 32.23% (lower mid). 3Y return: 32.20% (bottom quartile). 3Y return: 32.18% (bottom quartile). Point 7 1Y return: 57.48% (top quartile). 1Y return: 43.17% (lower mid). 1Y return: 43.43% (upper mid). 1Y return: 42.83% (bottom quartile). 1Y return: 42.66% (bottom quartile). Point 8 Alpha: 2.12 (top quartile). 1M return: 0.28% (upper mid). 1M return: 0.25% (bottom quartile). 1M return: 0.33% (top quartile). 1M return: 0.27% (lower mid). Point 9 Sharpe: 1.22 (bottom quartile). Alpha: 0.00 (upper mid). Alpha: 0.00 (lower mid). Alpha: 0.00 (bottom quartile). Alpha: 0.00 (bottom quartile). Point 10 Information ratio: -0.50 (bottom quartile). Sharpe: 1.29 (top quartile). Sharpe: 1.20 (bottom quartile). Sharpe: 1.22 (lower mid). Sharpe: 1.28 (upper mid). DSP World Gold Fund
SBI Gold Fund
Aditya Birla Sun Life Gold Fund
ICICI Prudential Regular Gold Savings Fund
HDFC Gold Fund
Mutual Fund Types: Risk and Return
Before you invest, know the basic risk and average returns of the following Mutual Fund categories:
| Mutual Fund Category | Average Return | Risk | Type of Risk |
|---|---|---|---|
| Equity Funds | 2%-20% | High to Moderate | Volatility Risk, Performance Risk, Concentration Risk |
| Debt/Bonds | 8-14% | Low to Moderate | Interest Rate Risk, Credit Risk |
| Money market funds | 4%-8% | Low | Inflation Risk, Opportunity Loss |
| Balanced Fund | 5-15% | Moderate | Higher exposure to Equity, Debt Holdings |
Mutual Fund Calculator: Pre-Determine Your Investment Returns
A sip calculator is a smart tool that solves major queries of investors like ‘how much to invest’, ‘how much would I earn’, ‘how much would be my profit’, etc. A mutual fund calculator, more specifically, SIP calculator pre-determines your investment amount for the tenure you would like to invest for. It is also one of the best tools for effective financial planning. Whether one wants to plan to buy a car, house, plan for retirement, a child's higher education or any other financial goal, the SIP calculator can be used for the same. Here’s how the calculator works:
Illustration:
Monthly Investment: ₹ 2,000
Investment Period: 10 years
Total Amount Invested: ₹ 2,40,000
Long-term Inflation: 5% (approx)
Long-term Growth Rate: 14% (approx)
Expected Returns as per SIP Calculator: ₹ 4,98,585
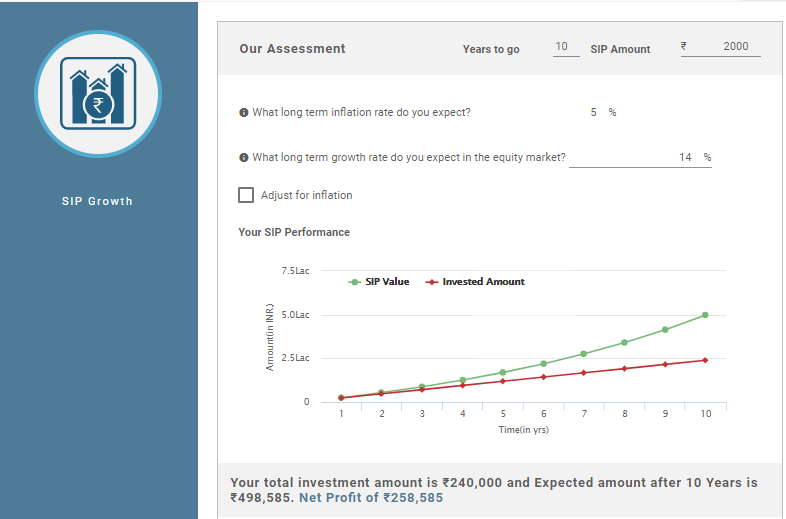
All you need to do in a SIP calculator is enter some basic inputs like investment amount and period of investing (additional inputs like inflation and expected market returns will give a more realistic picture). The output of these entries would be the final amount at maturity and gains made.
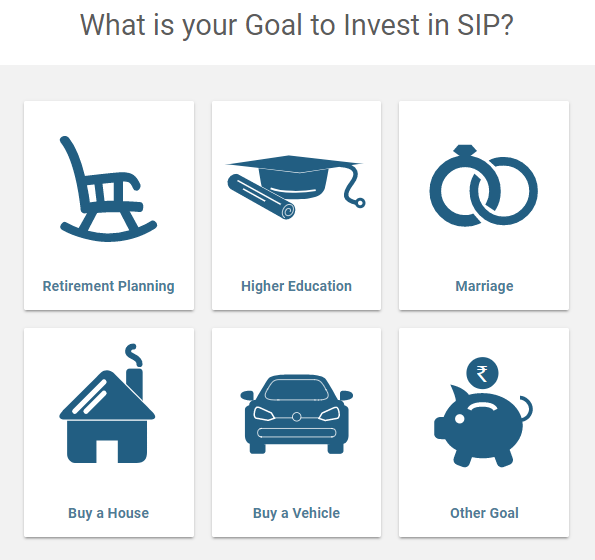
A similar calculation with a goal in mind can also be made to determine the amount one should invest to reach the goal. You have to choose a particular goal, like the ones below, and estimate the details using the goal calculator.
All efforts have been made to ensure the information provided here is accurate. However, no guarantees are made regarding correctness of data. Please verify with scheme information document before making any investment.


AMFI Registration No. 112358 | CIN: U74999MH2016PTC282153
Shepard Technologies Pvt. Ltd. (with ARN code 112358) makes no warranties or representations, express or implied, on products offered through the platform. It accepts no liability for any damages or losses, however caused, in connection with the use of, or on the reliance of its product or related services. Terms and conditions of the website are applicable.
©2026 Shepard Technologies Private Limited. All Rights Reserved