
 +91-22-48913909
SIPs بمقابلہ یکمشت
SIPs بمقابلہ یکمشتسرمایہ کاری? مختلف مضامین ہیں جو کہتے ہیں کہ منظم سرمایہ کاری کے منصوبے (یا SIPs) اس کے لیے بہترین راستہ ہیں۔میوچل فنڈز میں سرمایہ کاری. مختلفگھونٹ کیلکولیٹر آپ کو اس مقصد کے لیے منصوبہ بندی کرنے میں مدد کرتے ہیں، بہت سی ویب سائٹس، اور مالیاتی منصوبہ ساز بھی اس کی وکالت کریں گے۔ٹاپ ایس آئی پی سرمایہ کاری کرنے کا ارادہ رکھتا ہے۔ زیادہ تر روپے کی لاگت کی اوسط اور SIPs کے فوائد کے بارے میں بات کریں گے، یہ بتاتے ہوئے کہ اسٹاک میں شامل ہونامارکیٹ یکمشت سرمایہ کاری بہترین طریقہ نہیں ہو سکتا۔ اگرچہ کوئی شخص ایس آئی پی کے لیے بہترین میوچل فنڈ میں داخل ہو سکتا ہے، کیا کوئی ایس آئی پی کو سرمایہ کاری کے موڈ کے طور پر استعمال کرکے یکمشت سرمایہ کاری سے بہتر منافع کی توقع کر سکتا ہے؟
SIPs یا یکمشت: وقت کے لیے سرمایہ کاری کریں۔
سرمایہ کاری ہمیشہ واپسی پیدا کرنے کی صلاحیت کے بارے میں ہوتی ہے۔ چاہے یہ یکمشت سرمایہ کاری ہو یا منظمسرمایہ کاری کا منصوبہ، کسی کو ہوشیار رہنے اور درست فیصلے کرنے کی ضرورت ہے۔ میں سرمایہ کاری کرناباہمی چندہ ہمیشہ منتخب کرنے کے بارے میں نہیں ہےبہترین باہمی فنڈز یا پھربہترین SIP پلانز. اور بھی بہت کچھ ہے جس پر غور کرنے کی ضرورت ہے۔ خاص طور پر، اگر کوئی ایکویٹی مارکیٹ میں سرمایہ کاری کرنے کے بارے میں سوچ رہا ہے، تو اسے اور بھی زیادہ محتاط رہنے کی ضرورت ہے۔ اسٹاک مارکیٹ کا تجزیہ (بی ایس ای سینسیکس کو بینچ مارک کے طور پر لینا) سے پتہ چلتا ہے کہ اگر کوئی طویل مدت تک سرمایہ کاری کرتا رہے تو منافع کمانے کا امکان بڑھ جاتا ہے۔ جیسا کہ نیچے دیے گئے جدول سے دیکھا جا سکتا ہے، اگر کوئی صرف نمبروں کے حساب سے جاتا ہے، تو اس بات کا 30% امکان ہے کہ اگر آپ اسٹاک مارکیٹ میں صرف 1 سال تک سرمایہ کاری کرنے کا ارادہ رکھتے ہیں تو آپ کو نقصان ہو سکتا ہے۔
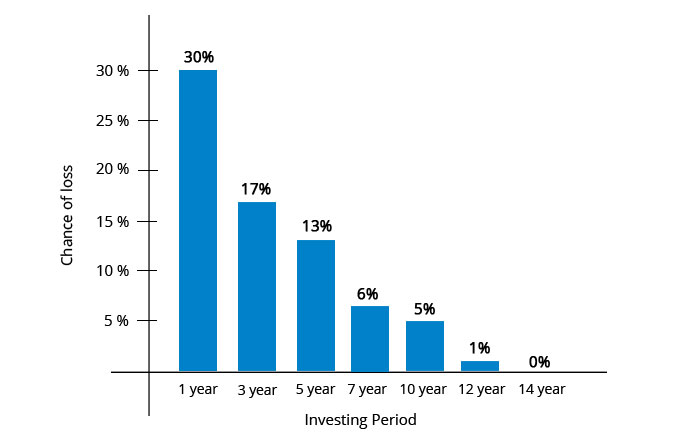
لہذا زیادہ تر مشیر جب ایکویٹی سرمایہ کاری کے بارے میں بات کرتے ہیں تو ہمیشہ اس سے متعلق ہوتے ہیں۔ایکوئٹیز "طویل مدتی سرمایہ کاری" کے ساتھ۔ اگر کوئی 5 سال تک سرمایہ کاری میں رہنے کا ارادہ رکھتا ہے تو نقصان کا امکان 13% تک گر جاتا ہے۔ اور اگر کوئی واقعی طویل مدتی (10 سال سے زیادہ) ہے، تو نقصان کرنے کی صلاحیت صفر کی طرف مائل ہوتی ہے۔ لہذا، اگر کوئی واقعی اسٹاک مارکیٹ سے پیسہ کمانے میں دلچسپی رکھتا ہے، تو یہ اسٹاک مارکیٹ میں وقت گزارنے کے بارے میں ہے۔ (وقت کو نشان زد کرنے کے بجائے!)
SIPs یا یکمشت: ایک تجزیہ
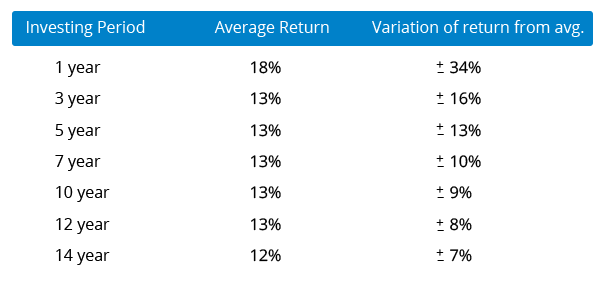
یہ بالکل واضح ہے کہ ایکویٹی مارکیٹ میں سرمایہ کاری ایک طویل مدتی کھیل ہے۔ بہت سے لوگ اس بات کی وکالت کرتے ہیں کہ SIPs کے فوائد روپے کی لاگت سے لے کر نظم و ضبط کی سرمایہ کاری تک پھیلے ہوئے ہیں، لیکن ایک بڑا سوال ہے جس کا جواب دینا ہے، کیا SIPs یکمشت سرمایہ کاری سے بہتر منافع فراہم کرتے ہیں؟
ہم نے 1979 سے (بی ایس ای سینسیکس کے آغاز سے) ایکویٹی مارکیٹوں کو دیکھ کر اس سوال کی گہری سمجھ حاصل کرنے کی کوشش کی۔ بی ایس ای سینسیکس ہندوستان میں سرفہرست 30 کمپنیوں کا ایک مجموعہ ہے اور ایکویٹی مارکیٹ کی نمائندگی کرتا ہے۔ اس ڈیٹا کا تجزیہ کرتے ہوئے، ہم یہ دیکھنے کے لیے کچھ بصیرت حاصل کر سکتے ہیں کہ آیا SIPs یا یکمشت، جو بہتر ہے۔
Talk to our investment specialist
اسٹاک مارکیٹ کے بدترین ادوار
سرمایہ کاری شروع کرنے کا بدترین دور ستمبر 1994 کے آس پاس تھا (یہ وہ وقت تھا جب اسٹاک مارکیٹ عروج پر تھی)۔ درحقیقت، اگر کوئی مارکیٹ کے اعداد و شمار کو دیکھتا ہے۔سرمایہ کار جس نے یکمشت رقم کی سرمایہ کاری کی تھی وہ 59 مہینوں (تقریباً 5 سال!) تک منفی منافع پر بیٹھا تھا۔ تقریباً جولائی 1999 میں سرمایہ کار نے توڑ دیا۔ مزید 4 سال تک تکلیف اٹھانے کے بعد (منفی منافع کے ساتھ) اور سرمایہ کار بالآخر اکتوبر 2003 میں مثبت ہو گیا۔
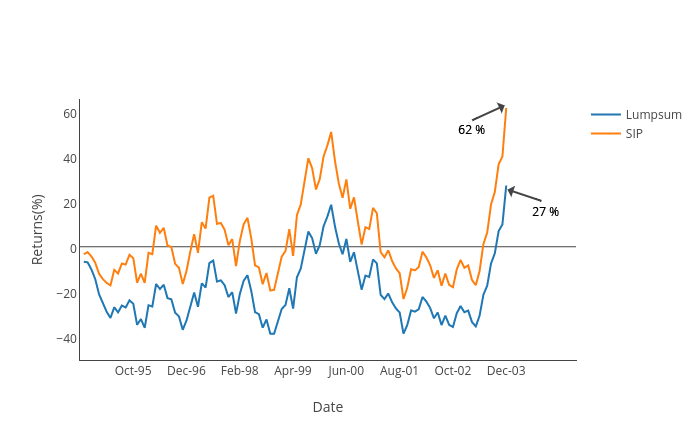
SIP سرمایہ کار کے ساتھ کیا ہوا؟ سیسٹیمیٹک انویسٹمنٹ پلان سرمایہ کار صرف 19 مہینوں کے لیے منفی تھا اور اس نے منافع پوسٹ کرنا شروع کیا، تاہم، یہ قلیل المدتی تھے۔ ایس آئی پی کے سرمایہ کار عبوری نقصان اٹھانے کے بعد مئی 1999 تک دوبارہ بڑھ گئے۔ جب کہ سفر اب بھی متزلزل رہا، SIP سرمایہ کاروں نے پورٹ فولیو میں بہت پہلے منافع ظاہر کیا۔ یکمشت سرمایہ کار کے لیے زیادہ سے زیادہ نقصان تقریباً 40% تھا، جب کہ SIP سرمایہ کار کے لیے 23% تھا۔ منظم سرمایہ کاری کے منصوبے کے سرمایہ کار کے پاس تیزی سے بحالی کی مدت کے ساتھ ساتھ پورٹ فولیو میں کم نقصان تھا۔
سرمایہ کاری شروع کرنے کا ایک اور انتہائی اداس دور مارچ 2000 کے آس پاس تھا (یہ وہ وقت تھا جب اسٹاک مارکیٹ دوبارہ عروج پر تھی!) درحقیقت، اگر کوئی مارکیٹ کے اعداد و شمار پر نظر ڈالتا ہے تو جس سرمایہ کار نے یکمشت رقم کی سرمایہ کاری کی تھی وہ 45 ماہ تک منفی واپسی پر بیٹھا (تقریباً 4 سال!)۔ سرمایہ کار تقریباً 2003 کے دسمبر میں بھی ٹوٹ گیا۔ اگلے سال اگرچہ کچھ ریٹرن پیدا ہوئے، لیکن 2004 میں دوبارہ پھسل جانے کی وجہ سے یہ ریٹرن قلیل مدتی رہے۔ مزید 1 سال تک جھیلنے کے بعد، سرمایہ کار بالآخر ستمبر 2004 میں مثبت ہو گیا۔ یکمشت سرمایہ کاری کرنے کا ایک اور برا وقت تھا۔
SIP سرمایہ کار کی کہانی کیا تھی جس نے مارچ 2000 میں سرمایہ کاری شروع کی؟ اگر کسی نے ماہانہ مساوی رقم کی سرمایہ کاری کی، تو سرمایہ کار جون 2003 میں مثبت تھا اور ستمبر 2004 تک، پورٹ فولیو میں مجموعی طور پر 45 فیصد اضافہ ہوا۔ (جب یکمشت سرمایہ کار بھی ٹوٹ رہا تھا)۔ ایک اور پہلو جس پر غور کرنا ہے وہ ہے زیادہ سے زیادہ نقصان، یکمشت سرمایہ کار کو ستمبر 2001 تک تقریباً 50% نقصان ہوا ہے، اس کے مقابلے میں SIP پورٹ فولیو کا نقصان اسی وقت 28% تھا۔
ہم اوپر سے جو حاصل کر سکتے ہیں وہ یہ ہے کہ جب سٹاک مارکیٹ خراب مدت میں ہوتی ہے تو SIP میں رہنا ہمیشہ بہتر ہوتا ہے کیونکہ ریکوری تیز ہوتی ہے اور پورٹ فولیو میں بھی کم نقصان ہوتا ہے۔
اسٹاک مارکیٹ کے بہترین ادوار
اسٹاک مارکیٹ کے 1979 سے 2016 تک کے پچھلے 37 سالوں کے اعداد و شمار پر نظر ڈالتے ہوئے، ایک یہ سمجھتا ہے کہ اگر کسی نے ابتدائی سرمایہ کاری (1979 - BSE سینسیکس کے آغاز کے وقت) کی، تو شاید ہی کسی نے پورٹ فولیو میں کوئی منفی منافع دیکھا ہو۔
اگست 1979 کے 5 سالہ تجزیے سے پتہ چلتا ہے کہ یکمشت رقم اور نظامی سرمایہ کاری کی منصوبہ بندی کے پورٹ فولیوز نے وہاں سے کسی بھی مدت میں شاید ہی کوئی نقصان پہنچایا ہو۔ جیسا کہ کوئی نیچے کے گراف سے دیکھ سکتا ہے، دونوں محکموں نے سال بہ سال شاندار منافع پوسٹ کیا۔ ہر سال کے اختتام پر، یکمشت پورٹ فولیو نے SIP پورٹ فولیو کو پیچھے چھوڑ دیا اور لیڈ مارجن میں بھی اضافہ کیا۔
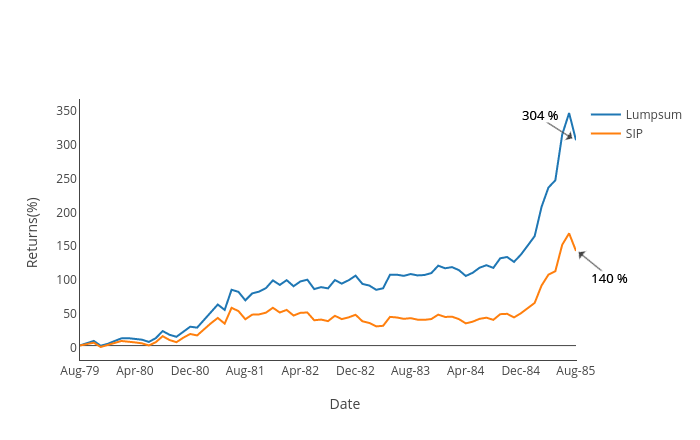
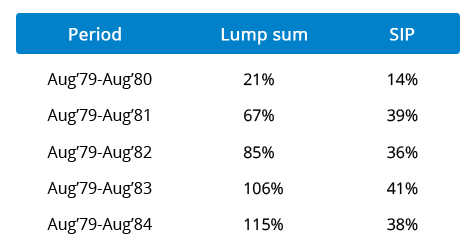
لہذا، اگر مارکیٹ کے ایک طرف بڑھنے کی توقع کی جاتی ہے، تو یکمشت ہمیشہ بہتر آپشن ہوتا ہے۔
بہتر سرمایہ کاری موڈ کون سا ہے؟
جب کہ ہم اسٹاک مارکیٹ کے تمام ادوار کا تجزیہ کر سکتے ہیں، کیا ہم واقعی یہ فیصلہ کر سکتے ہیں کہ کون سا بہتر ہے؟ اس کا جواب انفرادی طور پر مختلف ہوتا ہے،نقدی بہاؤسرمایہ کاری (یا ہولڈنگ) کی مدت، باہر جانے والے نقد بہاؤ یا ضروریات وغیرہ۔ بچت کی عادت ڈالنے کے لیے SIPs ایک بہترین ذریعہ ہیں، یہ افراد کی سرمایہ کاری کو اسٹاک مارکیٹ میں منتقل کرتے ہیں۔ اگر آپ ایکویٹیز میں سرمایہ کاری کرنے کا ارادہ رکھتے ہیں تو کسی کو طویل مدتی کے لیے سرمایہ کاری کا منصوبہ بھی بنانا ہوگا، جہاں ہم واضح طور پر جانتے ہیں کہ وقت کے ساتھ ساتھ منافع پیدا کرنے کی صلاحیت میں اضافہ ہوتا ہے۔ اس کے علاوہ، اگر کسی کو لگتا ہے کہ بازار کٹے ہوئے ہیں نہ کہ سیدھی لائن، تو پھر SIPs مارکیٹ میں داخل ہونے کا ایک بہترین ذریعہ ہیں۔ مزید برآں، ڈیٹا سے پتہ چلتا ہے کہ SIPs اس بات کو بھی یقینی بناتے ہیں کہ سرمایہ کار کو کسی بھی وقت کم نقصان کا سامنا کرنا پڑے۔
اگر یہ محسوس ہوتا ہے کہ مارکیٹ سیکولر ہوگی (ایک طرف!) اس صورت حال میں، یکمشت سرمایہ کاری ہی راستہ ہوگا۔
ہندوستان میں بہترین کارکردگی کا مظاہرہ کرنے والے SIP پلان 2022
The primary investment objective of the Scheme is to seek to provide long term capital growth by investing predominantly in the JPMorgan Funds - Emerging Markets Opportunities Fund, an equity fund which invests primarily in an aggressively managed portfolio of emerging market companies Below is the key information for Edelweiss Emerging Markets Opportunities Equity Off-shore Fund Returns up to 1 year are on The primary investment objective of the Scheme is to seek capital appreciation by investing predominantly in the units of BlackRock Global Funds – World Mining Fund. The Scheme may, at the discretion of the Investment Manager, also invest in the units of other similar overseas mutual fund schemes, which may
constitute a significant part of its corpus. The Scheme may also invest a certain portion of its corpus in money market securities and/or money market/liquid schemes of DSP BlackRock Mutual Fund, in order to meet liquidity requirements from time to time. Research Highlights for DSP World Mining Fund Below is the key information for DSP World Mining Fund Returns up to 1 year are on The primary investment objective of the Scheme is to seek capital appreciation by investing predominantly in units of BGF – USFEF. The Scheme may, at the discretion of the Investment Manager also invest in the units of other similar overseas mutual fund schemes, which may constitute a significant part of its corpus. The Scheme may also invest a certain portion of its corpus in money market securities and/or money market/liquid schemes of DSP BlackRock Mutual Fund, in order to meet liquidity requirements from time to time. However, there is no assurance that the investment objective of the Scheme will be realized. It shall be noted ‘similar overseas mutual fund schemes’ shall have investment objective, investment strategy and risk profile/consideration similar to those of BGF – USFEF. Research Highlights for DSP US Flexible Equity Fund Below is the key information for DSP US Flexible Equity Fund Returns up to 1 year are on The investment objective of the scheme is to provide long-term capital appreciation by investing in an overseas mutual fund scheme that invests in a diversified portfolio of securities as prescribed by SEBI from time to time in global emerging markets. Research Highlights for Kotak Global Emerging Market Fund Below is the key information for Kotak Global Emerging Market Fund Returns up to 1 year are on The primary objective of the Scheme will be to generate capital appreciation by investing predominantly in a diversified portfolio of equity and equity related securities of growth oriented mid cap stocks. However, there is no assurance or guarantee that the investment objective of the Scheme will be realized. Research Highlights for Baroda Pioneer Mid-Cap Fund Below is the key information for Baroda Pioneer Mid-Cap Fund Returns up to 1 year are on 1. Edelweiss Emerging Markets Opportunities Equity Off-shore Fund
Edelweiss Emerging Markets Opportunities Equity Off-shore Fund
Growth Launch Date 7 Jul 14 NAV (14 Oct 26) ₹27.5481 ↓ -0.21 (-0.74 %) Net Assets (Cr) ₹275 on 31 Aug 26 Category Equity - Global AMC Edelweiss Asset Management Limited Rating ☆☆☆ Risk High Expense Ratio 1.44 Sharpe Ratio 1.8 Information Ratio -0.37 Alpha Ratio 4.19 Min Investment 5,000 Min SIP Investment 1,000 Exit Load 0-1 Years (1%),1 Years and above(NIL) Growth of 10,000 investment over the years.
Date Value 30 Sep 21 ₹10,000 30 Sep 22 ₹7,237 30 Sep 23 ₹7,991 30 Sep 24 ₹9,608 30 Sep 25 ₹11,929 30 Sep 26 ₹17,049 Returns for Edelweiss Emerging Markets Opportunities Equity Off-shore Fund
absolute basis & more than 1 year are on CAGR (Compound Annual Growth Rate) basis. as on 14 Oct 26 Duration Returns 1 Month -3.3% 3 Month -2.5% 6 Month 9.9% 1 Year 40.5% 3 Year 27.6% 5 Year 10% 10 Year 15 Year Since launch 8.6% Historical performance (Yearly) on absolute basis
Year Returns 2025 41.1% 2024 5.9% 2023 5.5% 2022 -16.8% 2021 -5.9% 2020 21.7% 2019 25.1% 2018 -7.2% 2017 30% 2016 9.8% Fund Manager information for Edelweiss Emerging Markets Opportunities Equity Off-shore Fund
Name Since Tenure Bhavesh Jain 9 Apr 18 8.4 Yr. Bharat Lahoti 1 Oct 21 4.92 Yr. Data below for Edelweiss Emerging Markets Opportunities Equity Off-shore Fund as on 31 Aug 26
Equity Sector Allocation
Sector Value Technology 36.75% Financial Services 23.82% Consumer Cyclical 9.38% Communication Services 6.79% Industrials 6.01% Energy 3.77% Basic Materials 2.33% Consumer Defensive 2.2% Utility 2% Health Care 0.51% Asset Allocation
Asset Class Value Cash 5.17% Equity 94.83% Debt 0% Top Securities Holdings / Portfolio
Name Holding Value Quantity JPM Emerging Mkts Opps I acc USD
Investment Fund | -96% ₹264 Cr 114,732
↑ 2,676 Clearing Corporation Of India Ltd.
CBLO/Reverse Repo | -4% ₹11 Cr Net Receivables/(Payables)
CBLO | -0% ₹0 Cr Accrued Interest
CBLO | -0% ₹0 Cr 2. DSP World Mining Fund
DSP World Mining Fund
Growth Launch Date 29 Dec 09 NAV (14 Oct 26) ₹31.2407 ↓ -0.94 (-2.93 %) Net Assets (Cr) ₹195 on 31 Aug 26 Category Equity - Global AMC DSP BlackRock Invmt Managers Pvt. Ltd. Rating ☆☆☆ Risk High Expense Ratio 1.14 Sharpe Ratio 1.76 Information Ratio 0 Alpha Ratio 0 Min Investment 1,000 Min SIP Investment 500 Exit Load 0-12 Months (1%),12 Months and above(NIL) Growth of 10,000 investment over the years.
Date Value 30 Sep 21 ₹10,000 30 Sep 22 ₹10,135 30 Sep 23 ₹11,850 30 Sep 24 ₹13,690 30 Sep 25 ₹17,513 30 Sep 26 ₹25,041 Returns for DSP World Mining Fund
absolute basis & more than 1 year are on CAGR (Compound Annual Growth Rate) basis. as on 14 Oct 26 Duration Returns 1 Month -10.5% 3 Month 2.2% 6 Month -5.5% 1 Year 34% 3 Year 28.2% 5 Year 16.9% 10 Year 15 Year Since launch 7% Historical performance (Yearly) on absolute basis
Year Returns 2025 79% 2024 -8.1% 2023 0% 2022 12.2% 2021 18% 2020 34.9% 2019 21.5% 2018 -9.4% 2017 21.1% 2016 49.7% Fund Manager information for DSP World Mining Fund
Name Since Tenure Kaivalya Nadkarni 1 May 25 1.34 Yr. Data below for DSP World Mining Fund as on 31 Aug 26
Equity Sector Allocation
Sector Value Basic Materials 94.51% Energy 0.85% Asset Allocation
Asset Class Value Cash 4.64% Equity 95.36% Debt 0% Top Securities Holdings / Portfolio
Name Holding Value Quantity BGF World Mining I2
Investment Fund | -96% ₹187 Cr 139,088
↓ -1,946 Treps / Reverse Repo Investments
CBLO/Reverse Repo | -4% ₹8 Cr Net Receivables/Payables
Net Current Assets | -0% ₹0 Cr 3. DSP US Flexible Equity Fund
DSP US Flexible Equity Fund
Growth Launch Date 3 Aug 12 NAV (14 Oct 26) ₹93.3268 ↓ -0.74 (-0.79 %) Net Assets (Cr) ₹1,270 on 31 Aug 26 Category Equity - Global AMC DSP BlackRock Invmt Managers Pvt. Ltd. Rating ☆☆☆☆☆ Risk High Expense Ratio 1.55 Sharpe Ratio 1.42 Information Ratio -0.07 Alpha Ratio -7.01 Min Investment 1,000 Min SIP Investment 500 Exit Load 0-12 Months (1%),12 Months and above(NIL) Growth of 10,000 investment over the years.
Date Value 30 Sep 21 ₹10,000 30 Sep 22 ₹9,295 30 Sep 23 ₹11,197 30 Sep 24 ₹13,853 30 Sep 25 ₹17,875 30 Sep 26 ₹23,358 Returns for DSP US Flexible Equity Fund
absolute basis & more than 1 year are on CAGR (Compound Annual Growth Rate) basis. as on 14 Oct 26 Duration Returns 1 Month 0% 3 Month -1.1% 6 Month 13.5% 1 Year 33.4% 3 Year 27.5% 5 Year 18% 10 Year 15 Year Since launch 17% Historical performance (Yearly) on absolute basis
Year Returns 2025 33.8% 2024 17.8% 2023 22% 2022 -5.9% 2021 24.2% 2020 22.6% 2019 27.5% 2018 -1.1% 2017 15.5% 2016 9.8% Fund Manager information for DSP US Flexible Equity Fund
Name Since Tenure Kaivalya Nadkarni 1 May 25 1.34 Yr. Data below for DSP US Flexible Equity Fund as on 31 Aug 26
Equity Sector Allocation
Sector Value Technology 32.91% Industrials 12.97% Communication Services 11.37% Consumer Cyclical 9.78% Financial Services 9.58% Health Care 9.41% Energy 2.81% Basic Materials 2.31% Utility 2.1% Consumer Defensive 0.65% Asset Allocation
Asset Class Value Cash 6.12% Equity 93.87% Debt 0.01% Top Securities Holdings / Portfolio
Name Holding Value Quantity BGF US Flexible Equity I2
Investment Fund | -96% ₹1,220 Cr 1,784,131 Treps / Reverse Repo Investments
CBLO/Reverse Repo | -4% ₹52 Cr Net Receivables/Payables
Net Current Assets | -0% -₹2 Cr 4. Kotak Global Emerging Market Fund
Kotak Global Emerging Market Fund
Growth Launch Date 26 Sep 07 NAV (14 Oct 26) ₹38.043 ↓ -0.21 (-0.56 %) Net Assets (Cr) ₹1,730 on 31 Aug 26 Category Equity - Global AMC Kotak Mahindra Asset Management Co Ltd Rating ☆☆☆ Risk High Expense Ratio 1.64 Sharpe Ratio 1.39 Information Ratio -0.83 Alpha Ratio -6.2 Min Investment 5,000 Min SIP Investment 1,000 Exit Load 0-1 Years (1%),1 Years and above(NIL) Growth of 10,000 investment over the years.
Date Value 30 Sep 21 ₹10,000 30 Sep 22 ₹7,972 30 Sep 23 ₹8,771 30 Sep 24 ₹10,660 30 Sep 25 ₹13,233 30 Sep 26 ₹17,897 Returns for Kotak Global Emerging Market Fund
absolute basis & more than 1 year are on CAGR (Compound Annual Growth Rate) basis. as on 14 Oct 26 Duration Returns 1 Month -5.1% 3 Month -2.2% 6 Month 8.8% 1 Year 30.5% 3 Year 24.9% 5 Year 10.6% 10 Year 15 Year Since launch 7.3% Historical performance (Yearly) on absolute basis
Year Returns 2025 39.1% 2024 5.9% 2023 10.8% 2022 -15% 2021 -0.5% 2020 29.1% 2019 21.4% 2018 -14.4% 2017 30.4% 2016 -1.2% Fund Manager information for Kotak Global Emerging Market Fund
Name Since Tenure Arjun Khanna 9 May 19 7.32 Yr. Data below for Kotak Global Emerging Market Fund as on 31 Aug 26
Equity Sector Allocation
Sector Value Technology 38.58% Financial Services 21.65% Consumer Cyclical 8.14% Industrials 8.03% Basic Materials 7.19% Communication Services 5.09% Energy 4.9% Health Care 2.46% Asset Allocation
Asset Class Value Cash 3.97% Equity 96.03% Top Securities Holdings / Portfolio
Name Holding Value Quantity CI Emerging Markets Class I
Investment Fund | -98% ₹1,695 Cr 4,595,108
↑ 4,595,108 Triparty Repo
CBLO/Reverse Repo | -2% ₹37 Cr Net Current Assets/(Liabilities)
Net Current Assets | -0% -₹3 Cr CI Emerging Markets Class A
Investment Fund | -₹0 Cr 00
↓ -4,597,762 5. Baroda Pioneer Mid-Cap Fund
Baroda Pioneer Mid-Cap Fund
Growth Launch Date 4 Oct 10 NAV (11 Mar 22) ₹16.5124 ↑ 0.15 (0.91 %) Net Assets (Cr) ₹97 on 31 Jan 22 Category Equity - Mid Cap AMC Baroda Pioneer Asset Management Co. Ltd. Rating ☆ Risk High Expense Ratio 2.54 Sharpe Ratio 3.23 Information Ratio 0 Alpha Ratio 0 Min Investment 5,000 Min SIP Investment 500 Exit Load 0-365 Days (1%),365 Days and above(NIL) Growth of 10,000 investment over the years.
Date Value Returns for Baroda Pioneer Mid-Cap Fund
absolute basis & more than 1 year are on CAGR (Compound Annual Growth Rate) basis. as on 14 Oct 26 Duration Returns 1 Month -3.8% 3 Month -8.1% 6 Month 0.1% 1 Year 26.2% 3 Year 22.5% 5 Year 15.9% 10 Year 15 Year Since launch 4.5% Historical performance (Yearly) on absolute basis
Year Returns 2025 2024 2023 2022 2021 2020 2019 2018 2017 2016 Fund Manager information for Baroda Pioneer Mid-Cap Fund
Name Since Tenure Data below for Baroda Pioneer Mid-Cap Fund as on 31 Jan 22
Equity Sector Allocation
Sector Value Asset Allocation
Asset Class Value Top Securities Holdings / Portfolio
Name Holding Value Quantity
یکمشت راستے یا SIPs کے ذریعے سرمایہ کاری کرنے کا حتمی انتخاب بہت سے عوامل کا نتیجہ ہوگا، تاہم، سرمایہ کار کو ان تمام چیزوں کو مدنظر رکھنے کی ضرورت ہے۔خطرے کی بھوک بہترین راستے کا انتخاب کرنے کے لیے۔ اچھی طرح سے انتخاب کریں، دانشمندی سے انتخاب کریں، سرمایہ کاری کرتے رہیں!
یہاں فراہم کردہ معلومات کے درست ہونے کو یقینی بنانے کے لیے تمام کوششیں کی گئی ہیں۔ تاہم، ڈیٹا کی درستگی کے حوالے سے کوئی ضمانت نہیں دی جاتی ہے۔ براہ کرم کوئی بھی سرمایہ کاری کرنے سے پہلے اسکیم کی معلومات کے دستاویز کے ساتھ تصدیق کریں۔









AMFI Registration No. 112358 | CIN: U74999MH2016PTC282153
Shepard Technologies Pvt. Ltd. (with ARN code 112358) makes no warranties or representations, express or implied, on products offered through the platform. It accepts no liability for any damages or losses, however caused, in connection with the use of, or on the reliance of its product or related services. Terms and conditions of the website are applicable.
©2026 Shepard Technologies Private Limited. All Rights Reserved
Research Highlights for Edelweiss Emerging Markets Opportunities Equity Off-shore Fund