ہندوستان میں بہترین کارکردگی کا مظاہرہ کرنے والے SIP پلان 2022
بہترینگھونٹ منصوبے؟ ان کا انتخاب کیسے کریں؟ یہ کچھ عام سوالات ہیں جو سوچتے وقت سرمایہ کاروں کے ذہن میں آتے ہیں۔سرمایہ کاری میںباہمی چندہ ایس آئی پی یا سیسٹیمیٹک کے ذریعےسرمایہ کاری کا منصوبہ.
SIP سرمایہ کاری Mutual Funds میں سرمایہ کاری کرتے وقت سب سے زیادہ نظم و ضبط والے سرمایہ کاری کے اختیارات میں سے ایک ہے۔ مزید یہ کہ، SIP میوچل فنڈ میں سرمایہ کاری کی کم از کم رقم INR 500 سے کم ہے۔ اس سے سرمایہ کاری ہوتی ہے۔ٹاپ ایس آئی پی بہت آسان منصوبے.
عام طور پر، ہندوستان میں کچھ بہترین SIP منصوبے طویل مدت کے لیے سرمایہ کاری کرنے پر اچھا منافع پیش کرتے ہیں۔ یہ جاننے کے لیے کہ کوئی SIP یا سسٹمیٹک انویسٹمنٹ پلان میں سرمایہ کاری کرکے کتنا کما سکتا ہے، چیک کریں۔گھونٹ کیلکولیٹر (جسے ایس آئی پی ریٹرن کیلکولیٹر بھی کہا جاتا ہے) سیکشن نیچے۔
سیسٹیمیٹک انویسٹمنٹ پلان میں سرمایہ کاری کیوں کی جائے؟
ایک منظم سرمایہ کاری کا منصوبہ متعدد فوائد کے ساتھ آتا ہے۔ اس کی کم از کم سرمایہ کاری کی رقمINR 500 میوچل فنڈز میں سرمایہ کاری کا سفر شروع کرنے کے لیے نہ صرف زیادہ تر آبادی بلکہ بہت سے نوجوانوں کی توجہ حاصل کی ہے۔ ایکسرمایہ کار کون چاہتا ہےSIP میں سرمایہ کاری کریں۔ ان کی اہم منصوبہ بندی کر سکتے ہیںمالی اہداف جیسے کہ بچوں کی تعلیم، شادی کے اخراجات، مکان/گاڑی کی خریداری وغیرہ، نظم و ضبط کے ساتھ۔ کوئی بھی اپنے اہداف (مختصر مدت، وسط مدتی اور طویل مدتی) کے مطابق سرمایہ کاری شروع کر سکتا ہے اور ایک خاص مدت کے دوران دولت میں اضافہ حاصل کر سکتا ہے۔
SIPs بڑے فوائد پیش کرتے ہیں جیسے روپے کی اوسط قیمت اورکمپاؤنڈنگ کی طاقت. روپے کی لاگت کا اوسط ایک فرد کو اثاثہ کی خریداری کی قیمت کا اوسط نکالنے میں مدد کرتا ہے۔ ایس آئی پی میں، یونٹس کی خریداری ایک طویل مدت میں کی جاتی ہے اور یہ ماہانہ وقفوں (عام طور پر) پر یکساں طور پر پھیلی ہوئی ہیں۔ سرمایہ کاری وقت کے ساتھ پھیل جانے کی وجہ سے، سرمایہ کاری اسٹاک میں کی جاتی ہے۔مارکیٹ مختلف قیمت پوائنٹس پر سرمایہ کار کو اوسط لاگت کا فائدہ دیتا ہے، لہذا اصطلاح روپیہ لاگت کا اوسط۔
مرکب سود کی صورت میں، سادہ سود کے برعکس جہاں آپ صرف پرنسپل پر سود حاصل کرتے ہیں، یہاں سود کی رقم پرنسپل میں شامل کی جاتی ہے، اور سود کا حساب نئے پرنسپل (پرانے پرنسپل کے علاوہ منافع) پر کیا جاتا ہے۔ یہ عمل ہر بار جاری رہتا ہے۔ چونکہ ایس آئی پی میں میوچل فنڈز قسطوں میں ہوتے ہیں، اس لیے وہ مرکب ہوتے ہیں، جو ابتدائی طور پر لگائی گئی رقم میں مزید اضافہ کرتے ہیں۔
سیسٹیمیٹک انویسٹمنٹ پلان میں کیسے سرمایہ کاری کریں؟
Fincash.com پر لائف ٹائم کے لیے مفت انویسٹمنٹ اکاؤنٹ کھولیں۔
اپنی رجسٹریشن اور KYC کا عمل مکمل کریں۔
دستاویزات اپ لوڈ کریں (PAN، آدھار، وغیرہ)۔اور، آپ سرمایہ کاری کے لیے تیار ہیں!
تو، آپ کس چیز کا انتظار کر رہے ہیں؟ اپنے SIP یا منظم سرمایہ کاری کے منصوبے کے ساتھ شروع کریں اور اب بہتر بچت کریں!
Talk to our investment specialist
مالی سال 22 - 23 میں سرمایہ کاری کے لیے بہترین SIP پلان
"The primary investment objective of the Scheme is to seek capital appreciation by investing predominantly in units of MLIIF - WGF. The Scheme may, at the discretion of the Investment Manager, also invest in the units of other similar overseas mutual fund schemes, which may constitute a significant part of its corpus. The Scheme may also invest a certain portion of its corpus in money market securities and/or units of money market/liquid schemes of DSP Merrill Lynch Mutual Fund, in order to meet liquidity requirements from time to time. However, there is no assurance that the investment objective of the Scheme will be realized." Research Highlights for DSP World Gold Fund Below is the key information for DSP World Gold Fund Returns up to 1 year are on The objective of the scheme would be to provide investors with opportunities for long-term growth in capital along with the liquidity of an open-ended scheme through an active management of investments in a diversified basket of equity stocks of domestic Public Sector Undertakings and in debt and money market instruments issued by PSUs AND others. Research Highlights for SBI PSU Fund Below is the key information for SBI PSU Fund Returns up to 1 year are on To generate capital appreciation and income distribution to unit holders by investing predominantly in equity/equity related securities of the companies belonging to the infrastructure development and balance in debt securities and money market instruments. Research Highlights for ICICI Prudential Infrastructure Fund Below is the key information for ICICI Prudential Infrastructure Fund Returns up to 1 year are on The investment objective of the scheme is to provide long term growth from a portfolio of equity / equity related instruments of companies engaged either directly or indirectly in the infrastructure sector. Research Highlights for LIC MF Infrastructure Fund Below is the key information for LIC MF Infrastructure Fund Returns up to 1 year are on (Erstwhile Reliance Diversified Power Sector Fund) The primary investment objective of the scheme is to generate long term capital appreciation by investing predominantly in equity and equity related securities of companies in the power sector. Research Highlights for Nippon India Power and Infra Fund Below is the key information for Nippon India Power and Infra Fund Returns up to 1 year are on To generate capital appreciation, from a portfolio that is substantially constituted of equity securities and equity related securities of corporates, which could benefit from structural changes brought about by continuing liberalization in economic policies by the government and/or continuing investments in infrastructure, both by the public and private sector. Research Highlights for DSP India T.I.G.E.R Fund Below is the key information for DSP India T.I.G.E.R Fund Returns up to 1 year are on (Erstwhile Motilal Oswal MOSt Focused Midcap 30 Fund) The investment objective of the Scheme is to achieve long term capital appreciation by investing in a maximum of 30 quality mid-cap companies having long-term competitive advantages and potential for growth. However, there can be no assurance or guarantee that the investment objective of the Scheme would be achieved. Research Highlights for Motilal Oswal Midcap 30 Fund Below is the key information for Motilal Oswal Midcap 30 Fund Returns up to 1 year are on To generate capital appreciation by investing in Equity and Equity Related Instruments of companies where the Central / State Government(s) has majority shareholding or management control or has powers to appoint majority of directors. However, there is no assurance or guarantee that the investment objective of the Scheme will be achieved. The Scheme does not assure or guarantee any returns. Research Highlights for Invesco India PSU Equity Fund Below is the key information for Invesco India PSU Equity Fund Returns up to 1 year are on The Scheme seeks to generate long term capital appreciation through a portfolio of predominantly equity and equity related securities of companies engaged in manufacturing and infrastructure and related sectors. Further, there can be no assurance that the investment objectives of the scheme will be realized. The Scheme is not providing any assured or guaranteed returns Research Highlights for BOI AXA Manufacturing and Infrastructure Fund Below is the key information for BOI AXA Manufacturing and Infrastructure Fund Returns up to 1 year are on T o g e n e r a t e income/capital appreciation by investing in equities and equity related instruments of companies in the infrastructure sector. However, there can be no assurance that the investment objective of the scheme will be realized. Research Highlights for Canara Robeco Infrastructure Below is the key information for Canara Robeco Infrastructure Returns up to 1 year are on Fund NAV Net Assets (Cr) Min SIP Investment 3 MO (%) 6 MO (%) 1 YR (%) 3 YR (%) 5 YR (%) 2025 (%) DSP World Gold Fund Growth ₹50.1271
↓ -1.40 ₹1,433 500 -16.7 -23.5 57.5 42.3 23.2 167.1 SBI PSU Fund Growth ₹34.1868
↓ -0.04 ₹6,684 500 -6 2.3 5.8 23.3 22.9 11.3 ICICI Prudential Infrastructure Fund Growth ₹199.47
↓ -0.50 ₹8,550 100 0 7.4 0.4 19.2 22.9 6.7 LIC MF Infrastructure Fund Growth ₹53.4108
↓ -0.10 ₹1,137 1,000 4 16.5 5.8 24.5 22.2 -3.7 Nippon India Power and Infra Fund Growth ₹376.558
↓ -0.45 ₹8,043 100 0.8 17.2 8.6 20.6 21.7 -0.5 DSP India T.I.G.E.R Fund Growth ₹356.825
↓ -0.65 ₹6,264 500 4.9 20.1 12.6 22.4 21.7 -2.5 Motilal Oswal Midcap 30 Fund Growth ₹97.2452
↓ -0.07 ₹37,474 500 7 6.3 -4.7 18.4 21.3 -12.1 Invesco India PSU Equity Fund Growth ₹64.09
↓ -0.13 ₹1,473 500 -6.1 -1.4 -0.3 20.4 20.6 10.3 BOI AXA Manufacturing and Infrastructure Fund Growth ₹65.94
↓ -0.02 ₹837 1,000 7.4 18.4 14.6 23 20.2 7.8 Canara Robeco Infrastructure Growth ₹166.11
↓ -0.64 ₹998 1,000 -2.8 11.3 2.6 20 19.6 0.1 Note: Returns up to 1 year are on absolute basis & more than 1 year are on CAGR basis. as on 23 Jul 26 Research Highlights & Commentary of 10 Funds showcased
Commentary DSP World Gold Fund SBI PSU Fund ICICI Prudential Infrastructure Fund LIC MF Infrastructure Fund Nippon India Power and Infra Fund DSP India T.I.G.E.R Fund Motilal Oswal Midcap 30 Fund Invesco India PSU Equity Fund BOI AXA Manufacturing and Infrastructure Fund Canara Robeco Infrastructure Point 1 Lower mid AUM (₹1,433 Cr). Upper mid AUM (₹6,684 Cr). Top quartile AUM (₹8,550 Cr). Bottom quartile AUM (₹1,137 Cr). Upper mid AUM (₹8,043 Cr). Upper mid AUM (₹6,264 Cr). Highest AUM (₹37,474 Cr). Lower mid AUM (₹1,473 Cr). Bottom quartile AUM (₹837 Cr). Bottom quartile AUM (₹998 Cr). Point 2 Established history (18+ yrs). Established history (16+ yrs). Established history (20+ yrs). Established history (18+ yrs). Oldest track record among peers (22 yrs). Established history (22+ yrs). Established history (12+ yrs). Established history (16+ yrs). Established history (16+ yrs). Established history (20+ yrs). Point 3 Rating: 3★ (upper mid). Rating: 2★ (lower mid). Rating: 3★ (upper mid). Not Rated. Top rated. Rating: 4★ (top quartile). Rating: 3★ (upper mid). Rating: 3★ (lower mid). Not Rated. Not Rated. Point 4 Risk profile: High. Risk profile: High. Risk profile: High. Risk profile: High. Risk profile: High. Risk profile: High. Risk profile: Moderately High. Risk profile: High. Risk profile: High. Risk profile: High. Point 5 5Y return: 23.23% (top quartile). 5Y return: 22.93% (top quartile). 5Y return: 22.87% (upper mid). 5Y return: 22.24% (upper mid). 5Y return: 21.72% (upper mid). 5Y return: 21.69% (lower mid). 5Y return: 21.29% (lower mid). 5Y return: 20.64% (bottom quartile). 5Y return: 20.24% (bottom quartile). 5Y return: 19.55% (bottom quartile). Point 6 3Y return: 42.34% (top quartile). 3Y return: 23.32% (upper mid). 3Y return: 19.23% (bottom quartile). 3Y return: 24.49% (top quartile). 3Y return: 20.61% (lower mid). 3Y return: 22.36% (upper mid). 3Y return: 18.44% (bottom quartile). 3Y return: 20.37% (lower mid). 3Y return: 23.04% (upper mid). 3Y return: 19.96% (bottom quartile). Point 7 1Y return: 57.48% (top quartile). 1Y return: 5.82% (lower mid). 1Y return: 0.42% (bottom quartile). 1Y return: 5.84% (upper mid). 1Y return: 8.61% (upper mid). 1Y return: 12.56% (upper mid). 1Y return: -4.73% (bottom quartile). 1Y return: -0.30% (bottom quartile). 1Y return: 14.58% (top quartile). 1Y return: 2.57% (lower mid). Point 8 Alpha: 2.12 (upper mid). Alpha: -0.30 (bottom quartile). Alpha: 0.00 (upper mid). Alpha: 8.41 (top quartile). Alpha: 8.81 (top quartile). Alpha: 0.00 (upper mid). Alpha: -14.72 (bottom quartile). Alpha: -6.88 (bottom quartile). Alpha: 0.00 (lower mid). Alpha: 0.00 (lower mid). Point 9 Sharpe: 1.22 (top quartile). Sharpe: 0.12 (lower mid). Sharpe: -0.07 (bottom quartile). Sharpe: 0.22 (upper mid). Sharpe: 0.24 (upper mid). Sharpe: 0.44 (upper mid). Sharpe: -0.71 (bottom quartile). Sharpe: -0.16 (bottom quartile). Sharpe: 0.53 (top quartile). Sharpe: 0.02 (lower mid). Point 10 Information ratio: -0.50 (bottom quartile). Information ratio: -0.11 (lower mid). Information ratio: 0.00 (upper mid). Information ratio: 0.58 (top quartile). Information ratio: 0.56 (top quartile). Information ratio: 0.00 (upper mid). Information ratio: -0.25 (bottom quartile). Information ratio: -0.57 (bottom quartile). Information ratio: 0.00 (upper mid). Information ratio: 0.00 (lower mid). DSP World Gold Fund
SBI PSU Fund
ICICI Prudential Infrastructure Fund
LIC MF Infrastructure Fund
Nippon India Power and Infra Fund
DSP India T.I.G.E.R Fund
Motilal Oswal Midcap 30 Fund
Invesco India PSU Equity Fund
BOI AXA Manufacturing and Infrastructure Fund
Canara Robeco Infrastructure
اثاثے >= 200 کروڑ اور ترتیب دیا گیا5 سال کی واپسی۔.1. DSP World Gold Fund
DSP World Gold Fund
Growth Launch Date 14 Sep 07 NAV (23 Jul 26) ₹50.1271 ↓ -1.40 (-2.72 %) Net Assets (Cr) ₹1,433 on 30 Jun 26 Category Equity - Global AMC DSP BlackRock Invmt Managers Pvt. Ltd. Rating ☆☆☆ Risk High Expense Ratio 1.41 Sharpe Ratio 1.22 Information Ratio -0.5 Alpha Ratio 2.12 Min Investment 1,000 Min SIP Investment 500 Exit Load 0-12 Months (1%),12 Months and above(NIL) Growth of 10,000 investment over the years.
Date Value 30 Jun 21 ₹10,000 30 Jun 22 ₹8,181 30 Jun 23 ₹9,294 30 Jun 24 ₹10,640 30 Jun 25 ₹16,808 30 Jun 26 ₹27,693 Returns for DSP World Gold Fund
absolute basis & more than 1 year are on CAGR (Compound Annual Growth Rate) basis. as on 23 Jul 26 Duration Returns 1 Month -5.9% 3 Month -16.7% 6 Month -23.5% 1 Year 57.5% 3 Year 42.3% 5 Year 23.2% 10 Year 15 Year Since launch 8.9% Historical performance (Yearly) on absolute basis
Year Returns 2025 167.1% 2024 15.9% 2023 7% 2022 -7.7% 2021 -9% 2020 31.4% 2019 35.1% 2018 -10.7% 2017 -4% 2016 52.7% Fund Manager information for DSP World Gold Fund
Name Since Tenure Kaivalya Nadkarni 1 May 25 1.17 Yr. Data below for DSP World Gold Fund as on 30 Jun 26
Equity Sector Allocation
Sector Value Basic Materials 94.47% Asset Allocation
Asset Class Value Cash 3.62% Equity 94.47% Debt 0% Other 1.91% Top Securities Holdings / Portfolio
Name Holding Value Quantity BGF World Gold I2
Investment Fund | -68% ₹1,141 Cr 1,005,044 VanEck Gold Miners ETF
- | GDX29% ₹490 Cr 573,719 Treps / Reverse Repo Investments
CBLO/Reverse Repo | -3% ₹54 Cr Net Receivables/Payables
Net Current Assets | -0% -₹6 Cr 2. SBI PSU Fund
SBI PSU Fund
Growth Launch Date 7 Jul 10 NAV (24 Jul 26) ₹34.1868 ↓ -0.04 (-0.10 %) Net Assets (Cr) ₹6,684 on 30 Jun 26 Category Equity - Sectoral AMC SBI Funds Management Private Limited Rating ☆☆ Risk High Expense Ratio 1.89 Sharpe Ratio 0.12 Information Ratio -0.11 Alpha Ratio -0.3 Min Investment 5,000 Min SIP Investment 500 Exit Load 0-1 Years (1%),1 Years and above(NIL) Growth of 10,000 investment over the years.
Date Value 30 Jun 21 ₹10,000 30 Jun 22 ₹9,973 30 Jun 23 ₹13,609 30 Jun 24 ₹26,792 30 Jun 25 ₹26,602 30 Jun 26 ₹28,255 Returns for SBI PSU Fund
absolute basis & more than 1 year are on CAGR (Compound Annual Growth Rate) basis. as on 23 Jul 26 Duration Returns 1 Month -2.4% 3 Month -6% 6 Month 2.3% 1 Year 5.8% 3 Year 23.3% 5 Year 22.9% 10 Year 15 Year Since launch 8% Historical performance (Yearly) on absolute basis
Year Returns 2025 11.3% 2024 23.5% 2023 54% 2022 29% 2021 32.4% 2020 -10% 2019 6% 2018 -23.8% 2017 21.9% 2016 16.2% Fund Manager information for SBI PSU Fund
Name Since Tenure Rohit Shimpi 1 Jun 24 2.08 Yr. Data below for SBI PSU Fund as on 30 Jun 26
Equity Sector Allocation
Sector Value Financial Services 32.54% Utility 31.22% Industrials 14.07% Energy 11.97% Basic Materials 6.94% Asset Allocation
Asset Class Value Cash 3.18% Equity 96.74% Debt 0.07% Top Securities Holdings / Portfolio
Name Holding Value Quantity State Bank of India (Financial Services)
Equity, Since 31 Jul 10 | SBIN17% ₹1,112 Cr 11,527,500
↑ 1,000,000 GAIL (India) Ltd (Utilities)
Equity, Since 31 May 24 | GAIL10% ₹628 Cr 38,150,000 NTPC Ltd (Utilities)
Equity, Since 31 Jul 10 | NTPC9% ₹597 Cr 15,443,244 Bharat Electronics Ltd (Industrials)
Equity, Since 30 Jun 24 | BEL9% ₹583 Cr 14,185,000
↑ 800,000 Power Grid Corp Of India Ltd (Utilities)
Equity, Since 31 Jul 10 | POWERGRID9% ₹579 Cr 19,935,554 Oil & Natural Gas Corp Ltd (Energy)
Equity, Since 31 May 20 | ONGC6% ₹389 Cr 14,655,000 Bank of Baroda (Financial Services)
Equity, Since 31 Aug 24 | BANKBARODA5% ₹352 Cr 13,100,000 Bharat Petroleum Corp Ltd (Energy)
Equity, Since 31 Aug 24 | BPCL4% ₹289 Cr 9,700,000 Bharat Heavy Electricals Ltd (Industrials)
Equity, Since 30 Jun 25 | BHEL4% ₹271 Cr 6,500,000 NMDC Ltd (Basic Materials)
Equity, Since 31 Oct 23 | NMDC4% ₹245 Cr 27,900,000 3. ICICI Prudential Infrastructure Fund
ICICI Prudential Infrastructure Fund
Growth Launch Date 31 Aug 05 NAV (24 Jul 26) ₹199.47 ↓ -0.50 (-0.25 %) Net Assets (Cr) ₹8,550 on 30 Jun 26 Category Equity - Sectoral AMC ICICI Prudential Asset Management Company Limited Rating ☆☆☆ Risk High Expense Ratio 1.89 Sharpe Ratio -0.07 Information Ratio 0 Alpha Ratio 0 Min Investment 5,000 Min SIP Investment 100 Exit Load 0-1 Years (1%),1 Years and above(NIL) Growth of 10,000 investment over the years.
Date Value 30 Jun 21 ₹10,000 30 Jun 22 ₹11,534 30 Jun 23 ₹16,346 30 Jun 24 ₹27,296 30 Jun 25 ₹28,743 30 Jun 26 ₹29,425 Returns for ICICI Prudential Infrastructure Fund
absolute basis & more than 1 year are on CAGR (Compound Annual Growth Rate) basis. as on 23 Jul 26 Duration Returns 1 Month -3.2% 3 Month 0% 6 Month 7.4% 1 Year 0.4% 3 Year 19.2% 5 Year 22.9% 10 Year 15 Year Since launch 15.4% Historical performance (Yearly) on absolute basis
Year Returns 2025 6.7% 2024 27.4% 2023 44.6% 2022 28.8% 2021 50.1% 2020 3.6% 2019 2.6% 2018 -14% 2017 40.8% 2016 2% Fund Manager information for ICICI Prudential Infrastructure Fund
Name Since Tenure Ihab Dalwai 3 Jun 17 9.08 Yr. Sharmila D’mello 30 Jun 22 4.01 Yr. Data below for ICICI Prudential Infrastructure Fund as on 30 Jun 26
Equity Sector Allocation
Sector Value Industrials 47.57% Financial Services 10.57% Utility 10.32% Basic Materials 9.74% Real Estate 8.09% Energy 5.04% Consumer Cyclical 1.98% Communication Services 0.09% Asset Allocation
Asset Class Value Cash 5.83% Equity 94.17% Top Securities Holdings / Portfolio
Name Holding Value Quantity InterGlobe Aviation Ltd (Industrials)
Equity, Since 28 Feb 23 | INDIGO9% ₹745 Cr 1,691,985
↑ 50,000 Larsen & Toubro Ltd (Industrials)
Equity, Since 30 Nov 09 | LT7% ₹614 Cr 1,505,704 Oberoi Realty Ltd (Real Estate)
Equity, Since 31 May 23 | OBEROIRLTY4% ₹365 Cr 2,139,426 Gujarat Energy Ltd (Utilities)
Equity, Since 31 Jan 23 | GUJGASLTD4% ₹340 Cr 8,482,024
↑ 156,557 NTPC Ltd (Utilities)
Equity, Since 29 Feb 16 | NTPC4% ₹334 Cr 8,626,448 Shree Cement Ltd (Basic Materials)
Equity, Since 30 Apr 24 | SHREECEM3% ₹270 Cr 106,892
↑ 3,387 Kalpataru Projects International Ltd (Industrials)
Equity, Since 30 Sep 06 | KPIL3% ₹262 Cr 2,005,608 AIA Engineering Ltd (Industrials)
Equity, Since 28 Feb 21 | AIAENG3% ₹258 Cr 572,697 HDFC Bank Ltd (Financial Services)
Equity, Since 31 Jan 22 | HDFCBANK3% ₹250 Cr 3,357,506
↑ 1,057,506 Container Corporation of India Ltd (Industrials)
Equity, Since 31 Jan 16 | CONCOR3% ₹227 Cr 4,885,153 4. LIC MF Infrastructure Fund
LIC MF Infrastructure Fund
Growth Launch Date 29 Feb 08 NAV (24 Jul 26) ₹53.4108 ↓ -0.10 (-0.20 %) Net Assets (Cr) ₹1,137 on 30 Jun 26 Category Equity - Sectoral AMC LIC Mutual Fund Asset Mgmt Co Ltd Rating Risk High Expense Ratio 2.21 Sharpe Ratio 0.22 Information Ratio 0.58 Alpha Ratio 8.41 Min Investment 5,000 Min SIP Investment 1,000 Exit Load 0-1 Years (1%),1 Years and above(NIL) Growth of 10,000 investment over the years.
Date Value 30 Jun 21 ₹10,000 30 Jun 22 ₹11,137 30 Jun 23 ₹14,179 30 Jun 24 ₹26,268 30 Jun 25 ₹26,896 30 Jun 26 ₹29,151 Returns for LIC MF Infrastructure Fund
absolute basis & more than 1 year are on CAGR (Compound Annual Growth Rate) basis. as on 23 Jul 26 Duration Returns 1 Month -3.2% 3 Month 4% 6 Month 16.5% 1 Year 5.8% 3 Year 24.5% 5 Year 22.2% 10 Year 15 Year Since launch 9.5% Historical performance (Yearly) on absolute basis
Year Returns 2025 -3.7% 2024 47.8% 2023 44.4% 2022 7.9% 2021 46.6% 2020 -0.1% 2019 13.3% 2018 -14.6% 2017 42.2% 2016 -2.2% Fund Manager information for LIC MF Infrastructure Fund
Name Since Tenure Sumit Bhatnagar 7 Apr 26 0.23 Yr. Mahesh Bendre 1 Jul 24 2 Yr. Data below for LIC MF Infrastructure Fund as on 30 Jun 26
Equity Sector Allocation
Sector Value Industrials 37.05% Consumer Cyclical 20.88% Basic Materials 12.42% Utility 11.88% Communication Services 5.02% Financial Services 3.98% Real Estate 1.97% Health Care 1.89% Technology 1.08% Asset Allocation
Asset Class Value Cash 3.82% Equity 96.18% Top Securities Holdings / Portfolio
Name Holding Value Quantity Larsen & Toubro Ltd (Industrials)
Equity, Since 30 Apr 09 | LT4% ₹44 Cr 106,968
↓ -10,884 Garware Hi-Tech Films Ltd (Basic Materials)
Equity, Since 31 Aug 23 | 5006554% ₹40 Cr 65,325
↓ -7,684 Tata Motors Passenger Vehicles Ltd (Consumer Cyclical)
Equity, Since 28 Feb 26 | TMPV4% ₹39 Cr 982,891
↓ -332,760 Tata Motors Ltd (Consumer Cyclical)
Equity, Since 31 Oct 25 | TMCV4% ₹39 Cr 1,015,933
↑ 26,983 Tata Power Co Ltd (Utilities)
Equity, Since 29 Feb 24 | TATAPOWER3% ₹36 Cr 861,040
↑ 524,312 KSH International Ltd (Industrials)
Equity, Since 31 Dec 25 | KSHINTL3% ₹34 Cr 432,816
↑ 6,280 Siemens Energy India Ltd (Utilities)
Equity, Since 31 Aug 25 | ENRIN3% ₹34 Cr 87,106
↑ 24,800 JSW Infrastructure Ltd (Industrials)
Equity, Since 30 Apr 26 | JSWINFRA3% ₹31 Cr 1,133,858
↑ 745,681 Carraro India Ltd (Consumer Cyclical)
Equity, Since 31 Dec 24 | CARRARO3% ₹31 Cr 572,991 Bharat Dynamics Ltd Ordinary Shares (Industrials)
Equity, Since 31 Jan 26 | BDL3% ₹29 Cr 242,954
↑ 157,744 5. Nippon India Power and Infra Fund
Nippon India Power and Infra Fund
Growth Launch Date 8 May 04 NAV (24 Jul 26) ₹376.558 ↓ -0.45 (-0.12 %) Net Assets (Cr) ₹8,043 on 30 Jun 26 Category Equity - Sectoral AMC Nippon Life Asset Management Ltd. Rating ☆☆☆☆ Risk High Expense Ratio 1.85 Sharpe Ratio 0.24 Information Ratio 0.56 Alpha Ratio 8.81 Min Investment 5,000 Min SIP Investment 100 Exit Load 0-1 Years (1%),1 Years and above(NIL) Growth of 10,000 investment over the years.
Date Value 30 Jun 21 ₹10,000 30 Jun 22 ₹10,223 30 Jun 23 ₹15,004 30 Jun 24 ₹27,370 30 Jun 25 ₹26,049 30 Jun 26 ₹28,381 Returns for Nippon India Power and Infra Fund
absolute basis & more than 1 year are on CAGR (Compound Annual Growth Rate) basis. as on 23 Jul 26 Duration Returns 1 Month -2.5% 3 Month 0.8% 6 Month 17.2% 1 Year 8.6% 3 Year 20.6% 5 Year 21.7% 10 Year 15 Year Since launch 17.7% Historical performance (Yearly) on absolute basis
Year Returns 2025 -0.5% 2024 26.9% 2023 58% 2022 10.9% 2021 48.9% 2020 10.8% 2019 -2.9% 2018 -21.1% 2017 61.7% 2016 0.1% Fund Manager information for Nippon India Power and Infra Fund
Name Since Tenure Kinjal Desai 25 May 18 8.11 Yr. Rahul Modi 19 Aug 24 1.87 Yr. Amber Singhania 11 Mar 26 0.31 Yr. Data below for Nippon India Power and Infra Fund as on 30 Jun 26
Equity Sector Allocation
Sector Value Industrials 34.92% Utility 22.36% Consumer Cyclical 11.45% Energy 9.18% Basic Materials 6.78% Technology 4.51% Financial Services 4.09% Communication Services 2.39% Real Estate 1.47% Health Care 1.24% Asset Allocation
Asset Class Value Cash 1.59% Equity 98.41% Top Securities Holdings / Portfolio
Name Holding Value Quantity Reliance Industries Ltd (Energy)
Equity, Since 30 Nov 18 | RELIANCE8% ₹616 Cr 4,660,000 Larsen & Toubro Ltd (Industrials)
Equity, Since 30 Nov 07 | LT7% ₹557 Cr 1,366,958
↑ 20,000 NTPC Ltd (Utilities)
Equity, Since 31 May 09 | NTPC6% ₹487 Cr 12,600,000
↓ -554,060 NTPC Green Energy Ltd (Utilities)
Equity, Since 30 Nov 24 | NTPCGREEN4% ₹296 Cr 28,594,584
↑ 2,403,505 Tata Power Co Ltd (Utilities)
Equity, Since 30 Apr 23 | TATAPOWER3% ₹246 Cr 5,850,789
↓ -100,000 Bharat Heavy Electricals Ltd (Industrials)
Equity, Since 30 Sep 24 | BHEL3% ₹242 Cr 5,800,000
↓ -1,148,468 Triveni Turbine Ltd (Industrials)
Equity, Since 30 Jun 25 | TRITURBINE3% ₹237 Cr 3,193,288
↑ 120,000 Power Finance Corp Ltd (Financial Services)
Equity, Since 31 Oct 24 | PFC3% ₹198 Cr 4,620,000
↑ 720,000 Bharti Airtel Ltd (Communication Services)
Equity, Since 30 Apr 18 | BHARTIARTL2% ₹188 Cr 1,030,000
↑ 180,000 CG Power & Industrial Solutions Ltd (Industrials)
Equity, Since 30 Sep 24 | CGPOWER2% ₹174 Cr 1,893,400
↓ -276,614 6. DSP India T.I.G.E.R Fund
DSP India T.I.G.E.R Fund
Growth Launch Date 11 Jun 04 NAV (24 Jul 26) ₹356.825 ↓ -0.65 (-0.18 %) Net Assets (Cr) ₹6,264 on 30 Jun 26 Category Equity - Sectoral AMC DSP BlackRock Invmt Managers Pvt. Ltd. Rating ☆☆☆☆ Risk High Expense Ratio 1.89 Sharpe Ratio 0.44 Information Ratio 0 Alpha Ratio 0 Min Investment 1,000 Min SIP Investment 500 Exit Load 0-12 Months (1%),12 Months and above(NIL) Growth of 10,000 investment over the years.
Date Value 30 Jun 21 ₹10,000 30 Jun 22 ₹10,551 30 Jun 23 ₹14,508 30 Jun 24 ₹25,980 30 Jun 25 ₹25,049 30 Jun 26 ₹28,384 Returns for DSP India T.I.G.E.R Fund
absolute basis & more than 1 year are on CAGR (Compound Annual Growth Rate) basis. as on 23 Jul 26 Duration Returns 1 Month -1.9% 3 Month 4.9% 6 Month 20.1% 1 Year 12.6% 3 Year 22.4% 5 Year 21.7% 10 Year 15 Year Since launch 17.5% Historical performance (Yearly) on absolute basis
Year Returns 2025 -2.5% 2024 32.4% 2023 49% 2022 13.9% 2021 51.6% 2020 2.7% 2019 6.7% 2018 -17.2% 2017 47% 2016 4.1% Fund Manager information for DSP India T.I.G.E.R Fund
Name Since Tenure Rohit Singhania 21 Jun 10 16.04 Yr. Data below for DSP India T.I.G.E.R Fund as on 30 Jun 26
Equity Sector Allocation
Sector Value Industrials 28.69% Basic Materials 13.29% Energy 9.47% Utility 9.46% Financial Services 8.49% Consumer Cyclical 6.52% Health Care 6.13% Communication Services 2.58% Technology 1.52% Real Estate 1.49% Consumer Defensive 0.71% Asset Allocation
Asset Class Value Cash 11.66% Equity 88.34% Top Securities Holdings / Portfolio
Name Holding Value Quantity Reliance Industries Ltd (Energy)
Equity, Since 31 Aug 19 | RELIANCE4% ₹262 Cr 1,983,815
↑ 1,304,235 NTPC Ltd (Utilities)
Equity, Since 30 Nov 17 | NTPC4% ₹249 Cr 6,433,748
↓ -94,844 Apollo Hospitals Enterprise Ltd (Healthcare)
Equity, Since 31 Dec 24 | APOLLOHOSP4% ₹247 Cr 301,630 Larsen & Toubro Ltd (Industrials)
Equity, Since 30 Jun 04 | LT4% ₹240 Cr 588,665 Kirloskar Oil Engines Ltd (Industrials)
Equity, Since 31 Mar 23 | 5332933% ₹161 Cr 834,973 Bharti Airtel Ltd (Communication Services)
Equity, Since 31 Oct 18 | BHARTIARTL3% ₹155 Cr 849,969 Coal India Ltd (Energy)
Equity, Since 31 Dec 23 | COALINDIA3% ₹154 Cr 3,352,298
↑ 647,118 INOX India Ltd (Industrials)
Equity, Since 31 Dec 23 | INOXINDIA2% ₹139 Cr 931,429
↓ -9,412 UltraTech Cement Ltd (Basic Materials)
Equity, Since 31 Dec 14 | ULTRACEMCO2% ₹135 Cr 118,010
↑ 51,464 Hindustan Aeronautics Ltd Ordinary Shares (Industrials)
Equity, Since 31 Oct 25 | HAL2% ₹131 Cr 305,098 7. Motilal Oswal Midcap 30 Fund
Motilal Oswal Midcap 30 Fund
Growth Launch Date 24 Feb 14 NAV (24 Jul 26) ₹97.2452 ↓ -0.07 (-0.07 %) Net Assets (Cr) ₹37,474 on 30 Jun 26 Category Equity - Mid Cap AMC Motilal Oswal Asset Management Co. Ltd Rating ☆☆☆ Risk Moderately High Expense Ratio 1.56 Sharpe Ratio -0.71 Information Ratio -0.25 Alpha Ratio -14.72 Min Investment 5,000 Min SIP Investment 500 Exit Load 0-1 Years (1%),1 Years and above(NIL) Growth of 10,000 investment over the years.
Date Value 30 Jun 21 ₹10,000 30 Jun 22 ₹11,908 30 Jun 23 ₹16,418 30 Jun 24 ₹26,938 30 Jun 25 ₹29,503 30 Jun 26 ₹26,510 Returns for Motilal Oswal Midcap 30 Fund
absolute basis & more than 1 year are on CAGR (Compound Annual Growth Rate) basis. as on 23 Jul 26 Duration Returns 1 Month 3.5% 3 Month 7% 6 Month 6.3% 1 Year -4.7% 3 Year 18.4% 5 Year 21.3% 10 Year 15 Year Since launch 20.1% Historical performance (Yearly) on absolute basis
Year Returns 2025 -12.1% 2024 57.1% 2023 41.7% 2022 10.7% 2021 55.8% 2020 9.3% 2019 9.7% 2018 -12.7% 2017 30.8% 2016 5.2% Fund Manager information for Motilal Oswal Midcap 30 Fund
Name Since Tenure Varun Sharma 21 Jan 26 0.44 Yr. Swapnil Mayekar 18 Nov 25 0.62 Yr. Ajay Khandelwal 1 Oct 24 1.75 Yr. Ankit Agarwal 21 Jan 26 0.44 Yr. Rakesh Shetty 22 Nov 22 3.61 Yr. Data below for Motilal Oswal Midcap 30 Fund as on 30 Jun 26
Equity Sector Allocation
Sector Value Financial Services 31.02% Technology 26.84% Industrials 13.76% Consumer Cyclical 13.41% Communication Services 3.08% Real Estate 2.81% Health Care 2.46% Asset Allocation
Asset Class Value Cash 6.63% Equity 93.37% Top Securities Holdings / Portfolio
Name Holding Value Quantity One97 Communications Ltd (Technology)
Equity, Since 30 Sep 24 | PAYTM7% ₹2,659 Cr 23,765,865 Coforge Ltd (Technology)
Equity, Since 31 Mar 23 | COFORGE6% ₹2,233 Cr 15,703,312
↓ -979,603 Kalyan Jewellers India Ltd (Consumer Cyclical)
Equity, Since 29 Feb 24 | KALYANKJIL6% ₹2,180 Cr 61,413,395 KEI Industries Ltd (Industrials)
Equity, Since 30 Nov 24 | KEI6% ₹2,123 Cr 4,030,834 Eternal Ltd (Consumer Cyclical)
Equity, Since 31 Aug 25 | ETERNAL6% ₹2,115 Cr 84,386,866 Persistent Systems Ltd (Technology)
Equity, Since 31 Jan 23 | PERSISTENT6% ₹2,091 Cr 4,026,493 Aditya Birla Capital Ltd (Financial Services)
Equity, Since 30 Jun 25 | ABCAPITAL5% ₹1,906 Cr 52,459,381
↓ -1,000,000 Billionbrains Garage Ventures Ltd (Financial Services)
Equity, Since 31 Jan 26 | GROWW4% ₹1,564 Cr 84,616,660 Multi Commodity Exchange of India Ltd (Financial Services)
Equity, Since 31 Jan 26 | MCX4% ₹1,539 Cr 5,209,458 BSE Ltd (Financial Services)
Equity, Since 30 Nov 25 | BSE4% ₹1,451 Cr 3,500,830
↓ -256,232 8. Invesco India PSU Equity Fund
Invesco India PSU Equity Fund
Growth Launch Date 18 Nov 09 NAV (24 Jul 26) ₹64.09 ↓ -0.13 (-0.20 %) Net Assets (Cr) ₹1,473 on 30 Jun 26 Category Equity - Sectoral AMC Invesco Asset Management (India) Private Ltd Rating ☆☆☆ Risk High Expense Ratio 2.14 Sharpe Ratio -0.16 Information Ratio -0.57 Alpha Ratio -6.88 Min Investment 5,000 Min SIP Investment 500 Exit Load 0-1 Years (1%),1 Years and above(NIL) Growth of 10,000 investment over the years.
Date Value 30 Jun 21 ₹10,000 30 Jun 22 ₹9,722 30 Jun 23 ₹13,891 30 Jun 24 ₹27,099 30 Jun 25 ₹26,286 30 Jun 26 ₹26,262 Returns for Invesco India PSU Equity Fund
absolute basis & more than 1 year are on CAGR (Compound Annual Growth Rate) basis. as on 23 Jul 26 Duration Returns 1 Month -3.1% 3 Month -6.1% 6 Month -1.4% 1 Year -0.3% 3 Year 20.4% 5 Year 20.6% 10 Year 15 Year Since launch 11.8% Historical performance (Yearly) on absolute basis
Year Returns 2025 10.3% 2024 25.6% 2023 54.5% 2022 20.5% 2021 31.1% 2020 6.1% 2019 10.1% 2018 -16.9% 2017 24.3% 2016 17.9% Fund Manager information for Invesco India PSU Equity Fund
Name Since Tenure Hiten Jain 1 Jul 25 1 Yr. Sagar Gandhi 1 Jul 25 1 Yr. Data below for Invesco India PSU Equity Fund as on 30 Jun 26
Equity Sector Allocation
Sector Value Financial Services 30.26% Industrials 29.89% Utility 19.1% Energy 13.91% Basic Materials 3.59% Consumer Cyclical 1.59% Asset Allocation
Asset Class Value Cash 1.66% Equity 98.34% Top Securities Holdings / Portfolio
Name Holding Value Quantity State Bank of India (Financial Services)
Equity, Since 28 Feb 21 | SBIN9% ₹128 Cr 1,323,094
↑ 151,862 Hindustan Aeronautics Ltd Ordinary Shares (Industrials)
Equity, Since 31 May 22 | HAL8% ₹112 Cr 261,137 Indian Bank (Financial Services)
Equity, Since 30 Jun 21 | INDIANB8% ₹112 Cr 1,341,970
↑ 78,651 Bharat Petroleum Corp Ltd (Energy)
Equity, Since 30 Sep 18 | BPCL6% ₹92 Cr 3,076,024 Bharat Electronics Ltd (Industrials)
Equity, Since 31 Mar 17 | BEL6% ₹85 Cr 2,078,629 Dredging Corp of India Ltd (Industrials)
Equity, Since 31 Jul 25 | DREDGECORP5% ₹75 Cr 646,300 NTPC Green Energy Ltd (Utilities)
Equity, Since 30 Nov 24 | NTPCGREEN5% ₹71 Cr 6,852,914 Bank of Baroda (Financial Services)
Equity, Since 30 Jun 21 | BANKBARODA5% ₹70 Cr 2,611,219 NTPC Ltd (Utilities)
Equity, Since 31 May 19 | NTPC5% ₹70 Cr 1,801,543 REC Ltd (Financial Services)
Equity, Since 31 Aug 23 | RECLTD4% ₹58 Cr 1,703,577 9. BOI AXA Manufacturing and Infrastructure Fund
BOI AXA Manufacturing and Infrastructure Fund
Growth Launch Date 5 Mar 10 NAV (24 Jul 26) ₹65.94 ↓ -0.02 (-0.03 %) Net Assets (Cr) ₹837 on 30 Jun 26 Category Equity - Sectoral AMC BOI AXA Investment Mngrs Private Ltd Rating Risk High Expense Ratio 2.4 Sharpe Ratio 0.53 Information Ratio 0 Alpha Ratio 0 Min Investment 5,000 Min SIP Investment 1,000 Exit Load 0-1 Years (1%),1 Years and above(NIL) Growth of 10,000 investment over the years.
Date Value 30 Jun 21 ₹10,000 30 Jun 22 ₹10,067 30 Jun 23 ₹13,588 30 Jun 24 ₹22,409 30 Jun 25 ₹22,619 30 Jun 26 ₹25,882 Returns for BOI AXA Manufacturing and Infrastructure Fund
absolute basis & more than 1 year are on CAGR (Compound Annual Growth Rate) basis. as on 23 Jul 26 Duration Returns 1 Month 0.8% 3 Month 7.4% 6 Month 18.4% 1 Year 14.6% 3 Year 23% 5 Year 20.2% 10 Year 15 Year Since launch 12.2% Historical performance (Yearly) on absolute basis
Year Returns 2025 7.8% 2024 25.7% 2023 44.7% 2022 3.3% 2021 52.5% 2020 28.1% 2019 2.5% 2018 -22.8% 2017 56% 2016 1% Fund Manager information for BOI AXA Manufacturing and Infrastructure Fund
Name Since Tenure Nitin Gosar 27 Sep 22 3.76 Yr. Data below for BOI AXA Manufacturing and Infrastructure Fund as on 30 Jun 26
Equity Sector Allocation
Sector Value Industrials 24.81% Basic Materials 13.14% Consumer Cyclical 12.85% Health Care 11.87% Energy 10.92% Utility 6.13% Communication Services 4.02% Technology 3.57% Consumer Defensive 3.15% Real Estate 1.14% Asset Allocation
Asset Class Value Cash 6.24% Equity 93.66% Debt 0.1% Top Securities Holdings / Portfolio
Name Holding Value Quantity Larsen & Toubro Ltd (Industrials)
Equity, Since 31 Mar 10 | LT7% ₹52 Cr 127,443
↓ -23,672 NTPC Ltd (Utilities)
Equity, Since 31 May 21 | NTPC6% ₹48 Cr 1,250,367 Reliance Industries Ltd (Energy)
Equity, Since 31 Oct 20 | RELIANCE6% ₹47 Cr 356,510 Bharti Airtel Ltd (Communication Services)
Equity, Since 31 Dec 22 | BHARTIARTL4% ₹32 Cr 173,416 Dixon Technologies (India) Ltd (Technology)
Equity, Since 30 Apr 26 | DIXON4% ₹28 Cr 24,451
↑ 8,155 Aurobindo Pharma Ltd (Healthcare)
Equity, Since 31 May 25 | AUROPHARMA4% ₹28 Cr 196,331 Cemindia Projects Ltd (Industrials)
Equity, Since 31 Dec 22 | CEMPRO3% ₹26 Cr 243,152
↓ -65,994 Petronet LNG Ltd (Energy)
Equity, Since 31 Jan 26 | PETRONET3% ₹25 Cr 931,486
↑ 138,246 Stylam Industries Ltd (Consumer Cyclical)
Equity, Since 30 Apr 25 | 5269513% ₹24 Cr 83,372 Lloyds Metals & Energy Ltd (Basic Materials)
Equity, Since 30 Nov 24 | 5124553% ₹23 Cr 130,000
↓ -53,702 10. Canara Robeco Infrastructure
Canara Robeco Infrastructure
Growth Launch Date 2 Dec 05 NAV (24 Jul 26) ₹166.11 ↓ -0.64 (-0.38 %) Net Assets (Cr) ₹998 on 30 Jun 26 Category Equity - Sectoral AMC Canara Robeco Asset Management Co. Ltd. Rating Risk High Expense Ratio 2.32 Sharpe Ratio 0.02 Information Ratio 0 Alpha Ratio 0 Min Investment 5,000 Min SIP Investment 1,000 Exit Load 0-1 Years (1%),1 Years and above(NIL) Growth of 10,000 investment over the years.
Date Value 30 Jun 21 ₹10,000 30 Jun 22 ₹10,964 30 Jun 23 ₹14,661 30 Jun 24 ₹25,325 30 Jun 25 ₹25,500 30 Jun 26 ₹26,666 Returns for Canara Robeco Infrastructure
absolute basis & more than 1 year are on CAGR (Compound Annual Growth Rate) basis. as on 23 Jul 26 Duration Returns 1 Month -3.1% 3 Month -2.8% 6 Month 11.3% 1 Year 2.6% 3 Year 20% 5 Year 19.6% 10 Year 15 Year Since launch 14.6% Historical performance (Yearly) on absolute basis
Year Returns 2025 0.1% 2024 35.3% 2023 41.2% 2022 9% 2021 56.1% 2020 9% 2019 2.3% 2018 -19.1% 2017 40.2% 2016 2.1% Fund Manager information for Canara Robeco Infrastructure
Name Since Tenure Vishal Mishra 26 Jun 21 5.01 Yr. Shridatta Bhandwaldar 29 Sep 18 7.76 Yr. Data below for Canara Robeco Infrastructure as on 30 Jun 26
Equity Sector Allocation
Sector Value Industrials 46.53% Utility 12.52% Basic Materials 11.01% Energy 7.46% Financial Services 6.8% Communication Services 3.99% Technology 3.66% Consumer Cyclical 2.25% Real Estate 0.9% Asset Allocation
Asset Class Value Cash 4.86% Equity 95.14% Top Securities Holdings / Portfolio
Name Holding Value Quantity Larsen & Toubro Ltd (Industrials)
Equity, Since 28 Feb 11 | LT10% ₹99 Cr 242,151
↑ 9,250 Reliance Industries Ltd (Energy)
Equity, Since 30 Apr 22 | RELIANCE5% ₹49 Cr 373,750
↑ 60,000 CG Power & Industrial Solutions Ltd (Industrials)
Equity, Since 31 Oct 23 | CGPOWER5% ₹48 Cr 525,650 NTPC Ltd (Utilities)
Equity, Since 30 Nov 18 | NTPC4% ₹41 Cr 1,066,480 Bharti Airtel Ltd (Communication Services)
Equity, Since 31 May 24 | BHARTIARTL4% ₹40 Cr 216,600
↑ 55,000 State Bank of India (Financial Services)
Equity, Since 31 Jul 24 | SBIN4% ₹39 Cr 406,500
↑ 20,000 Bharat Electronics Ltd (Industrials)
Equity, Since 31 Jul 19 | BEL4% ₹38 Cr 929,000
↑ 60,000 Tata Power Co Ltd (Utilities)
Equity, Since 30 Sep 24 | TATAPOWER4% ₹37 Cr 870,000 Cummins India Ltd (Industrials)
Equity, Since 31 Jul 24 | CUMMINSIND3% ₹33 Cr 56,000
↓ -2,500 InterGlobe Aviation Ltd (Industrials)
Equity, Since 31 Jan 23 | INDIGO3% ₹31 Cr 70,000
↑ 6,000
بہترین SIP سرمایہ کاری کا انتخاب کیسے کریں؟
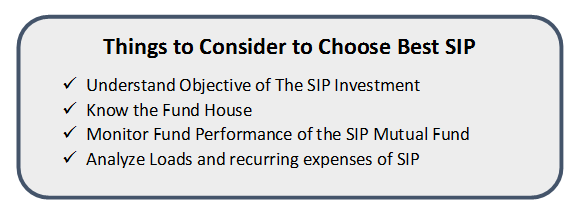
مختلف میوچل فنڈز ہیں جو آپ کو SIP کے ذریعے سرمایہ کاری کرنے کی اجازت دیتے ہیں۔ لیکن بنیادی مسئلہ انتخاب کا ہے۔بہترین باہمی فنڈز ایس آئی پی کے لیے۔ اگرچہ بہترین میوچل فنڈز ہر شخص میں مختلف ہو سکتے ہیں، ذیل میں کچھ نکات کی فہرست دی گئی ہے جن پر سرمایہ کار بہترین SIP میوچل فنڈ کا انتخاب کرنے سے پہلے غور کر سکتے ہیں۔
SIP سرمایہ کاری کے مقصد کو سمجھیں۔
جب سرمایہ کاری کی بات آتی ہے تو ہم میں سے ہر ایک کا مقصد مختلف ہوتا ہے۔ لہذا SIP کے ذریعے میوچل فنڈز میں سرمایہ کاری کرنے سے پہلے، یہ مشورہ دیا جاتا ہے کہ آپ اپنے سرمایہ کاری کے اہداف کی واضح تصویر حاصل کریں اوررسک پروفائل. عام طور پر،ایکویٹی میوچل فنڈز طویل مدتی مقاصد کے لیے فائدہ مند سمجھا جاتا ہے جبکہکرنسی مارکیٹ اورقرض فنڈ مختصر مدت کے مقاصد کے لیے موزوں ہیں۔
فنڈ ہاؤس کو جانیں۔
SIP ریٹرن کا ایک بڑا حصہ فنڈ ہاؤس پر منحصر ہے جو آپ کی طرف سے آپ کے پیسے کا انتظام کرتا ہے۔ اگر فنڈ ہاؤس اپنے مقصد میں ناکام ہو جاتا ہے، تو آپ اپنی رقم کھونے والے ہوں گے۔ یہ یقینی بنانے کے لیے کہ آپ کے پاس بہترین SIP پلان ہے ایک معروف فنڈ ہاؤس کا انتخاب کریں۔
ایس آئی پی میوچل فنڈ کے فنڈ کی کارکردگی کی نگرانی کریں۔
بنیادی وجوہات میں سے ایک جس کی وجہ سے لوگمیوچل فنڈز میں سرمایہ کاری کریں۔ ایس آئی پی کے ذریعے پیسہ کمانا ہے۔ لہذا، بہترین فنڈ کا انتخاب کرنے اور پھر بہترین SIP منصوبوں میں سرمایہ کاری کرنے کے لیے وقت کے دوران فنڈز کی کارکردگی کا تجزیہ کرنا ضروری ہے۔ عام طور پر، ایکویٹی Mutual Funds کے لیے طویل مدتی کارکردگی کو دیکھا جاتا ہے، جبکہ قرض کے لیے Mutual Funds مختصر سے درمیانی مدت کے منافع پر غور کیا جاتا ہے۔
SIP کے بوجھ اور بار بار چلنے والے اخراجات کا تجزیہ کریں۔
آخری لیکن کم از کم نہیں، ایگزٹ لوڈ اور اخراجات کا تناسب اگر ایک مخصوص مدت (عام طور پر لاک ان پیریڈ کہلاتا ہے) سے پہلے سرمایہ کاری کو چھڑا لیا جائے۔
لہذا، یہ مشورہ دیا جاتا ہے کہ ان پیرامیٹرز کو ذہن میں رکھتے ہوئے بہترین SIP پلانز کا انتخاب کریں۔ سرمایہ کاری کرنے سے پہلے سوچیں!
SIP کیلکولیٹر (SIP ریٹرن کیلکولیٹر)
کے لیےمعاشی منصوبہ بندی، ایس آئی پی کیلکولیٹر یا ایس آئی پی ریٹرن کیلکولیٹر بہترین ٹولز میں سے ایک ہے۔
یہ مانیٹر کرنے کے لیے کہ آپ کا SIP کمپاؤنڈنگ کی طاقت سے کیسے بڑھتا ہے، ذیل کی مثال پر غور کریں۔
| ماہانہ سرمایہ کاری | سرمایہ کاری کی مدت | سرمایہ کاری کی کل رقم | حتمی قیمت @ 14% p.a. |
|---|---|---|---|
| 1،000 | 5 سال | 60,000 | 87,200 |
| 1,000 | 10 سال | 1,20,000 | 2,62,091 |
| 1,000 | 15 سال | 1,80,000 | 6,12,853 |
مندرجہ بالا جدول میں بتایا گیا ہے کہ اگر آپ SIP Mutual Fund میں ماہانہ INR 1,000 کی سرمایہ کاری کرتے ہیں، تو 5 سالوں میں آپ کی کل سرمایہ کاری INR 60,000 ہوگی اور آپ کا SIP 14% p.a کے مفروضہ واپسی فیصد پر واپس آئے گا۔ ہو گا87,2001 روپےبالترتیب اسی طرح 10 سالوں میں کل سرمایہ کاری ہوگی۔INR 1,20,000 اور SIP 14% p.a کی فرضی فیصد پر واپسی ہو گاINR 2,62,091.
اسی طرح 15 سال میں سرمایہ کاری ہوگی۔INR 1,80,000 اور 14% p.a کی واپسی کے فیصد پر حتمی قیمت ہوگی۔6,12,853 روپےبالترتیب
لہذا، صرف ایک مہینے میں INR 1,000 کی سرمایہ کاری کرکے، دیکھیں کہ آنے والے سالوں میں آپ کی رقم کیسے بڑھے گی۔ سرمایہ کاری کے لیے بہترین SIP میوچل فنڈ کا انتخاب کرتے وقت مذکورہ بالا حسابات پر غور کریں۔
اکثر پوچھے گئے سوالات
1. SIP کیا ہے؟
A: ایس آئی پی یا سیسٹیمیٹک انویسٹمنٹ پلان ایک سرمایہ کاری کا راستہ ہے جو میوچل فنڈ اسکیم کے تحت پیش کیا جاتا ہے، جہاں اسکیم کے تحت باقاعدہ وقفوں پر ایک مخصوص رقم کی سرمایہ کاری کی جاتی ہے۔ یہ قسط 500 روپے تک ہو سکتی ہے۔
2. SIP کے کیا فوائد ہیں؟
A: SIP کا بنیادی فائدہ یہ ہے کہ یہ سرمایہ کاری کو زیادہ نظم و ضبط بناتا ہے۔ یہ سرمایہ کار کو بنانے کی اجازت دیتا ہے۔مالیاتی منصوبہ مفید ہے اور سرمایہ کار میں سرمایہ کاری کی عادت پیدا کرنے میں مدد کرتا ہے۔
3. SIP میں کون سرمایہ کاری کر سکتا ہے؟
A: کوئی بھی ایس آئی پی میں سرمایہ کاری کر سکتا ہے۔ لیکن، آپ کو اپنے خطرے کا تجزیہ کرنا چاہیے، مطلب یہ ہے کہ آپ کتنا خطرہ مول لینا چاہتے ہیں۔ اس کے علاوہ، شروع کرنے کے لیے، آپ کو PAN کی تفصیلات، ایڈریس پروف، اور کی ضرورت ہے۔بینک تفصیلات
4. آف لائن موڈ میں SIP میں سرمایہ کاری کرنے کے کیا اقدامات ہیں؟
A: آف لائن موڈ میں سرمایہ کاری کرنے کے لیے، آپ کو درخواست فارم کو پُر کرنا ہوگا، ماہانہ یا سہ ماہی SIP رقم کے لیے ایک چیک جمع کرانا ہوگا، اس کی ایک کاپی فراہم کرنا ہوگی۔پین کارڈآپ کے بینک کی تفصیلات کے ثبوت کے طور پر ایڈریس کا ثبوت، اور ایک منسوخ شدہ چیک۔
5. مجھے ICICI پرڈینشل ٹیکنالوجی فنڈ میں کیوں سرمایہ کاری کرنی چاہیے؟
A: ICICI پرڈینشل ٹیکنالوجی فنڈ نے 3 مارچ 2000 کو اپنے آغاز کے بعد سے 11.9% کی واپسی ظاہر کی ہے۔ دوسرے فنڈز کے برعکس، سال 2020 میں، اس نے 70.6% کی واپسی قائم کی ہے۔ لہذا، آئی سی آئی سی آئی پرڈینشل ٹیکنالوجی فنڈ میں سرمایہ کاری فائدہ مند ثابت ہوئی ہے اور اس نے پانچ سالوں کے لیے ایس آئی پی میں سرمایہ کاری کی ہے۔
6. مجھے ایس بی آئی بلیوچپ فنڈ ریگولر گروتھ میں کیوں سرمایہ کاری کرنی چاہئے؟
A: ایس بی آئی بلیوچپ فنڈ ریگولر گروتھ نے پانچ سالہ ترقی کی شرح ظاہر کی ہے۔5.29%، جو نسبتاً زیادہ ہے۔
7. SIP میں سرمایہ کاری کرتے وقت آپ کو کن چیزوں پر غور کرنا چاہیے؟
A: جب آپ SIP میں سرمایہ کاری کرتے ہیں، تو آپ کو خالص اثاثہ کی قیمت یانہیں ہیں. یہ وہ سرمایہ کاری ہے جو آپ اسکیم کے لیے کرتے ہیں۔ آپ کو اس کی ریٹنگز اور اس کی تاریخی کارکردگی کو بھی چیک کرنا چاہیے۔ اس بات کو یقینی بنانے کے لیے کہ آپ کی سرمایہ کاری محفوظ ہے SIP سے حاصل ہونے والے منافع کو سمجھنا ضروری ہے۔
8. کیا SIP کے لیے KYC اہم ہے؟
A: ہاں، SIP کے لیے بھی KYC ضروری ہے۔ چونکہ SIP میوچل فنڈ کی اسکیم کے تحت آتا ہے، آپ کو SIP میں سرمایہ کاری کرنے کے لیے KYC دستاویزات فراہم کرنے ہوں گے۔
9. کیا SIPs میں کم از کم سرمایہ کاری کی ضرورت ہوتی ہے؟
A: ہاں، کچھ SIPs میں کم از کم سرمایہ کاری کی ضرورت ہوتی ہے۔ مثال کے طور پر، آدتیہ برلا سن لائف ڈیجیٹل انڈیا فنڈ میں کم از کم SIP سرمایہ کاری کی ضرورت ہے 1000 روپے۔ ایس بی آئی بلیوچپ فنڈ ریگولر گروتھ کی کم از کم ضرورت 5000 روپے ہے۔ اس طرح، آپ جس SIP میں سرمایہ کاری کر رہے ہیں اس پر منحصر ہے، آپ کو اپنی سرمایہ کاری کی رقم میں اضافہ کرنا پڑے گا۔
یہاں فراہم کردہ معلومات کے درست ہونے کو یقینی بنانے کے لیے تمام کوششیں کی گئی ہیں۔ تاہم، ڈیٹا کی درستگی کے حوالے سے کوئی ضمانت نہیں دی جاتی ہے۔ براہ کرم کوئی بھی سرمایہ کاری کرنے سے پہلے اسکیم کی معلومات کے دستاویز کے ساتھ تصدیق کریں۔
You Might Also Like


What Is The Best Date For Sips And Does It Really Affect Returns?


Best Liquid Mutual Funds In 2026 - A Complete Investor Guide

When To Increase, Pause, Or Stop Your SIP? A Complete Guide Most Investors Ignore
 – Expert Buying Guide")
Best Smartphones Under ₹30,000 In India (2025) – Expert Buying Guide

E Filing Of Income Tax – A Complete Guide To File Income Tax Return
AMFI Registration No. 112358 | CIN: U74999MH2016PTC282153
Shepard Technologies Pvt. Ltd. (with ARN code 112358) makes no warranties or representations, express or implied, on products offered through the platform. It accepts no liability for any damages or losses, however caused, in connection with the use of, or on the reliance of its product or related services. Terms and conditions of the website are applicable.
©2026 Shepard Technologies Private Limited. All Rights Reserved
helpful to invest in SIP