এসআইপি বনাম লাম্প সাম
এসআইপি বনাম একক যোগফলবিনিয়োগ? বিভিন্ন নিবন্ধ রয়েছে যা বলে যে পদ্ধতিগত বিনিয়োগ পরিকল্পনা (বা এসআইপি) এর জন্য নেওয়া সেরা পথমিউচুয়াল ফান্ডে বিনিয়োগ. বিভিন্নচুমুক ক্যালকুলেটর আপনাকে সেই লক্ষ্যের জন্য পরিকল্পনা করতে সাহায্য করে, অনেক ওয়েবসাইট এবং আর্থিক পরিকল্পনাকারীরাও সমর্থন করবেশীর্ষ SIP বিনিয়োগ করার পরিকল্পনা। বেশিরভাগই রুপি খরচের গড় এবং SIP-এর সুবিধা সম্পর্কে কথা বলবে, এই বলে যে স্টকে প্রবেশ করাবাজার একমুঠো বিনিয়োগের মাধ্যমে সেরা উপায় নাও হতে পারে। যদিও কেউ এসআইপি-র জন্য সেরা মিউচুয়াল ফান্ডে প্রবেশ করতে পারে, কেউ কি বিনিয়োগের মোড হিসাবে এসআইপি ব্যবহার করে একক বিনিয়োগের চেয়ে ভাল রিটার্ন আশা করতে পারে?
এসআইপি বা একক সমষ্টি: সময় নয় সময়ের জন্য বিনিয়োগ করুন
বিনিয়োগ সবসময় রিটার্ন জেনারেট করার ক্ষমতা সম্পর্কে. এটি একটি একক বিনিয়োগ বা একটি পদ্ধতিগত কিনাবিনিয়োগ পরিকল্পনা, একজনকে বিচক্ষণ হতে হবে এবং সঠিক সিদ্ধান্ত নিতে হবে। বিনিয়োগ করছেযৌথ পুঁজি সবসময় নির্বাচন সম্পর্কে নয়সেরা মিউচুয়াল ফান্ড অথবাসেরা SIP পরিকল্পনা. আরও অনেক কিছু আছে যা বিবেচনা করা দরকার। বিশেষ করে, যদি কেউ ইক্যুইটি বাজারে বিনিয়োগ করার কথা ভাবছেন, তবে একজনকে আরও সতর্ক হতে হবে। স্টক মার্কেটের একটি বিশ্লেষণ (বিএসই সেনসেক্সকে বেঞ্চমার্ক হিসাবে গ্রহণ করা) ফল দেয় যে কেউ যদি দীর্ঘমেয়াদে বিনিয়োগ করে থাকে তবে রিটার্ন পাওয়ার সম্ভাবনা বৃদ্ধি পায়। নিচের সারণী থেকে দেখা যায়, যদি কেউ শুধু সংখ্যা দিয়ে যায়, তাহলে 30% সম্ভাবনা থাকে যে আপনি যদি স্টক মার্কেটে শুধুমাত্র 1 বছরের জন্য বিনিয়োগ করার পরিকল্পনা করেন তাহলে আপনার ক্ষতি হতে পারে।
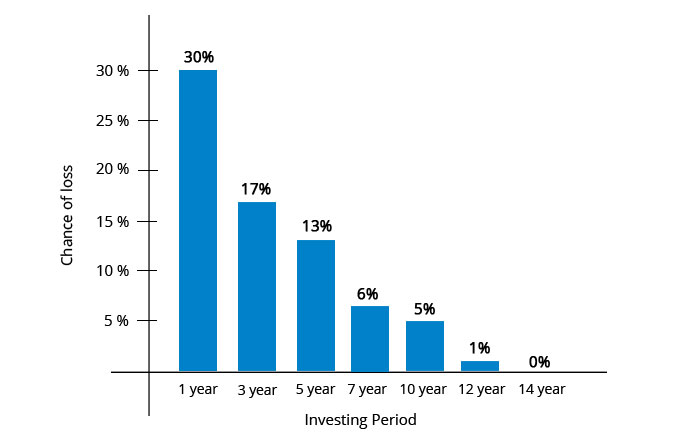
তাই বেশিরভাগ উপদেষ্টারা যখন ইক্যুইটি বিনিয়োগের বিষয়ে কথা বলেন তখন সর্বদা এর সাথে সম্পর্কিত হবেইক্যুইটি "দীর্ঘমেয়াদী বিনিয়োগ" সহ। যদি কেউ 5 বছরের জন্য বিনিয়োগে থাকার পরিকল্পনা করে তবে ক্ষতি হওয়ার সম্ভাবনা 13% এ নেমে আসে। এবং যদি কেউ সত্যিই দীর্ঘমেয়াদী হয় (10 বছরের বেশি), তবে ক্ষতি করার ক্ষমতা শূন্যের দিকে ঝোঁক। অতএব, যদি কেউ সত্যিই স্টক মার্কেট থেকে অর্থ উপার্জন করতে আগ্রহী হয়, তবে এটি স্টক মার্কেটে সময় কাটানো সম্পর্কে। (সময় চিহ্নিত করার পরিবর্তে!)

এসআইপি বা একক সমষ্টি: একটি বিশ্লেষণ
এটা বেশ স্পষ্ট যে ইক্যুইটি বাজারে বিনিয়োগ একটি দীর্ঘমেয়াদী খেলা। অনেক লোক পরামর্শ দেন যে SIP-এর সুবিধাগুলি রুপি খরচ থেকে সুশৃঙ্খল বিনিয়োগ পর্যন্ত প্রসারিত হয়, কিন্তু একটি বড় প্রশ্নের উত্তর দিতে হবে, SIP গুলি কি একক বিনিয়োগের চেয়ে ভাল রিটার্ন প্রদান করে?
আমরা 1979 সাল থেকে (বিএসই সেনসেক্সের সূচনা থেকে) ইক্যুইটি বাজারগুলি দেখে এই প্রশ্নের গভীরভাবে বোঝার চেষ্টা করেছি। বিএসই সেনসেক্স হল ভারতের শীর্ষ 30টি কোম্পানির একটি সংমিশ্রণ এবং এটি ইক্যুইটি বাজারের প্রতিনিধিত্ব করে। এই ডেটা বিশ্লেষণ করে, আমরা কিছু অন্তর্দৃষ্টি পেতে পারি তা দেখতে SIP বা একক যোগ, যা ভাল।
Talk to our investment specialist
স্টক মার্কেটের সবচেয়ে খারাপ সময়কাল
বিনিয়োগ শুরু করার সবচেয়ে খারাপ সময় ছিল সেপ্টেম্বর 1994 এর কাছাকাছি (এই সময়টি ছিল যখন স্টক মার্কেট শীর্ষে ছিল)। প্রকৃতপক্ষে, যদি কেউ বাজারের তথ্যের দিকে তাকায়বিনিয়োগকারী যারা একমুঠো বিনিয়োগ করেছিল 59 মাস (প্রায় 5 বছর!) নেতিবাচক রিটার্নে বসেছিল। এমনকি 1999 সালের জুলাই মাসে বিনিয়োগকারীরা ভেঙে পড়ে। পরের বছর যদিও কিছু রিটার্ন জেনারেট হয়েছিল, 2000 স্টক মার্কেট ক্র্যাশের কারণে এই রিটার্নগুলি স্বল্পস্থায়ী ছিল। আরও 4 বছর (নেতিবাচক রিটার্ন সহ) কষ্ট সহ্য করার পর এবং বিনিয়োগকারী অবশেষে অক্টোবর 2003-এ ইতিবাচক হয়ে ওঠে। এটি একটি একক অঙ্কের বিনিয়োগ করার জন্য সম্ভবত সবচেয়ে খারাপ সময় ছিল।
SIP বিনিয়োগকারীর কি হয়েছে? সিস্টেমেটিক ইনভেস্টমেন্ট প্ল্যান বিনিয়োগকারী শুধুমাত্র 19 মাসের জন্য নেতিবাচক ছিল এবং মুনাফা পোস্ট করা শুরু করে, তবে, এইগুলি স্বল্পস্থায়ী ছিল। SIP বিনিয়োগকারীরা অন্তর্বর্তীকালীন লোকসান ভোগ করার পর মে 1999 এর মধ্যে আবার উপরে উঠেছিল। যদিও যাত্রাটি এখনও নড়বড়ে ছিল, এসআইপি বিনিয়োগকারীরা পোর্টফোলিওতে অনেক আগেই লাভ দেখিয়েছিল। একক বিনিয়োগকারীর জন্য সর্বাধিক ক্ষতি ছিল প্রায় 40%, যেখানে SIP বিনিয়োগকারীর জন্য ছিল 23%। পদ্ধতিগত বিনিয়োগ পরিকল্পনা বিনিয়োগকারীর দ্রুত পুনরুদ্ধারের সময়কালের পাশাপাশি পোর্টফোলিওতে কম ক্ষতি ছিল।
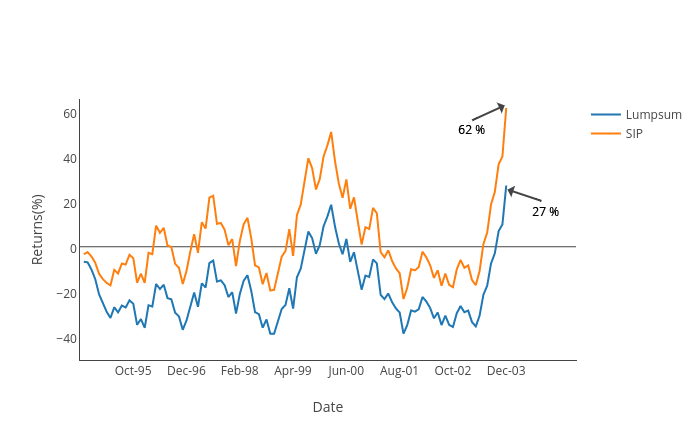
বিনিয়োগ শুরু করার জন্য আরেকটি অত্যন্ত বিষণ্ণ সময় ছিল মার্চ 2000 এর কাছাকাছি (এই সময়টি ছিল যখন স্টক মার্কেট আবার শীর্ষে ছিল!) প্রকৃতপক্ষে, যদি কেউ বাজারের ডেটা দেখেন যে বিনিয়োগকারী একমুঠো বিনিয়োগ করেছিলেন তারা সরাসরি 45 মাস (প্রায় 4 বছর!) নেতিবাচক রিটার্নে বসেছিলেন। 2003 সালের ডিসেম্বরের মধ্যেও বিনিয়োগকারী ভেঙে পড়ে। পরের বছর যদিও কিছু রিটার্ন জেনারেট হয়েছিল, 2004 সালে আবার স্লিপের কারণে এই রিটার্নগুলি স্বল্পস্থায়ী ছিল। আরও 1 বছর ধরে ভোগার পর, বিনিয়োগকারী অবশেষে সেপ্টেম্বর 2004-এ ইতিবাচক হয়ে ওঠে। একমুঠো বিনিয়োগ করার জন্য আরেকটি খারাপ সময় ছিল।
2000 সালের মার্চ মাসে বিনিয়োগ শুরু করা SIP বিনিয়োগকারীর গল্প কী ছিল? যদি কেউ মাসিক পরিমাণে সমান পরিমাণে বিনিয়োগ করে, বিনিয়োগকারী জুন 2003-এ ইতিবাচক ছিল এবং সেপ্টেম্বর 2004 এর মধ্যে, পোর্টফোলিও সামগ্রিকভাবে 45% বৃদ্ধি পেয়েছিল। (যখন একমুঠো বিনিয়োগকারী সমান ভাঙ্গছিল)। উল্লেখ্য আরেকটি দিক হল সর্বাধিক ক্ষতি, একক বিনিয়োগকারী সেপ্টেম্বর 2001 এর মধ্যে প্রায় 50% ক্ষতির সম্মুখীন হয়েছে, তুলনামূলকভাবে, একই সময়ে SIP পোর্টফোলিও ক্ষতি ছিল 28%।
উপরের থেকে আমরা যা পেতে পারি তা হল যে যখন স্টক মার্কেট খারাপ সময়ের জন্য থাকে, তখন একটি এসআইপিতে থাকা সর্বদা ভাল কারণ পুনরুদ্ধার দ্রুত হয় এবং পোর্টফোলিওতেও কম লোকসান দেখা যায়।
স্টক মার্কেটের সেরা সময়কাল
1979 থেকে 2016 পর্যন্ত স্টক মার্কেটের গত 37 বছরের ডেটার দিকে তাকালে, কেউ বুঝতে পারে যে কেউ যদি প্রথম দিকে বিনিয়োগ করে (1979 - BSE সেনসেক্সের শুরুর সময়), পোর্টফোলিওতে খুব কমই কোনও নেতিবাচক রিটার্ন দেখতে পায়।
আগস্ট 1979 থেকে একটি 5-বছরের বিশ্লেষণ দেখায় যে একক পরিমাণ এবং সিস্টেমেটিক ইনভেস্টমেন্ট প্ল্যান পোর্টফোলিও উভয়ই সেখান থেকে যে কোনও সময়ের মধ্যে খুব কমই কোনও ক্ষতি পোস্ট করেছে। নীচের গ্রাফ থেকে দেখা যায়, উভয় পোর্টফোলিওই বছরে সুদর্শন লাভ করেছে। প্রতি বছরের শেষে, একমুঠো পোর্টফোলিও SIP পোর্টফোলিওকে ছাড়িয়ে গেছে এবং লিড মার্জিনও বাড়িয়েছে।
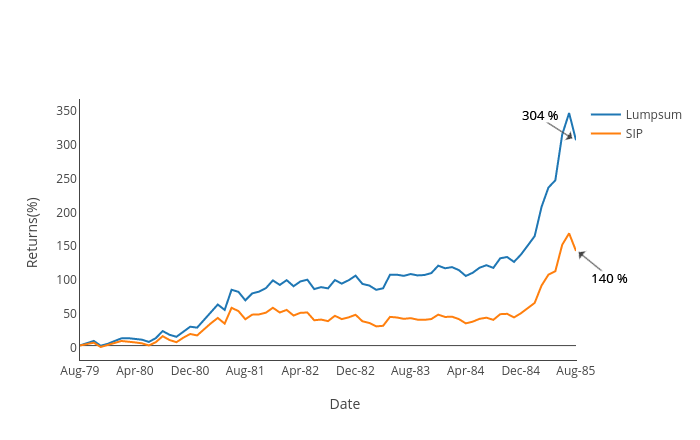
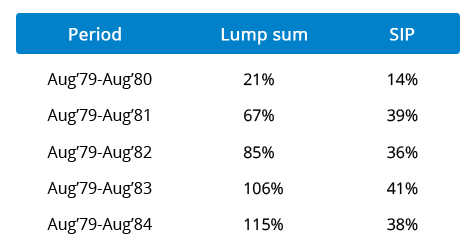
অত:পর, যদি বাজার একদিকে বাড়তে পারে বলে আশা করা হয়, তাহলে একক যোগফল সর্বদাই উত্তম বিকল্প।
কোনটি ভাল বিনিয়োগ মোড?
যদিও আমরা স্টক মার্কেটের সমস্ত সময়কাল বিশ্লেষণ করতে পারি, আমরা কি সত্যিই সিদ্ধান্ত নিতে পারি কোনটি ভাল? এই উত্তর ব্যক্তি থেকে ব্যক্তি পরিবর্তিত হয়,নগদ প্রবাহ, বিনিয়োগ (বা হোল্ডিং) সময়কাল, বহির্গামী নগদ প্রবাহ বা প্রয়োজনীয়তা ইত্যাদি। SIP সঞ্চয়ের অভ্যাস গড়ে তোলার জন্য একটি দুর্দান্ত হাতিয়ার, তারা স্টক মার্কেটে ব্যক্তির বিনিয়োগকে চ্যানেলাইজ করে। আপনি যদি ইক্যুইটিতে বিনিয়োগ করার পরিকল্পনা করেন তবে একজনকে দীর্ঘমেয়াদে বিনিয়োগের পরিকল্পনা করতে হবে, যেখানে আমরা স্পষ্টভাবে জানি যে সময়ের সাথে সাথে রিটার্ন জেনারেট করার ক্ষমতা বৃদ্ধি পায়। এছাড়াও, যদি কেউ মনে করে যে বাজারগুলি ছিন্নভিন্ন হতে পারে এবং সোজা লাইন আপ নয়, তবে SIPগুলি বাজারে প্রবেশের জন্য একটি দুর্দান্ত হাতিয়ার। উপরন্তু, ডেটা দেখায় যে SIPগুলি নিশ্চিত করে যে বিনিয়োগকারী যে কোনও সময় কম ক্ষতির সম্মুখীন হয়।
যদি মনে হয় যে বাজার উল্টোদিকে ধর্মনিরপেক্ষ (একভাবে!) হবে, সেই পরিস্থিতিতে, একমুঠো বিনিয়োগই হবে পথ।
ভারতে সেরা পারফর্মিং এসআইপি প্ল্যান 2022
The primary investment objective of the Scheme is to seek capital appreciation by investing predominantly in the units of BlackRock Global Funds – World Mining Fund. The Scheme may, at the discretion of the Investment Manager, also invest in the units of other similar overseas mutual fund schemes, which may
constitute a significant part of its corpus. The Scheme may also invest a certain portion of its corpus in money market securities and/or money market/liquid schemes of DSP BlackRock Mutual Fund, in order to meet liquidity requirements from time to time. Below is the key information for DSP World Mining Fund Returns up to 1 year are on "The primary investment objective of the Scheme is to seek capital appreciation by investing predominantly in units of MLIIF - WGF. The Scheme may, at the discretion of the Investment Manager, also invest in the units of other similar overseas mutual fund schemes, which may constitute a significant part of its corpus. The Scheme may also invest a certain portion of its corpus in money market securities and/or units of money market/liquid schemes of DSP Merrill Lynch Mutual Fund, in order to meet liquidity requirements from time to time. However, there is no assurance that the investment objective of the Scheme will be realized." Research Highlights for DSP World Gold Fund Below is the key information for DSP World Gold Fund Returns up to 1 year are on The primary investment objective of the Scheme is to seek to provide long term capital growth by investing predominantly in the JPMorgan Funds - Emerging Markets Opportunities Fund, an equity fund which invests primarily in an aggressively managed portfolio of emerging market companies Research Highlights for Edelweiss Emerging Markets Opportunities Equity Off-shore Fund Below is the key information for Edelweiss Emerging Markets Opportunities Equity Off-shore Fund Returns up to 1 year are on The investment objective of the scheme is to provide long-term capital appreciation by investing in an overseas mutual fund scheme that invests in a diversified portfolio of securities as prescribed by SEBI from time to time in global emerging markets. Research Highlights for Kotak Global Emerging Market Fund Below is the key information for Kotak Global Emerging Market Fund Returns up to 1 year are on The primary investment objective of the Scheme is to seek capital appreciation by investing predominantly in the units of BlackRock Global Funds – World Energy Fund and BlackRock Global Funds – New Energy Fund. The Scheme may, at the discretion of the Investment Manager, also invest in the units of other similar overseas mutual fund schemes, which may constitute a significant part of its corpus. The Scheme may also invest a certain portion of its corpus in money market securities
and/or money market/liquid schemes of DSP BlackRock Mutual Fund, in order to meet liquidity
requirements from time to time. Research Highlights for DSP World Energy Fund Below is the key information for DSP World Energy Fund Returns up to 1 year are on 1. DSP World Mining Fund
DSP World Mining Fund
Growth Launch Date 29 Dec 09 NAV (24 Jul 26) ₹30.4049 ↓ -0.11 (-0.37 %) Net Assets (Cr) ₹164 on 30 Jun 26 Category Equity - Global AMC DSP BlackRock Invmt Managers Pvt. Ltd. Rating ☆☆☆ Risk High Expense Ratio 1.14 Sharpe Ratio 1.74 Information Ratio 0 Alpha Ratio 0 Min Investment 1,000 Min SIP Investment 500 Exit Load 0-12 Months (1%),12 Months and above(NIL) Growth of 10,000 investment over the years.
Date Value 30 Jun 21 ₹10,000 30 Jun 22 ₹9,282 30 Jun 23 ₹10,814 30 Jun 24 ₹11,032 30 Jun 25 ₹11,747 30 Jun 26 ₹20,331 Returns for DSP World Mining Fund
absolute basis & more than 1 year are on CAGR (Compound Annual Growth Rate) basis. as on 24 Jul 26 Duration Returns 1 Month 1.2% 3 Month -7.4% 6 Month -4.7% 1 Year 64.6% 3 Year 23.6% 5 Year 16.2% 10 Year 15 Year Since launch 6.9% Historical performance (Yearly) on absolute basis
Year Returns 2025 79% 2024 -8.1% 2023 0% 2022 12.2% 2021 18% 2020 34.9% 2019 21.5% 2018 -9.4% 2017 21.1% 2016 49.7% Fund Manager information for DSP World Mining Fund
Name Since Tenure Kaivalya Nadkarni 1 May 25 1.17 Yr. Data below for DSP World Mining Fund as on 30 Jun 26
Equity Sector Allocation
Sector Value Basic Materials 93.17% Energy 1.11% Asset Allocation
Asset Class Value Cash 5.71% Equity 94.28% Debt 0.01% Top Securities Holdings / Portfolio
Name Holding Value Quantity BGF World Mining I2
Investment Fund | -96% ₹180 Cr 141,035 Treps / Reverse Repo Investments
CBLO/Reverse Repo | -4% ₹7 Cr Net Receivables/Payables
Net Current Assets | -0% ₹0 Cr 2. DSP World Gold Fund
DSP World Gold Fund
Growth Launch Date 14 Sep 07 NAV (24 Jul 26) ₹50.3797 ↑ 0.25 (0.50 %) Net Assets (Cr) ₹1,433 on 30 Jun 26 Category Equity - Global AMC DSP BlackRock Invmt Managers Pvt. Ltd. Rating ☆☆☆ Risk High Expense Ratio 1.41 Sharpe Ratio 1.22 Information Ratio -0.5 Alpha Ratio 2.12 Min Investment 1,000 Min SIP Investment 500 Exit Load 0-12 Months (1%),12 Months and above(NIL) Growth of 10,000 investment over the years.
Date Value 30 Jun 21 ₹10,000 30 Jun 22 ₹8,181 30 Jun 23 ₹9,294 30 Jun 24 ₹10,640 30 Jun 25 ₹16,808 30 Jun 26 ₹27,693 Returns for DSP World Gold Fund
absolute basis & more than 1 year are on CAGR (Compound Annual Growth Rate) basis. as on 24 Jul 26 Duration Returns 1 Month 1% 3 Month -16.9% 6 Month -23.1% 1 Year 61.1% 3 Year 42.9% 5 Year 23.4% 10 Year 15 Year Since launch 9% Historical performance (Yearly) on absolute basis
Year Returns 2025 167.1% 2024 15.9% 2023 7% 2022 -7.7% 2021 -9% 2020 31.4% 2019 35.1% 2018 -10.7% 2017 -4% 2016 52.7% Fund Manager information for DSP World Gold Fund
Name Since Tenure Kaivalya Nadkarni 1 May 25 1.17 Yr. Data below for DSP World Gold Fund as on 30 Jun 26
Equity Sector Allocation
Sector Value Basic Materials 94.47% Asset Allocation
Asset Class Value Cash 3.62% Equity 94.47% Debt 0% Other 1.91% Top Securities Holdings / Portfolio
Name Holding Value Quantity BGF World Gold I2
Investment Fund | -68% ₹1,141 Cr 1,005,044 VanEck Gold Miners ETF
- | GDX29% ₹490 Cr 573,719 Treps / Reverse Repo Investments
CBLO/Reverse Repo | -3% ₹54 Cr Net Receivables/Payables
Net Current Assets | -0% -₹6 Cr 3. Edelweiss Emerging Markets Opportunities Equity Off-shore Fund
Edelweiss Emerging Markets Opportunities Equity Off-shore Fund
Growth Launch Date 7 Jul 14 NAV (24 Jul 26) ₹27.628 ↓ -0.69 (-2.43 %) Net Assets (Cr) ₹259 on 30 Jun 26 Category Equity - Global AMC Edelweiss Asset Management Limited Rating ☆☆☆ Risk High Expense Ratio 1.04 Sharpe Ratio 2.2 Information Ratio -0.41 Alpha Ratio 6.3 Min Investment 5,000 Min SIP Investment 1,000 Exit Load 0-1 Years (1%),1 Years and above(NIL) Growth of 10,000 investment over the years.
Date Value 30 Jun 21 ₹10,000 30 Jun 22 ₹7,234 30 Jun 23 ₹7,605 30 Jun 24 ₹8,447 30 Jun 25 ₹9,445 30 Jun 26 ₹15,783 Returns for Edelweiss Emerging Markets Opportunities Equity Off-shore Fund
absolute basis & more than 1 year are on CAGR (Compound Annual Growth Rate) basis. as on 24 Jul 26 Duration Returns 1 Month -3.5% 3 Month 4.5% 6 Month 19.5% 1 Year 55.6% 3 Year 25.5% 5 Year 9.7% 10 Year 15 Year Since launch 8.8% Historical performance (Yearly) on absolute basis
Year Returns 2025 41.1% 2024 5.9% 2023 5.5% 2022 -16.8% 2021 -5.9% 2020 21.7% 2019 25.1% 2018 -7.2% 2017 30% 2016 9.8% Fund Manager information for Edelweiss Emerging Markets Opportunities Equity Off-shore Fund
Name Since Tenure Bhavesh Jain 9 Apr 18 8.23 Yr. Bharat Lahoti 1 Oct 21 4.75 Yr. Data below for Edelweiss Emerging Markets Opportunities Equity Off-shore Fund as on 30 Jun 26
Equity Sector Allocation
Sector Value Technology 35.88% Financial Services 20.6% Consumer Cyclical 10.01% Communication Services 7.79% Industrials 5.82% Energy 5.13% Basic Materials 2.8% Consumer Defensive 1.98% Utility 1.27% Health Care 0.52% Asset Allocation
Asset Class Value Cash 6.04% Equity 93.14% Debt 0.01% Other 0.49% Top Securities Holdings / Portfolio
Name Holding Value Quantity JPM Emerging Mkts Opps I acc USD
Investment Fund | -96% ₹241 Cr 102,137
↑ 3,897 Clearing Corporation Of India Ltd.
CBLO/Reverse Repo | -4% ₹10 Cr Net Receivables/(Payables)
CBLO | -0% -₹1 Cr Accrued Interest
CBLO | -0% ₹0 Cr 4. Kotak Global Emerging Market Fund
Kotak Global Emerging Market Fund
Growth Launch Date 26 Sep 07 NAV (24 Jul 26) ₹38.391 ↓ -0.93 (-2.36 %) Net Assets (Cr) ₹1,767 on 30 Jun 26 Category Equity - Global AMC Kotak Mahindra Asset Management Co Ltd Rating ☆☆☆ Risk High Expense Ratio 1.64 Sharpe Ratio 1.88 Information Ratio -0.25 Alpha Ratio -1.76 Min Investment 5,000 Min SIP Investment 1,000 Exit Load 0-1 Years (1%),1 Years and above(NIL) Growth of 10,000 investment over the years.
Date Value 30 Jun 21 ₹10,000 30 Jun 22 ₹7,904 30 Jun 23 ₹8,130 30 Jun 24 ₹9,267 30 Jun 25 ₹10,468 30 Jun 26 ₹16,878 Returns for Kotak Global Emerging Market Fund
absolute basis & more than 1 year are on CAGR (Compound Annual Growth Rate) basis. as on 24 Jul 26 Duration Returns 1 Month -5.6% 3 Month 3.1% 6 Month 13.5% 1 Year 45.8% 3 Year 24.1% 5 Year 10.7% 10 Year 15 Year Since launch 7.4% Historical performance (Yearly) on absolute basis
Year Returns 2025 39.1% 2024 5.9% 2023 10.8% 2022 -15% 2021 -0.5% 2020 29.1% 2019 21.4% 2018 -14.4% 2017 30.4% 2016 -1.2% Fund Manager information for Kotak Global Emerging Market Fund
Name Since Tenure Arjun Khanna 9 May 19 7.15 Yr. Data below for Kotak Global Emerging Market Fund as on 30 Jun 26
Equity Sector Allocation
Sector Value Technology 43.42% Financial Services 19.61% Industrials 8.58% Consumer Cyclical 8.12% Basic Materials 6.67% Communication Services 5.05% Energy 4.51% Health Care 0.71% Asset Allocation
Asset Class Value Cash 3.32% Equity 96.68% Top Securities Holdings / Portfolio
Name Holding Value Quantity CI Emerging Markets Class A
Investment Fund | -98% ₹1,762 Cr 4,589,366
↑ 100,988 Triparty Repo
CBLO/Reverse Repo | -2% ₹33 Cr Net Current Assets/(Liabilities)
Net Current Assets | -0% -₹2 Cr 5. DSP World Energy Fund
DSP World Energy Fund
Growth Launch Date 14 Aug 09 NAV (24 Jul 26) ₹28.8373 ↓ -0.25 (-0.86 %) Net Assets (Cr) ₹117 on 30 Jun 26 Category Equity - Global AMC DSP BlackRock Invmt Managers Pvt. Ltd. Rating ☆☆ Risk High Expense Ratio 1.18 Sharpe Ratio 2.76 Information Ratio 0 Alpha Ratio 0 Min Investment 1,000 Min SIP Investment 500 Exit Load 0-12 Months (1%),12 Months and above(NIL) Growth of 10,000 investment over the years.
Date Value 30 Jun 21 ₹10,000 30 Jun 22 ₹8,249 30 Jun 23 ₹10,979 30 Jun 24 ₹10,687 30 Jun 25 ₹11,189 30 Jun 26 ₹18,095 Returns for DSP World Energy Fund
absolute basis & more than 1 year are on CAGR (Compound Annual Growth Rate) basis. as on 24 Jul 26 Duration Returns 1 Month -3.6% 3 Month -1.9% 6 Month 13.8% 1 Year 43.1% 3 Year 15.9% 5 Year 12.8% 10 Year 15 Year Since launch 6.5% Historical performance (Yearly) on absolute basis
Year Returns 2025 39.2% 2024 -6.8% 2023 12.9% 2022 -8.6% 2021 29.5% 2020 0% 2019 18.2% 2018 -11.3% 2017 -1.9% 2016 22.5% Fund Manager information for DSP World Energy Fund
Name Since Tenure Kaivalya Nadkarni 1 May 25 1.17 Yr. Data below for DSP World Energy Fund as on 30 Jun 26
Equity Sector Allocation
Sector Value Industrials 36.73% Utility 22.76% Technology 22.09% Basic Materials 9.94% Consumer Cyclical 0.71% Asset Allocation
Asset Class Value Cash 7.75% Equity 92.23% Debt 0.02% Top Securities Holdings / Portfolio
Name Holding Value Quantity BGF Sustainable Energy I2
Investment Fund | -97% ₹118 Cr 404,670 Treps / Reverse Repo Investments
CBLO/Reverse Repo | -3% ₹4 Cr Net Receivables/Payables
Net Current Assets | -0% ₹0 Cr
একমুঠো পথ বা এসআইপি-এর মাধ্যমে বিনিয়োগ করার চূড়ান্ত পছন্দটি অনেক কারণের সমাপ্তি হবে, তবে, বিনিয়োগকারীকে এই সমস্ত এবং তার/তাদেরকে বিবেচনা করতে হবেঝুকিপুন্ন ক্ষুধা সেরা রুট নির্বাচন করতে. ভাল চয়ন করুন, বিজ্ঞতার সাথে চয়ন করুন, বিনিয়োগ থাকুন!
এখানে প্রদত্ত তথ্য সঠিক কিনা তা নিশ্চিত করার জন্য সমস্ত প্রচেষ্টা করা হয়েছে। যাইহোক, তথ্যের সঠিকতা সম্পর্কে কোন গ্যারান্টি দেওয়া হয় না। কোনো বিনিয়োগ করার আগে স্কিমের তথ্য নথির সাথে যাচাই করুন।


AMFI Registration No. 112358 | CIN: U74999MH2016PTC282153
Shepard Technologies Pvt. Ltd. (with ARN code 112358) makes no warranties or representations, express or implied, on products offered through the platform. It accepts no liability for any damages or losses, however caused, in connection with the use of, or on the reliance of its product or related services. Terms and conditions of the website are applicable.
©2026 Shepard Technologies Private Limited. All Rights Reserved
Research Highlights for DSP World Mining Fund