মিউচুয়াল ফান্ডে একক বিনিয়োগ
আপনি কি জানেন যে আপনি একটি একক পরিমাণ বিনিয়োগ করতে পারেনযৌথ পুঁজি? যদি হ্যাঁ, তাহলে ভালো। যাইহোক, যদি না হয়, তাহলে চিন্তা করবেন না। এই নিবন্ধটি একই মাধ্যমে আপনাকে গাইড করবে। মিউচুয়াল ফান্ডে একক বিনিয়োগ বলতে এমন একটি পরিস্থিতিকে বোঝায় যখন একজন ব্যক্তি মিউচুয়াল ফান্ডে একবারে অর্থ বিনিয়োগ করে। এখানে একাধিকবার জমা হয় না। এর মধ্যে অনেক পার্থক্য রয়েছেচুমুক এবং বিনিয়োগের একমুঠো মোড। সুতরাং, আসুন মিউচুয়াল ফান্ডে একক বিনিয়োগের ধারণাটি বুঝতে পারি,সেরা মিউচুয়াল ফান্ড একমুঠো বিনিয়োগের জন্য, একক বিনিয়োগের সময় যে বিষয়গুলি বিবেচনা করতে হবে, মিউচুয়াল ফান্ড একক ফেরত ক্যালকুলেটর এবং অন্যান্য সম্পর্কিত দিকগুলি এই নিবন্ধটির মাধ্যমে।

মিউচুয়াল ফান্ডে একক বিনিয়োগ বলতে আপনি কী বোঝেন?
মিউচুয়াল ফান্ডে একক বিনিয়োগ এমন একটি দৃশ্য যেখানে ব্যক্তিমিউচুয়াল ফান্ডে বিনিয়োগ করুন শুধুমাত্র একবারের জন্য। যাইহোক, বিনিয়োগের SIP মোডের বিপরীতে যেখানে ব্যক্তিরা একক পরিমাণে অল্প পরিমাণ জমা করে, ব্যক্তিরা যথেষ্ট পরিমাণে জমা করে। অন্য কথায়, এটি একটি এক-শট কৌশলবিনিয়োগ মিউচুয়াল ফান্ডে। বিনিয়োগকারীদের জন্য উপযুক্ত বিনিয়োগের একমুঠো মোড যাদের অতিরিক্ত তহবিল রয়েছে যা তাদের আদর্শে পড়ে আছেব্যাংক অ্যাকাউন্ট এবং আরও উপার্জনের জন্য চ্যানেল খুঁজছেনআয় মিউচুয়াল ফান্ডে বিনিয়োগ করে।
2022 - 2023-এ একক বিনিয়োগের জন্য সেরা মিউচুয়াল ফান্ড
আপনি একমুঠো মোডের মাধ্যমে মিউচুয়াল ফান্ডে বিনিয়োগ করার আগে, ব্যক্তিদের বিভিন্ন পরামিতি যেমন AUM, বিনিয়োগের পরিমাণ এবং আরও অনেক কিছু বিবেচনা করতে হবে। সুতরাং, এই পরামিতিগুলির উপর ভিত্তি করে একক বিনিয়োগের জন্য কিছু সেরা মিউচুয়াল ফান্ড নিম্নরূপ।
ইক্যুইটি মিউচুয়াল ফান্ডে সেরা একক বিনিয়োগ
ইক্যুইটি ফান্ড বিভিন্ন কোম্পানির ইক্যুইটি এবং ইক্যুইটি-সম্পর্কিত উপকরণগুলিতে তাদের কর্পাস বিনিয়োগ করে এমন স্কিমগুলি। এই স্কিমগুলি দীর্ঘমেয়াদী বিনিয়োগের জন্য একটি ভাল বিকল্প হিসাবে বিবেচিত হয়। যদিও ব্যক্তিরা ইক্যুইটি তহবিলে একক পরিমাণ বিনিয়োগ করতে পারে তবুও ইক্যুইটি তহবিলে বিনিয়োগের প্রস্তাবিত কৌশলটি হয় এসআইপি বাপদ্ধতিগত স্থানান্তর পরিকল্পনা (STP) মোড। STP মোডে, ব্যক্তিরা প্রথমে একটি উল্লেখযোগ্য অর্থ জমা করেঋণ তহবিল যেমনতরল তহবিল এবং তারপর ইক্যুইটি ফান্ডে নিয়মিত বিরতিতে টাকা স্থানান্তর করা হয়। বিনিয়োগের জন্য বিবেচনা করা যেতে পারে এমন কিছু ইক্যুইটি মিউচুয়াল ফান্ড নিম্নরূপ।
Fund NAV Net Assets (Cr) Min Investment 3 MO (%) 6 MO (%) 1 YR (%) 3 YR (%) 5 YR (%) 2024 (%) ICICI Prudential Infrastructure Fund Growth ₹204.89
↑ 0.58 ₹8,550 5,000 1.7 9.3 2.8 20.4 23.9 6.7 SBI PSU Fund Growth ₹34.5922
↓ -0.15 ₹6,684 5,000 -5.2 3.3 7.2 24.3 23.5 11.3 LIC MF Infrastructure Fund Growth ₹54.429
↑ 0.06 ₹1,137 5,000 5.5 18.9 7.2 25.5 23.1 -3.7 Nippon India Power and Infra Fund Growth ₹381.779
↑ 0.11 ₹8,043 5,000 2 17.9 9.3 21.4 22.3 -0.5 DSP India T.I.G.E.R Fund Growth ₹362.608
↑ 0.80 ₹6,264 1,000 6.4 21.3 13.6 23.3 22.3 -2.5 Note: Returns up to 1 year are on absolute basis & more than 1 year are on CAGR basis. as on 21 Jul 26 Research Highlights & Commentary of 5 Funds showcased
Commentary ICICI Prudential Infrastructure Fund SBI PSU Fund LIC MF Infrastructure Fund Nippon India Power and Infra Fund DSP India T.I.G.E.R Fund Point 1 Highest AUM (₹8,550 Cr). Lower mid AUM (₹6,684 Cr). Bottom quartile AUM (₹1,137 Cr). Upper mid AUM (₹8,043 Cr). Bottom quartile AUM (₹6,264 Cr). Point 2 Established history (20+ yrs). Established history (16+ yrs). Established history (18+ yrs). Oldest track record among peers (22 yrs). Established history (22+ yrs). Point 3 Rating: 3★ (lower mid). Rating: 2★ (bottom quartile). Not Rated. Top rated. Rating: 4★ (upper mid). Point 4 Risk profile: High. Risk profile: High. Risk profile: High. Risk profile: High. Risk profile: High. Point 5 5Y return: 23.88% (top quartile). 5Y return: 23.48% (upper mid). 5Y return: 23.07% (lower mid). 5Y return: 22.34% (bottom quartile). 5Y return: 22.32% (bottom quartile). Point 6 3Y return: 20.45% (bottom quartile). 3Y return: 24.33% (upper mid). 3Y return: 25.54% (top quartile). 3Y return: 21.37% (bottom quartile). 3Y return: 23.27% (lower mid). Point 7 1Y return: 2.82% (bottom quartile). 1Y return: 7.18% (bottom quartile). 1Y return: 7.20% (lower mid). 1Y return: 9.32% (upper mid). 1Y return: 13.59% (top quartile). Point 8 Alpha: 0.00 (lower mid). Alpha: -0.30 (bottom quartile). Alpha: 8.41 (upper mid). Alpha: 8.81 (top quartile). Alpha: 0.00 (bottom quartile). Point 9 Sharpe: -0.07 (bottom quartile). Sharpe: 0.12 (bottom quartile). Sharpe: 0.22 (lower mid). Sharpe: 0.24 (upper mid). Sharpe: 0.44 (top quartile). Point 10 Information ratio: 0.00 (lower mid). Information ratio: -0.11 (bottom quartile). Information ratio: 0.58 (top quartile). Information ratio: 0.56 (upper mid). Information ratio: 0.00 (bottom quartile). ICICI Prudential Infrastructure Fund
SBI PSU Fund
LIC MF Infrastructure Fund
Nippon India Power and Infra Fund
DSP India T.I.G.E.R Fund
Talk to our investment specialist
ডেট মিউচুয়াল ফান্ডে সেরা একমাস বিনিয়োগ
ঋণ তহবিল তাদের তহবিল টাকা বিভিন্ন বিনিয়োগনির্দিষ্ট আয় ট্রেজারি বিলের মত যন্ত্রপাতি, কর্পোরেটবন্ড, এবং আরো অনেক কিছু. এই স্কিমগুলিকে স্বল্প এবং মাঝারি মেয়াদের জন্য একটি ভাল বিকল্প হিসাবে বিবেচনা করা হয়। অনেক ব্যক্তি ডেট মিউচুয়াল ফান্ডে একক অর্থ বিনিয়োগ করতে পছন্দ করেন। কিছুসেরা ঋণ তহবিল যেগুলি একক বিনিয়োগের জন্য বেছে নেওয়া যেতে পারে নিম্নরূপ।
Fund NAV Net Assets (Cr) Min Investment 3 MO (%) 6 MO (%) 1 YR (%) 3 YR (%) 2024 (%) Debt Yield (YTM) Mod. Duration Eff. Maturity DSP Credit Risk Fund Growth ₹54.8512
↑ 0.02 ₹275 1,000 1.7 7.9 9.9 16 21 7.73% 2Y 1M 28D 2Y 10M 17D Aditya Birla Sun Life Credit Risk Fund Growth ₹25.1975
↑ 0.02 ₹1,461 1,000 2.2 4.7 11.8 12.1 13.4 7.98% 2Y 29D 2Y 9M 4D Franklin India Credit Risk Fund Growth ₹25.3348
↑ 0.04 ₹104 5,000 2.9 5 7.5 11 0% Aditya Birla Sun Life Medium Term Plan Growth ₹43.5649
↑ 0.03 ₹3,213 1,000 2.2 4 8.3 9.9 10.9 8.05% 3Y 1M 20D 4Y 7M 24D Franklin India Ultra Short Bond Fund - Super Institutional Plan Growth ₹34.9131
↑ 0.04 ₹297 10,000 1.3 5.9 13.7 8.8 0% 1Y 15D Note: Returns up to 1 year are on absolute basis & more than 1 year are on CAGR basis. as on 21 Jul 26 Research Highlights & Commentary of 5 Funds showcased
Commentary DSP Credit Risk Fund Aditya Birla Sun Life Credit Risk Fund Franklin India Credit Risk Fund Aditya Birla Sun Life Medium Term Plan Franklin India Ultra Short Bond Fund - Super Institutional Plan Point 1 Bottom quartile AUM (₹275 Cr). Upper mid AUM (₹1,461 Cr). Bottom quartile AUM (₹104 Cr). Highest AUM (₹3,213 Cr). Lower mid AUM (₹297 Cr). Point 2 Oldest track record among peers (23 yrs). Established history (11+ yrs). Established history (14+ yrs). Established history (17+ yrs). Established history (18+ yrs). Point 3 Top rated. Not Rated. Rating: 1★ (lower mid). Rating: 4★ (upper mid). Rating: 1★ (bottom quartile). Point 4 Risk profile: Moderate. Risk profile: Moderate. Risk profile: Moderate. Risk profile: Moderate. Risk profile: Moderate. Point 5 1Y return: 9.92% (lower mid). 1Y return: 11.75% (upper mid). 1Y return: 7.45% (bottom quartile). 1Y return: 8.35% (bottom quartile). 1Y return: 13.69% (top quartile). Point 6 1M return: 1.26% (top quartile). 1M return: 1.03% (upper mid). 1M return: 0.91% (bottom quartile). 1M return: 0.95% (lower mid). 1M return: 0.59% (bottom quartile). Point 7 Sharpe: 0.76 (bottom quartile). Sharpe: 1.95 (upper mid). Sharpe: 0.29 (bottom quartile). Sharpe: 1.29 (lower mid). Sharpe: 2.57 (top quartile). Point 8 Information ratio: 0.00 (top quartile). Information ratio: 0.00 (upper mid). Information ratio: 0.00 (lower mid). Information ratio: 0.00 (bottom quartile). Information ratio: 0.00 (bottom quartile). Point 9 Yield to maturity (debt): 7.73% (lower mid). Yield to maturity (debt): 7.98% (upper mid). Yield to maturity (debt): 0.00% (bottom quartile). Yield to maturity (debt): 8.05% (top quartile). Yield to maturity (debt): 0.00% (bottom quartile). Point 10 Modified duration: 2.16 yrs (bottom quartile). Modified duration: 2.08 yrs (lower mid). Modified duration: 0.00 yrs (top quartile). Modified duration: 3.14 yrs (bottom quartile). Modified duration: 0.00 yrs (upper mid). DSP Credit Risk Fund
Aditya Birla Sun Life Credit Risk Fund
Franklin India Credit Risk Fund
Aditya Birla Sun Life Medium Term Plan
Franklin India Ultra Short Bond Fund - Super Institutional Plan
একক বিনিয়োগের জন্য সেরা হাইব্রিড তহবিল
হাইব্রিড তহবিল নামেও পরিচিতব্যালেন্সড ফান্ড ইক্যুইটি এবং স্থির আয়ের উপকরণ উভয় ক্ষেত্রেই তাদের অর্থ বিনিয়োগ করুন। এই স্কিম খুঁজছেন ব্যক্তিদের জন্য উপযুক্তমূলধন নিয়মিত আয়ের পাশাপাশি প্রজন্ম। সুষম স্কিম হিসাবেও পরিচিত, ব্যক্তিরা হাইব্রিড স্কিমগুলিতে একক পরিমাণ বিনিয়োগ করতে বেছে নিতে পারেন। একক বিনিয়োগের জন্য কিছু সেরা হাইব্রিড তহবিল নীচে তালিকাভুক্ত করা হয়েছে।
Fund NAV Net Assets (Cr) Min Investment 3 MO (%) 6 MO (%) 1 YR (%) 3 YR (%) 5 YR (%) 2024 (%) BOI AXA Mid and Small Cap Equity and Debt Fund Growth ₹42.06
↑ 0.16 ₹1,695 5,000 5.1 14.7 8.2 18.2 14.2 -0.9 Sundaram Equity Hybrid Fund Growth ₹135.137
↑ 0.78 ₹1,954 5,000 0.5 10.5 27.1 16 14.2 SBI Multi Asset Allocation Fund Growth ₹66.9717
↑ 0.18 ₹19,354 5,000 1.1 0.8 11.2 15.6 13.4 18.6 UTI Multi Asset Fund Growth ₹78.6846
↑ 0.19 ₹6,890 5,000 0.1 -1.3 5.3 15.4 13.4 11.1 ICICI Prudential Multi-Asset Fund Growth ₹809.754
↓ -2.51 ₹84,991 5,000 -0.2 0 6.5 15.3 17.5 18.6 Note: Returns up to 1 year are on absolute basis & more than 1 year are on CAGR basis. as on 21 Jul 26 Research Highlights & Commentary of 5 Funds showcased
Commentary BOI AXA Mid and Small Cap Equity and Debt Fund Sundaram Equity Hybrid Fund SBI Multi Asset Allocation Fund UTI Multi Asset Fund ICICI Prudential Multi-Asset Fund Point 1 Bottom quartile AUM (₹1,695 Cr). Bottom quartile AUM (₹1,954 Cr). Upper mid AUM (₹19,354 Cr). Lower mid AUM (₹6,890 Cr). Highest AUM (₹84,991 Cr). Point 2 Established history (10+ yrs). Oldest track record among peers (26 yrs). Established history (20+ yrs). Established history (17+ yrs). Established history (23+ yrs). Point 3 Not Rated. Rating: 2★ (upper mid). Top rated. Rating: 1★ (bottom quartile). Rating: 2★ (lower mid). Point 4 Risk profile: Moderately High. Risk profile: Moderately High. Risk profile: Moderate. Risk profile: Moderately High. Risk profile: Moderately High. Point 5 5Y return: 14.18% (lower mid). 5Y return: 14.20% (upper mid). 5Y return: 13.40% (bottom quartile). 5Y return: 13.42% (bottom quartile). 5Y return: 17.46% (top quartile). Point 6 3Y return: 18.25% (top quartile). 3Y return: 16.03% (upper mid). 3Y return: 15.64% (lower mid). 3Y return: 15.35% (bottom quartile). 3Y return: 15.26% (bottom quartile). Point 7 1Y return: 8.21% (lower mid). 1Y return: 27.10% (top quartile). 1Y return: 11.18% (upper mid). 1Y return: 5.34% (bottom quartile). 1Y return: 6.54% (bottom quartile). Point 8 1M return: 0.29% (bottom quartile). 1M return: 1.80% (top quartile). 1M return: 1.08% (upper mid). 1M return: 0.61% (bottom quartile). 1M return: 0.73% (lower mid). Point 9 Alpha: 0.00 (upper mid). Alpha: 5.81 (top quartile). Alpha: 0.00 (lower mid). Alpha: 0.00 (bottom quartile). Alpha: 0.00 (bottom quartile). Point 10 Sharpe: 0.17 (lower mid). Sharpe: 2.64 (top quartile). Sharpe: 0.53 (upper mid). Sharpe: -0.11 (bottom quartile). Sharpe: 0.01 (bottom quartile). BOI AXA Mid and Small Cap Equity and Debt Fund
Sundaram Equity Hybrid Fund
SBI Multi Asset Allocation Fund
UTI Multi Asset Fund
ICICI Prudential Multi-Asset Fund
একক বিনিয়োগের জন্য সেরা সূচক তহবিল
একটি সূচক তহবিলের পোর্টফোলিওতে শেয়ার এবং অন্যান্য উপকরণগুলি সূচকের অনুপাতে থাকে। অন্য কথায়, এই স্কিমগুলি একটি সূচকের কর্মক্ষমতা অনুকরণ করে। এগুলি নিষ্ক্রিয়ভাবে পরিচালিত তহবিল এবং একমুঠো বিনিয়োগের জন্য একটি ভাল বিকল্প হিসাবে বিবেচিত হতে পারে। সেরা কিছুসূচক তহবিল যেগুলি একক বিনিয়োগের জন্য বেছে নেওয়া যেতে পারে নিম্নরূপ।
Fund NAV Net Assets (Cr) 3 MO (%) 6 MO (%) 1 YR (%) 3 YR (%) 5 YR (%) 2024 (%) Nippon India Index Fund - Sensex Plan Growth ₹39.6051
↓ -0.12 ₹918 -1.8 -5.1 -5.3 5.8 8.9 9.8 LIC MF Index Fund Sensex Growth ₹144.97
↓ -0.45 ₹90 -2 -5.2 -5.8 5.2 8.4 9.1 Franklin India Index Fund Nifty Plan Growth ₹195.993
↓ -0.41 ₹723 -1.1 -3.5 -3.1 7.7 9.7 11.3 IDBI Nifty Index Fund Growth ₹36.2111
↓ -0.02 ₹208 9.1 11.9 16.2 20.3 11.7 Nippon India Index Fund - Nifty Plan Growth ₹41.2677
↓ -0.09 ₹3,792 -1.1 -3.4 -3 7.7 9.6 11.4 Note: Returns up to 1 year are on absolute basis & more than 1 year are on CAGR basis. as on 21 Jul 26 Research Highlights & Commentary of 5 Funds showcased
Commentary Nippon India Index Fund - Sensex Plan LIC MF Index Fund Sensex Franklin India Index Fund Nifty Plan IDBI Nifty Index Fund Nippon India Index Fund - Nifty Plan Point 1 Upper mid AUM (₹918 Cr). Bottom quartile AUM (₹90 Cr). Lower mid AUM (₹723 Cr). Bottom quartile AUM (₹208 Cr). Highest AUM (₹3,792 Cr). Point 2 Established history (15+ yrs). Established history (23+ yrs). Oldest track record among peers (25 yrs). Established history (16+ yrs). Established history (15+ yrs). Point 3 Top rated. Rating: 1★ (upper mid). Rating: 1★ (lower mid). Rating: 1★ (bottom quartile). Rating: 1★ (bottom quartile). Point 4 Risk profile: Moderately High. Risk profile: Moderately High. Risk profile: Moderately High. Risk profile: Moderately High. Risk profile: Moderately High. Point 5 5Y return: 8.86% (bottom quartile). 5Y return: 8.36% (bottom quartile). 5Y return: 9.66% (upper mid). 5Y return: 11.74% (top quartile). 5Y return: 9.64% (lower mid). Point 6 3Y return: 5.79% (bottom quartile). 3Y return: 5.20% (bottom quartile). 3Y return: 7.66% (lower mid). 3Y return: 20.28% (top quartile). 3Y return: 7.69% (upper mid). Point 7 1Y return: -5.29% (bottom quartile). 1Y return: -5.78% (bottom quartile). 1Y return: -3.05% (lower mid). 1Y return: 16.16% (top quartile). 1Y return: -2.96% (upper mid). Point 8 1M return: 0.95% (upper mid). 1M return: 0.90% (lower mid). 1M return: 0.82% (bottom quartile). 1M return: 3.68% (top quartile). 1M return: 0.83% (bottom quartile). Point 9 Alpha: -0.53 (upper mid). Alpha: -1.14 (bottom quartile). Alpha: -0.58 (lower mid). Alpha: -1.03 (bottom quartile). Alpha: -0.46 (top quartile). Point 10 Sharpe: -0.78 (bottom quartile). Sharpe: -0.81 (bottom quartile). Sharpe: -0.65 (lower mid). Sharpe: 1.04 (top quartile). Sharpe: -0.65 (upper mid). Nippon India Index Fund - Sensex Plan
LIC MF Index Fund Sensex
Franklin India Index Fund Nifty Plan
IDBI Nifty Index Fund
Nippon India Index Fund - Nifty Plan
গত 1 মাসের উপর ভিত্তি করে সেরা মিউচুয়াল ফান্ড
(Erstwhile SBI Pharma Fund) To provide the investors maximum growth opportunity through equity
investments in stocks of growth oriented sectors of the economy. Below is the key information for SBI Healthcare Opportunities Fund Returns up to 1 year are on The investment objective of ICICI Prudential US Bluechip Equity Fund is to provide long term capital appreciation to investors by primarily investing in equity and equity related securities (including ADRs/GDRs issued by Indian and foreign companies) of companies listed on New York Stock Exchange and/or NASDAQ. However, there can be no assurance that the investment objective of the Scheme will be realized. Research Highlights for ICICI Prudential US Bluechip Equity Fund Below is the key information for ICICI Prudential US Bluechip Equity Fund Returns up to 1 year are on ICICI Prudential Global Stable Equity Fund (the Scheme) is an open-ended fund of funds scheme that seeks to provide adequate returns by investing in the units of one or more overseas mutual fund schemes, which have the mandate to invest globally. Currently the Scheme intends to invest in the units/shares of Nordea 1 – Global Stable Equity Fund – Unhedged (N1 – GSEF - U). The fund manager may also invest in one or more other overseas mutual fund schemes, with similar investment policy/fundamental attributes and risk profile and is in accordance with the investment strategy of the Scheme. The Scheme may also invest a certain portion of its corpus in domestic money market securities and/or money market/liquid schemes of domestic mutual funds including that of ICICI Prudential Mutual Fund, in order to meet liquidity requirements from time to time. Research Highlights for ICICI Prudential Global Stable Equity Fund Below is the key information for ICICI Prudential Global Stable Equity Fund Returns up to 1 year are on (Erstwhile UTI Pharma & Healthcare Fund) The Investment objective of the Scheme is capital appreciation through investments in equities and equity related instruments of the Pharma & Healthcare sectors. Research Highlights for UTI Healthcare Fund Below is the key information for UTI Healthcare Fund Returns up to 1 year are on The primary investment objective of the Scheme is to provide long term capital growth by investing predominantly in JPMorgan Funds – JF ASEAN Equity Fund, an equity fund which invests primarily in companies of countries which are members of the Association of South East Asian Nations (ASEAN). However, there can be no assurance that the investment objective of the Scheme will be realized. Research Highlights for Edelweiss ASEAN Equity Off-shore Fund Below is the key information for Edelweiss ASEAN Equity Off-shore Fund Returns up to 1 year are on 1. SBI Healthcare Opportunities Fund
SBI Healthcare Opportunities Fund
Growth Launch Date 31 Dec 04 NAV (20 Jul 26) ₹506.945 ↑ 4.89 (0.97 %) Net Assets (Cr) ₹4,998 on 30 Jun 26 Category Equity - Sectoral AMC SBI Funds Management Private Limited Rating ☆☆ Risk High Expense Ratio 1.97 Sharpe Ratio 0.59 Information Ratio -0.17 Alpha Ratio 2.23 Min Investment 5,000 Min SIP Investment 500 Exit Load 0-15 Days (0.5%),15 Days and above(NIL) Growth of 10,000 investment over the years.
Date Value 30 Jun 21 ₹10,000 30 Jun 22 ₹8,662 30 Jun 23 ₹11,165 30 Jun 24 ₹15,491 30 Jun 25 ₹18,739 30 Jun 26 ₹21,357 Returns for SBI Healthcare Opportunities Fund
absolute basis & more than 1 year are on CAGR (Compound Annual Growth Rate) basis. as on 20 Jul 26 Duration Returns 1 Month 6.4% 3 Month 17.9% 6 Month 25.6% 1 Year 15.2% 3 Year 23.3% 5 Year 16.7% 10 Year 15 Year Since launch 15.7% Historical performance (Yearly) on absolute basis
Year Returns 2024 -3.5% 2023 42.2% 2022 38.2% 2021 -6% 2020 20.1% 2019 65.8% 2018 -0.5% 2017 -9.9% 2016 2.1% 2015 -14% Fund Manager information for SBI Healthcare Opportunities Fund
Name Since Tenure Tanmaya Desai 1 Jun 11 15.09 Yr. Data below for SBI Healthcare Opportunities Fund as on 30 Jun 26
Equity Sector Allocation
Sector Value Health Care 88.67% Basic Materials 8.82% Asset Allocation
Asset Class Value Cash 2.45% Equity 97.49% Debt 0.06% Top Securities Holdings / Portfolio
Name Holding Value Quantity Sun Pharmaceuticals Industries Ltd (Healthcare)
Equity, Since 31 Dec 17 | SUNPHARMA11% ₹504 Cr 2,800,000 Divi's Laboratories Ltd (Healthcare)
Equity, Since 31 Mar 12 | DIVISLAB7% ₹300 Cr 450,000 Acutaas Chemicals Ltd (Basic Materials)
Equity, Since 30 Jun 24 | 5433496% ₹282 Cr 900,000 Apollo Hospitals Enterprise Ltd (Healthcare)
Equity, Since 31 Jan 26 | APOLLOHOSP5% ₹245 Cr 300,000 Max Healthcare Institute Ltd Ordinary Shares (Healthcare)
Equity, Since 31 Mar 21 | MAXHEALTH5% ₹217 Cr 2,250,000 Aurobindo Pharma Ltd (Healthcare)
Equity, Since 31 Mar 26 | AUROPHARMA4% ₹178 Cr 1,250,000
↑ 250,000 Aster DM Healthcare Ltd Ordinary Shares (Healthcare)
Equity, Since 31 Mar 24 | ASTERDM4% ₹175 Cr 2,400,000 Laurus Labs Ltd (Healthcare)
Equity, Since 31 Aug 23 | LAURUSLABS4% ₹163 Cr 1,200,000 Biocon Ltd (Healthcare)
Equity, Since 30 Nov 24 | BIOCON4% ₹161 Cr 3,750,000 Torrent Pharmaceuticals Ltd (Healthcare)
Equity, Since 30 Jun 21 | TORNTPHARM3% ₹159 Cr 360,000 2. ICICI Prudential US Bluechip Equity Fund
ICICI Prudential US Bluechip Equity Fund
Growth Launch Date 6 Jul 12 NAV (20 Jul 26) ₹77.05 ↑ 0.10 (0.13 %) Net Assets (Cr) ₹3,607 on 30 Jun 26 Category Equity - Global AMC ICICI Prudential Asset Management Company Limited Rating ☆☆☆☆ Risk High Expense Ratio 2.06 Sharpe Ratio 1.08 Information Ratio -1.75 Alpha Ratio -1.87 Min Investment 5,000 Min SIP Investment 100 Exit Load 0-3 Months (3%),3-12 Months (1%),12 Months and above(NIL) Growth of 10,000 investment over the years.
Date Value 30 Jun 21 ₹10,000 30 Jun 22 ₹8,919 30 Jun 23 ₹11,609 30 Jun 24 ₹12,737 30 Jun 25 ₹13,895 30 Jun 26 ₹16,289 Returns for ICICI Prudential US Bluechip Equity Fund
absolute basis & more than 1 year are on CAGR (Compound Annual Growth Rate) basis. as on 20 Jul 26 Duration Returns 1 Month 6.3% 3 Month 4.6% 6 Month 3.1% 1 Year 19.4% 3 Year 12.6% 5 Year 11.1% 10 Year 15 Year Since launch 15.7% Historical performance (Yearly) on absolute basis
Year Returns 2024 15.8% 2023 10.4% 2022 30.6% 2021 -7.1% 2020 22.5% 2019 18.6% 2018 34.3% 2017 5.2% 2016 14.1% 2015 11.6% Fund Manager information for ICICI Prudential US Bluechip Equity Fund
Name Since Tenure Ritesh Lunawat 13 Sep 24 1.8 Yr. Sharmila D'Silva 1 Jul 22 4 Yr. Nitya Mishra 4 Nov 24 1.65 Yr. Data below for ICICI Prudential US Bluechip Equity Fund as on 30 Jun 26
Equity Sector Allocation
Sector Value Technology 28.28% Consumer Defensive 16.84% Health Care 16.55% Industrials 14.5% Financial Services 8.99% Consumer Cyclical 6.89% Communication Services 2.83% Basic Materials 1.4% Real Estate 0.97% Asset Allocation
Asset Class Value Cash 2.76% Equity 97.24% Top Securities Holdings / Portfolio
Name Holding Value Quantity Microsoft Corp (Technology)
Equity, Since 30 Jun 16 | MSFT3% ₹98 Cr 22,897 Agilent Technologies Inc (Healthcare)
Equity, Since 30 Jun 23 | AG83% ₹98 Cr 75,728 Clorox Co (Consumer Defensive)
Equity, Since 30 Jun 25 | CXX3% ₹94 Cr 110,000
↑ 10,000 Kenvue Inc (Consumer Defensive)
Equity, Since 31 Mar 24 | J4D3% ₹94 Cr 568,560 Fortinet Inc (Technology)
Equity, Since 30 Sep 25 | FTNT2% ₹92 Cr 69,600
↓ -31,900 NXP Semiconductors NV (Technology)
Equity, Since 30 Sep 24 | 0EDE2% ₹91 Cr 29,750
↓ -14,650 The Estee Lauder Companies Inc Class A (Consumer Defensive)
Equity, Since 30 Jun 23 | EL2% ₹90 Cr 106,367 Danaher Corp (Healthcare)
Equity, Since 31 Dec 24 | DHRC2% ₹88 Cr 50,500
↑ 2,200 Salesforce Inc (Technology)
Equity, Since 31 Dec 18 | CRM2% ₹86 Cr 47,195
↓ -5,300 Mondelez International Inc Class A (Consumer Defensive)
Equity, Since 31 Dec 24 | MDLZ2% ₹84 Cr 144,400 3. ICICI Prudential Global Stable Equity Fund
ICICI Prudential Global Stable Equity Fund
Growth Launch Date 13 Sep 13 NAV (20 Jul 26) ₹33.08 ↓ -0.40 (-1.19 %) Net Assets (Cr) ₹87 on 30 Jun 26 Category Equity - Global AMC ICICI Prudential Asset Management Company Limited Rating ☆☆☆☆ Risk High Expense Ratio 1.51 Sharpe Ratio 0.94 Information Ratio 0 Alpha Ratio 0 Min Investment 5,000 Min SIP Investment 1,000 Exit Load 0-3 Months (3%),3-18 Months (1%),18 Months and above(NIL) Growth of 10,000 investment over the years.
Date Value 30 Jun 21 ₹10,000 30 Jun 22 ₹9,833 30 Jun 23 ₹11,271 30 Jun 24 ₹11,826 30 Jun 25 ₹13,584 30 Jun 26 ₹15,405 Returns for ICICI Prudential Global Stable Equity Fund
absolute basis & more than 1 year are on CAGR (Compound Annual Growth Rate) basis. as on 20 Jul 26 Duration Returns 1 Month 6.3% 3 Month 3.8% 6 Month 9.2% 1 Year 19.6% 3 Year 12% 5 Year 10% 10 Year 15 Year Since launch 9.8% Historical performance (Yearly) on absolute basis
Year Returns 2024 17.8% 2023 5.7% 2022 11.7% 2021 3.2% 2020 19.7% 2019 2.9% 2018 23% 2017 -0.9% 2016 7.2% 2015 7.3% Fund Manager information for ICICI Prudential Global Stable Equity Fund
Name Since Tenure Ritesh Lunawat 13 Sep 24 1.8 Yr. Sharmila D’mello 1 Apr 22 4.25 Yr. Masoomi Jhurmarvala 4 Nov 24 1.65 Yr. Data below for ICICI Prudential Global Stable Equity Fund as on 30 Jun 26
Equity Sector Allocation
Sector Value Health Care 23.67% Consumer Defensive 15.72% Communication Services 14.74% Technology 11.82% Industrials 11.6% Financial Services 6.89% Consumer Cyclical 6.73% Utility 4.73% Real Estate 0.85% Basic Materials 0.67% Asset Allocation
Asset Class Value Cash 1.19% Equity 98.81% Top Securities Holdings / Portfolio
Name Holding Value Quantity Nordea 1 - Global Stable Equity Z USD
Investment Fund | -100% ₹88 Cr 193,634
↓ -312 Treps
CBLO/Reverse Repo | -0% ₹0 Cr Net Current Assets
Net Current Assets | -0% ₹0 Cr 4. UTI Healthcare Fund
UTI Healthcare Fund
Growth Launch Date 28 Jun 99 NAV (21 Jul 26) ₹334.052 ↑ 0.47 (0.14 %) Net Assets (Cr) ₹1,308 on 30 Jun 26 Category Equity - Sectoral AMC UTI Asset Management Company Ltd Rating ☆ Risk High Expense Ratio 2.26 Sharpe Ratio 0.58 Information Ratio 0.2 Alpha Ratio 2.15 Min Investment 5,000 Min SIP Investment 500 Exit Load 0-1 Years (1%),1 Years and above(NIL) Growth of 10,000 investment over the years.
Date Value 30 Jun 21 ₹10,000 30 Jun 22 ₹8,478 30 Jun 23 ₹10,006 30 Jun 24 ₹14,264 30 Jun 25 ₹17,337 30 Jun 26 ₹19,764 Returns for UTI Healthcare Fund
absolute basis & more than 1 year are on CAGR (Compound Annual Growth Rate) basis. as on 20 Jul 26 Duration Returns 1 Month 5.4% 3 Month 17.3% 6 Month 24% 1 Year 13.4% 3 Year 25.1% 5 Year 14.6% 10 Year 15 Year Since launch 15% Historical performance (Yearly) on absolute basis
Year Returns 2024 -3.1% 2023 42.9% 2022 38.2% 2021 -12.3% 2020 19.1% 2019 67.4% 2018 1.2% 2017 -7.5% 2016 6.2% 2015 -9.7% Fund Manager information for UTI Healthcare Fund
Name Since Tenure Kamal Gada 2 May 22 4.17 Yr. Data below for UTI Healthcare Fund as on 30 Jun 26
Equity Sector Allocation
Sector Value Health Care 94.45% Asset Allocation
Asset Class Value Cash 5.55% Equity 94.45% Top Securities Holdings / Portfolio
Name Holding Value Quantity Sun Pharmaceuticals Industries Ltd (Healthcare)
Equity, Since 31 Oct 06 | SUNPHARMA9% ₹108 Cr 600,000 Divi's Laboratories Ltd (Healthcare)
Equity, Since 30 Sep 17 | DIVISLAB5% ₹59 Cr 88,814
↑ 28,076 Ajanta Pharma Ltd (Healthcare)
Equity, Since 31 Jul 17 | AJANTPHARM5% ₹57 Cr 195,295
↓ -41,216 Gland Pharma Ltd (Healthcare)
Equity, Since 30 Nov 20 | GLAND4% ₹48 Cr 215,251 Lupin Ltd (Healthcare)
Equity, Since 28 Feb 25 | LUPIN4% ₹46 Cr 203,834
↓ -6,166 Apollo Hospitals Enterprise Ltd (Healthcare)
Equity, Since 30 Apr 21 | APOLLOHOSP4% ₹43 Cr 53,000 Dr Reddy's Laboratories Ltd (Healthcare)
Equity, Since 28 Feb 18 | DRREDDY3% ₹38 Cr 290,000 Caplin Point Laboratories Ltd (Healthcare)
Equity, Since 31 Dec 23 | CAPLIPOINT3% ₹37 Cr 185,000
↑ 39,847 Alkem Laboratories Ltd (Healthcare)
Equity, Since 31 May 21 | ALKEM3% ₹37 Cr 68,000 Fortis Healthcare Ltd (Healthcare)
Equity, Since 31 Dec 20 | FORTIS3% ₹37 Cr 400,000 5. Edelweiss ASEAN Equity Off-shore Fund
Edelweiss ASEAN Equity Off-shore Fund
Growth Launch Date 1 Jul 11 NAV (20 Jul 26) ₹37.794 ↑ 0.21 (0.55 %) Net Assets (Cr) ₹150 on 30 Jun 26 Category Equity - Global AMC Edelweiss Asset Management Limited Rating ☆☆☆ Risk High Expense Ratio 1.42 Sharpe Ratio 1.64 Information Ratio 0 Alpha Ratio 0 Min Investment 5,000 Min SIP Investment 1,000 Exit Load 0-12 Months (1%),12 Months and above(NIL) Growth of 10,000 investment over the years.
Date Value 30 Jun 21 ₹10,000 30 Jun 22 ₹9,586 30 Jun 23 ₹10,517 30 Jun 24 ₹10,777 30 Jun 25 ₹12,684 30 Jun 26 ₹15,564 Returns for Edelweiss ASEAN Equity Off-shore Fund
absolute basis & more than 1 year are on CAGR (Compound Annual Growth Rate) basis. as on 20 Jul 26 Duration Returns 1 Month 5.3% 3 Month 8.5% 6 Month 12.5% 1 Year 25.7% 3 Year 14.9% 5 Year 11.2% 10 Year 15 Year Since launch 9.2% Historical performance (Yearly) on absolute basis
Year Returns 2024 17.6% 2023 14.5% 2022 -1.4% 2021 4.8% 2020 6.3% 2019 2.3% 2018 12% 2017 -2.1% 2016 21.9% 2015 9.6% Fund Manager information for Edelweiss ASEAN Equity Off-shore Fund
Name Since Tenure Bhavesh Jain 27 Sep 19 6.76 Yr. Bharat Lahoti 1 Oct 21 4.75 Yr. Data below for Edelweiss ASEAN Equity Off-shore Fund as on 30 Jun 26
Equity Sector Allocation
Sector Value Financial Services 39.62% Industrials 23.47% Communication Services 7.09% Consumer Cyclical 6.1% Technology 4.79% Basic Materials 4.7% Utility 2.99% Real Estate 2.95% Health Care 2.48% Consumer Defensive 1.38% Energy 0.82% Asset Allocation
Asset Class Value Cash 3.6% Equity 96.4% Other 0% Top Securities Holdings / Portfolio
Name Holding Value Quantity JPM ASEAN Equity I acc USD
Investment Fund | -98% ₹148 Cr 68,777 Clearing Corporation Of India Ltd.
CBLO/Reverse Repo | -2% ₹3 Cr Net Receivables/(Payables)
CBLO | -0% ₹0 Cr Accrued Interest
CBLO | -0% ₹0 Cr
একক বিনিয়োগের সময় যে বিষয়গুলি বিবেচনা করা উচিত৷
মিউচুয়াল ফান্ডে বিনিয়োগ করার আগে ব্যক্তিদের অনেক পরামিতি যত্ন নিতে হবে। এটা অন্তর্ভুক্ত:
বাজারের টাইমিং
যখন একক বিনিয়োগের কথা আসে, তখন ব্যক্তিদের সর্বদা সন্ধান করতে হবেবাজার বিশেষ করে ইক্যুইটি-ভিত্তিক তহবিলের ক্ষেত্রে সময়। একক বিনিয়োগ করার একটি ভাল সময় হল যখন বাজারগুলি কম থাকে এবং একটি সুযোগ থাকে যে তারা শীঘ্রই প্রশংসা করতে শুরু করবে। যাইহোক, যদি বাজারগুলি ইতিমধ্যেই শীর্ষে থাকে তবে একক বিনিয়োগ থেকে দূরে থাকাই ভাল।
বৈচিত্রতা
বৈচিত্র্যও একটি গুরুত্বপূর্ণ দিক যা এককভাবে বিনিয়োগ করার আগে বিবেচনা করা প্রয়োজন। একমুঠো বিনিয়োগের ক্ষেত্রে ব্যক্তিদের একাধিক উপায়ে ছড়িয়ে দিয়ে তাদের বিনিয়োগকে বহুমুখী করা উচিত। এটি নিশ্চিত করতে সাহায্য করবে যে তাদের সামগ্রিক পোর্টফোলিওটি ভাল পারফরম্যান্স করে এমনকি যদি কোনও স্কিম কাজ না করে।
আপনার উদ্দেশ্য অনুযায়ী আপনার বিনিয়োগ করুন
ব্যক্তিরা যে কোনো বিনিয়োগ করে একটি নির্দিষ্ট লক্ষ্য অর্জনের জন্য। অতএব, ব্যক্তিদের চেক করা উচিত যে স্কিমের পদ্ধতির সাথে সামঞ্জস্যপূর্ণ কিনাবিনিয়োগকারীএর উদ্দেশ্য। এখানে, ব্যক্তিদের বিভিন্ন পরামিতি যেমন দেখতে হবেসিএজিআর স্কিমে বিনিয়োগ করার আগে রিটার্ন, সম্পূর্ণ আয়, করের প্রভাব এবং আরও অনেক কিছু।
খালাস সঠিক সময়ে করা উচিত
ব্যক্তি তাদের করা উচিতমুক্তি একক বিনিয়োগ সঠিক সময়ে. যদিও এটি এখনও বিনিয়োগের উদ্দেশ্য অনুযায়ী হতে পারে; ব্যক্তিদের উচিত যে স্কিমটিতে তারা বিনিয়োগ করার পরিকল্পনা করছে তার একটি সময়মত পর্যালোচনা করা। যাইহোক, তাদের আরও দীর্ঘ সময়ের জন্য তাদের বিনিয়োগ রাখতে হবে যাতে তারা সর্বাধিক সুবিধা উপভোগ করতে পারে।
মিউচুয়াল ফান্ড লাম্প সাম রিটার্ন ক্যালকুলেটর
মিউচুয়াল ফান্ডের একমুঠো রিটার্ন ক্যালকুলেটর ব্যক্তিদের দেখাতে সাহায্য করে যে কীভাবে একজন ব্যক্তির একক বিনিয়োগ একটি নির্দিষ্ট সময়সীমার মধ্যে বৃদ্ধি পায়। একমুঠো ক্যালকুলেটরে ইনপুট করতে যে ডেটা প্রয়োজন তার মধ্যে রয়েছে বিনিয়োগের মেয়াদ, প্রাথমিক বিনিয়োগের পরিমাণ, দীর্ঘমেয়াদী প্রত্যাশিত বৃদ্ধির হার এবং আরও অনেক কিছু। মিউচুয়াল ফান্ডের একমুঠো রিটার্ন ক্যালকুলেটরের একটি চিত্র নিম্নরূপ।
চিত্রণ
একমুঠো বিনিয়োগ: INR 25,000
বিনিয়োগের মেয়াদ: 15 বছর
দীর্ঘমেয়াদী বৃদ্ধির হার (প্রায়): 15%
লাম্প সাম ক্যালকুলেটর অনুযায়ী প্রত্যাশিত রিটার্ন: INR 2,03,427
বিনিয়োগে নিট লাভ: INR 1,78,427
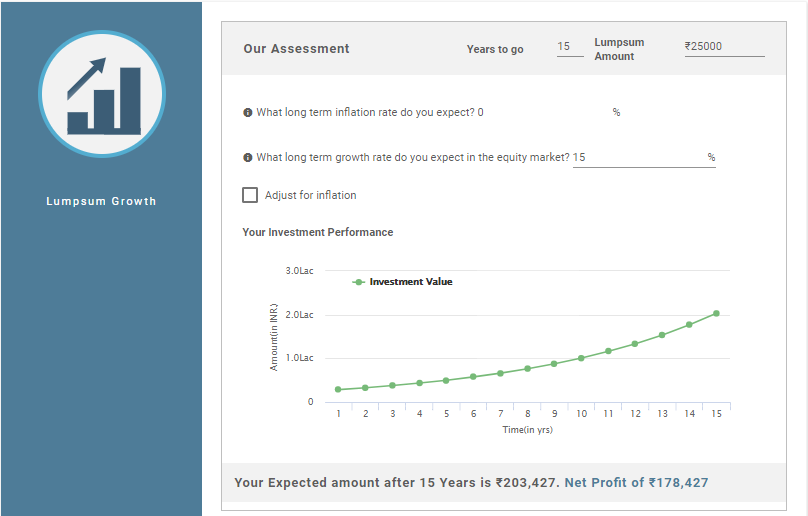
এইভাবে, উপরের গণনাটি দেখায় যে আপনার বিনিয়োগের উপর বিনিয়োগের নিট মুনাফা হল INR 1,78,427 যখন আপনার বিনিয়োগের মোট মূল্য হল INR 2,03,427.
মিউচুয়াল ফান্ডে এককালীন বিনিয়োগের সুবিধা এবং অসুবিধা
SIP-এর মতই, Lump Sum Investment-এরও নিজস্ব সুবিধা এবং অসুবিধা রয়েছে। সুতরাং, আসুন এই সুবিধা এবং অসুবিধাগুলি দেখুন।
সুবিধাদি
লাম্প সাম বিনিয়োগের সুবিধাগুলি নিম্নরূপ।
- বড় পরিমাণ বিনিয়োগ করুন: ব্যক্তিরা মিউচুয়াল ফান্ডে প্রচুর পরিমাণে বিনিয়োগ করতে পারে এবং তহবিল নিষ্ক্রিয় রাখার পরিবর্তে উচ্চতর রিটার্ন অর্জন করতে পারে।
- দীর্ঘমেয়াদী জন্য আদর্শ: বিনিয়োগের একক মোড দীর্ঘমেয়াদী বিনিয়োগের জন্য বিশেষত ইক্যুইটি তহবিলের ক্ষেত্রে ভাল। তবে, ঋণ তহবিলের ক্ষেত্রে, মেয়াদ স্বল্প বা মধ্যমেয়াদী হতে পারে
- সুবিধা: একক বিনিয়োগের মোড সুবিধাজনক কারণ অর্থপ্রদান শুধুমাত্র একবার করা হয় এবং নিয়মিত বিরতিতে কাটা হয় না।
অসুবিধা
একক বিনিয়োগের অসুবিধাগুলি হল:
- অনিয়মিত বিনিয়োগ: একমুঠো বিনিয়োগ একজন বিনিয়োগকারীর নিয়মিত সঞ্চয় নিশ্চিত করে না কারণ এটি নিয়মিত সঞ্চয়ের অভ্যাস তৈরি করে না।
- উচ্চ ঝুঁকি: একমুঠো বিনিয়োগে, সময়গুলি দেখা গুরুত্বপূর্ণ৷ এর কারণ একমুঠো মোডে বিনিয়োগ শুধুমাত্র একবার করা হয় এবং নিয়মিত বিরতিতে নয়। অতএব, যদি ব্যক্তিরা সময় বিবেচনা না করে, তাহলে তারা ক্ষতির সম্মুখীন হতে পারে।
উপসংহার
সুতরাং, উপরের পয়েন্টারগুলি থেকে, এটা বলা যেতে পারে যে একমুঠো মোডও মিউচুয়াল ফান্ডে বিনিয়োগ করার একটি ভাল উপায়। যাইহোক, স্কিমে একমুঠো পরিমাণ বিনিয়োগ করার সময় ব্যক্তিদের আত্মবিশ্বাসী হতে হবে। যদি না হয়, তারা বিনিয়োগের SIP মোড বেছে নিতে পারে। উপরন্তু, বিনিয়োগ করার আগে লোকেদের স্কিমের পদ্ধতিগুলি বোঝা উচিত। প্রয়োজন হলে, তারা এমনকি একটি পরামর্শ করতে পারেনআর্থিক উপদেষ্টা. এটি তাদের অর্থ নিরাপদ এবং তাদের উদ্দেশ্য যথাসময়ে সম্পন্ন হয়েছে তা নিশ্চিত করতে তাদের সাহায্য করবে.
এখানে প্রদত্ত তথ্য সঠিক কিনা তা নিশ্চিত করার জন্য সমস্ত প্রচেষ্টা করা হয়েছে। যাইহোক, তথ্যের সঠিকতা সম্পর্কে কোন গ্যারান্টি দেওয়া হয় না। কোনো বিনিয়োগ করার আগে স্কিমের তথ্য নথির সাথে যাচাই করুন।
You Might Also Like


AMFI Registration No. 112358 | CIN: U74999MH2016PTC282153
Shepard Technologies Pvt. Ltd. (with ARN code 112358) makes no warranties or representations, express or implied, on products offered through the platform. It accepts no liability for any damages or losses, however caused, in connection with the use of, or on the reliance of its product or related services. Terms and conditions of the website are applicable.
©2026 Shepard Technologies Private Limited. All Rights Reserved
Research Highlights for SBI Healthcare Opportunities Fund