एसआईपी बनाम एकमुश्त राशि
एसआईपी बनाम एकमुश्तनिवेश? ऐसे कई लेख हैं जो कहते हैं कि व्यवस्थित निवेश योजनाएं (या एसआईपी) लेने के लिए सबसे अच्छा मार्ग हैंम्यूचुअल फंड में निवेश. विभिन्नसिप कैलकुलेटर आपको उस लक्ष्य के लिए योजना बनाने में मदद करते हैं, कई वेबसाइट और वित्तीय योजनाकार भी इसकी वकालत करेंगेशीर्ष एसआईपी निवेश करने की योजना है। अधिकांश लोग रुपये की औसत लागत और एसआईपी के लाभों के बारे में बात करेंगे, यह बताते हुए कि स्टॉक में आनामंडी एकमुश्त निवेश के माध्यम से सबसे अच्छा तरीका नहीं हो सकता है। जबकि कोई एसआईपी के लिए सर्वश्रेष्ठ म्यूचुअल फंड में प्रवेश कर सकता है, क्या कोई एसआईपी को निवेश मोड के रूप में उपयोग करके एकमुश्त निवेश से बेहतर रिटर्न की उम्मीद कर सकता है?
SIP या एकमुश्त: समय के लिए निवेश करें न कि समय के लिए
निवेश हमेशा रिटर्न उत्पन्न करने की क्षमता के बारे में है। चाहे वह एकमुश्त निवेश हो या व्यवस्थितनिवेश योजना, किसी को विवेकपूर्ण होने और सही निर्णय लेने की आवश्यकता है। में निवेशम्यूचुअल फंड्स हमेशा चयन करने के बारे में नहीं हैसर्वश्रेष्ठ म्युचुअल फंड यासर्वश्रेष्ठ एसआईपी योजनाएं. और भी बहुत कुछ है जिस पर विचार करने की आवश्यकता है। खासकर अगर कोई इक्विटी मार्केट में निवेश करने की सोच रहा है तो उसे और भी सावधान रहने की जरूरत है। शेयर बाजार के विश्लेषण (बीएसई सेंसेक्स को बेंचमार्क के रूप में लेते हुए) से पता चलता है कि अगर कोई लंबी अवधि के लिए निवेशित रहता है तो रिटर्न बनाने की संभावना बढ़ जाती है। जैसा कि नीचे दी गई तालिका से देखा जा सकता है, यदि कोई केवल संख्याओं के आधार पर जाता है, तो 30% संभावना है कि यदि आप केवल 1 वर्ष के लिए शेयर बाजार में निवेश करने की योजना बनाते हैं तो आपको नुकसान हो सकता है।
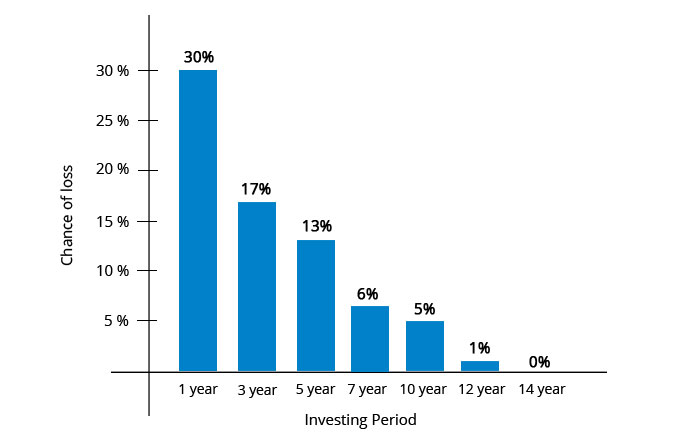
इसलिए अधिकांश सलाहकार जब इक्विटी निवेश के बारे में बात करते हैं तो वे हमेशा से संबंधित होते हैंइक्विटीज "दीर्घकालिक निवेश" के साथ। अगर कोई 5 साल तक निवेशित रहने की योजना बनाता है तो नुकसान होने की संभावना 13% तक कम हो जाती है। और अगर कोई वास्तव में दीर्घकालिक (10 वर्ष से अधिक) है, तो नुकसान करने की क्षमता शून्य हो जाती है। इसलिए, यदि कोई वास्तव में शेयर बाजार से पैसा बनाने में रुचि रखता है, तो यह सब शेयर बाजार में समय बिताने के बारे में है। (समय को चिह्नित करने के बजाय!)

एसआईपी या एकमुश्त: एक विश्लेषण
यह बिल्कुल स्पष्ट है कि इक्विटी बाजारों में निवेश एक लंबी अवधि का खेल है। बहुत से लोग इस बात की वकालत करते हैं कि एसआईपी के लाभ रुपये की लागत से लेकर अनुशासित निवेश तक फैले हुए हैं, लेकिन एक बड़ा सवाल यह है कि क्या एसआईपी एकमुश्त निवेश से बेहतर रिटर्न देते हैं?
हमने 1979 से (बीएसई सेंसेक्स की स्थापना के बाद से) इक्विटी बाजारों को देखकर इस प्रश्न को गहराई से समझने की कोशिश की। बीएसई सेंसेक्स भारत की शीर्ष 30 कंपनियों में से एक है और यह इक्विटी बाजार का प्रतिनिधित्व करता है। इस डेटा का विश्लेषण करते हुए, हमें यह देखने के लिए कुछ अंतर्दृष्टि मिल सकती है कि क्या एसआईपी या एकमुश्त, जो बेहतर है।
Talk to our investment specialist
शेयर बाजार का सबसे खराब दौर
निवेश शुरू करने की सबसे खराब अवधि सितंबर 1994 के आसपास थी (यह वह समय था जब शेयर बाजार चरम पर था)। वास्तव में, यदि कोई बाजार के आंकड़ों को देखता है तोइन्वेस्टर जिन्होंने एकमुश्त निवेश किया था, वे 59 महीने (लगभग 5 साल!) के लिए नकारात्मक रिटर्न पर बैठे रहे। जुलाई 1999 में भी निवेशक टूट गया। अगले साल हालांकि कुछ रिटर्न उत्पन्न हुए, लेकिन बाद में 2000 के शेयर बाजार में गिरावट के कारण ये रिटर्न अल्पकालिक थे। एक और 4 साल (नकारात्मक रिटर्न के साथ) भुगतने के बाद और निवेशक अंततः अक्टूबर 2003 में सकारात्मक हो गया। यह संभवतः एकमुश्त निवेश करने का सबसे खराब समय था।
एसआईपी निवेशक का क्या हुआ? व्यवस्थित निवेश योजना निवेशक केवल 19 महीनों के लिए नकारात्मक था और उसने मुनाफा कमाना शुरू कर दिया, हालांकि, ये अल्पकालिक थे। अंतरिम नुकसान झेलने के बाद मई 1999 तक एसआईपी निवेशक फिर से बढ़ गए। जबकि यात्रा अभी भी अस्थिर रही, एसआईपी निवेशकों ने पोर्टफोलियो में बहुत पहले मुनाफा दिखाया। एकमुश्त निवेशक के लिए अधिकतम नुकसान लगभग 40% था, जबकि एसआईपी निवेशक के लिए 23% था। व्यवस्थित निवेश योजना निवेशक के पास तेजी से वसूली की अवधि के साथ-साथ पोर्टफोलियो में कम नुकसान भी था।
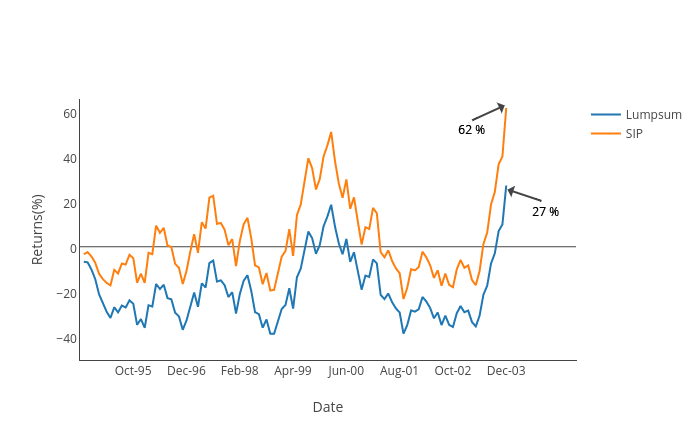
निवेश शुरू करने के लिए एक और बहुत ही निराशाजनक अवधि मार्च 2000 के आसपास थी (यह वह समय था जब शेयर बाजार फिर से चरम पर था!) वास्तव में, यदि कोई बाजार के आंकड़ों को देखता है, तो जिस निवेशक ने एकमुश्त निवेश किया था, वह सीधे 45 महीने (लगभग 4 साल!) के लिए नकारात्मक रिटर्न पर बैठा रहा। निवेशक ने लगभग दिसंबर 2003 में भी तोड़ दिया। अगले साल हालांकि कुछ रिटर्न उत्पन्न हुए, 2004 में फिर से एक पर्ची के कारण ये रिटर्न अल्पकालिक थे। एक और 1 साल के लिए पीड़ित होने के बाद, निवेशक अंततः सितंबर 2004 में सकारात्मक हो गया। यह एकमुश्त निवेश करने का एक और बुरा समय था।
मार्च 2000 में निवेश शुरू करने वाले SIP निवेशक की कहानी क्या थी? यदि कोई समान राशि का मासिक निवेश करता है, तो जून 2003 में निवेशक सकारात्मक था और सितंबर 2004 तक, पोर्टफोलियो कुल मिलाकर 45% ऊपर था। (जब एकमुश्त निवेशक ईवन तोड़ रहा था)। ध्यान देने योग्य एक अन्य पहलू अधिकतम नुकसान है, सितंबर 2001 तक एकमुश्त निवेशक को लगभग 50% नुकसान हुआ है, तुलनात्मक रूप से, एसआईपी पोर्टफोलियो का नुकसान एक ही समय में 28% था।
ऊपर से हम जो प्राप्त कर सकते हैं वह यह है कि जब शेयर बाजार खराब अवधि में होता है, तो एसआईपी में रहना हमेशा बेहतर होता है क्योंकि रिकवरी तेज होती है और पोर्टफोलियो में भी कम नुकसान होता है।
शेयर बाजार की सर्वश्रेष्ठ अवधि
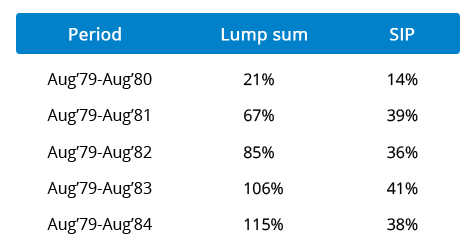
1979 से 2016 तक शेयर बाजार के पिछले 37 वर्षों के आंकड़ों को देखते हुए, एक समझ में आता है कि अगर किसी ने (1979 - बीएसई सेंसेक्स की स्थापना का समय) जल्दी निवेश किया, तो उसे पोर्टफोलियो में शायद ही कोई नकारात्मक रिटर्न मिला हो।
अगस्त 1979 से 5 साल के विश्लेषण से पता चलता है कि एकमुश्त और व्यवस्थित निवेश योजना पोर्टफोलियो दोनों ने वहां से किसी भी समय अवधि में शायद ही कोई नुकसान दर्ज किया हो। जैसा कि नीचे दिए गए ग्राफ से देखा जा सकता है, दोनों पोर्टफोलियो ने साल-दर-साल अच्छा मुनाफा कमाया। हर साल के अंत में एकमुश्त पोर्टफोलियो ने एसआईपी पोर्टफोलियो को पछाड़ दिया और लीड मार्जिन भी बढ़ा दिया।
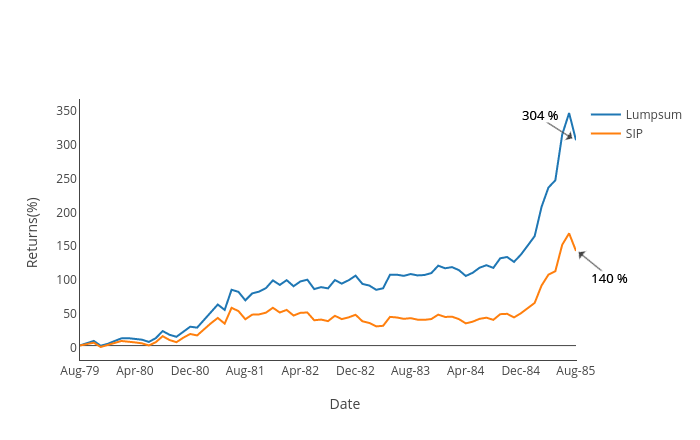
इसलिए, यदि बाजार में एक तरफ जाने की उम्मीद है, तो एकमुश्त हमेशा बेहतर विकल्प होता है।
कौन सा बेहतर निवेश मोड है?
जबकि हम शेयर बाजार की सभी अवधियों का विश्लेषण कर सकते हैं, क्या हम वास्तव में तय कर सकते हैं कि कौन सा बेहतर है? इसका उत्तर अलग-अलग व्यक्ति में भिन्न होता है,नकदी प्रवाह, निवेश (या होल्डिंग) अवधि, आउटगोइंग कैश फ्लो या आवश्यकताएं इत्यादि। बचत की आदत को विकसित करने के लिए एसआईपी एक महान उपकरण हैं, वे शेयर बाजार में व्यक्तियों के निवेश को चैनलाइज करते हैं। यदि आप इक्विटी में निवेश करने की योजना बना रहे हैं तो आपको लंबी अवधि के लिए निवेश करने की भी योजना बनानी होगी, जहां हम स्पष्ट रूप से जानते हैं कि समय के साथ रिटर्न उत्पन्न करने की क्षमता बढ़ जाती है। इसके अलावा, अगर किसी को लगता है कि बाजार में उतार-चढ़ाव हो सकता है और सीधी रेखा नहीं है, तो एसआईपी बाजार में प्रवेश करने का एक बेहतरीन साधन है। इसके अतिरिक्त, डेटा से पता चलता है कि एसआईपी यह भी सुनिश्चित करता है कि निवेशक को किसी भी समय कम नुकसान उठाना पड़े।
अगर ऐसा लगता है कि बाजार ऊपर की तरफ धर्मनिरपेक्ष (एक तरफ!)
भारत में सर्वश्रेष्ठ प्रदर्शन करने वाली एसआईपी योजनाएं 2022
The primary investment objective of the Scheme is to seek capital appreciation by investing predominantly in the units of BlackRock Global Funds – World Mining Fund. The Scheme may, at the discretion of the Investment Manager, also invest in the units of other similar overseas mutual fund schemes, which may
constitute a significant part of its corpus. The Scheme may also invest a certain portion of its corpus in money market securities and/or money market/liquid schemes of DSP BlackRock Mutual Fund, in order to meet liquidity requirements from time to time. Below is the key information for DSP World Mining Fund Returns up to 1 year are on "The primary investment objective of the Scheme is to seek capital appreciation by investing predominantly in units of MLIIF - WGF. The Scheme may, at the discretion of the Investment Manager, also invest in the units of other similar overseas mutual fund schemes, which may constitute a significant part of its corpus. The Scheme may also invest a certain portion of its corpus in money market securities and/or units of money market/liquid schemes of DSP Merrill Lynch Mutual Fund, in order to meet liquidity requirements from time to time. However, there is no assurance that the investment objective of the Scheme will be realized." Research Highlights for DSP World Gold Fund Below is the key information for DSP World Gold Fund Returns up to 1 year are on The primary investment objective of the Scheme is to seek to provide long term capital growth by investing predominantly in the JPMorgan Funds - Emerging Markets Opportunities Fund, an equity fund which invests primarily in an aggressively managed portfolio of emerging market companies Research Highlights for Edelweiss Emerging Markets Opportunities Equity Off-shore Fund Below is the key information for Edelweiss Emerging Markets Opportunities Equity Off-shore Fund Returns up to 1 year are on The primary investment objective of the Scheme is to seek capital appreciation by investing predominantly in the units of BlackRock Global Funds – World Energy Fund and BlackRock Global Funds – New Energy Fund. The Scheme may, at the discretion of the Investment Manager, also invest in the units of other similar overseas mutual fund schemes, which may constitute a significant part of its corpus. The Scheme may also invest a certain portion of its corpus in money market securities
and/or money market/liquid schemes of DSP BlackRock Mutual Fund, in order to meet liquidity
requirements from time to time. Research Highlights for DSP World Energy Fund Below is the key information for DSP World Energy Fund Returns up to 1 year are on The investment objective of the scheme is to provide long-term capital appreciation by investing in an overseas mutual fund scheme that invests in a diversified portfolio of securities as prescribed by SEBI from time to time in global emerging markets. Research Highlights for Kotak Global Emerging Market Fund Below is the key information for Kotak Global Emerging Market Fund Returns up to 1 year are on 1. DSP World Mining Fund
DSP World Mining Fund
Growth Launch Date 29 Dec 09 NAV (30 Jul 26) ₹30.7162 ↑ 0.88 (2.94 %) Net Assets (Cr) ₹164 on 30 Jun 26 Category Equity - Global AMC DSP BlackRock Invmt Managers Pvt. Ltd. Rating ☆☆☆ Risk High Expense Ratio 1.14 Sharpe Ratio 1.74 Information Ratio 0 Alpha Ratio 0 Min Investment 1,000 Min SIP Investment 500 Exit Load 0-12 Months (1%),12 Months and above(NIL) Growth of 10,000 investment over the years.
Date Value 31 Jul 21 ₹10,000 31 Jul 22 ₹8,812 31 Jul 23 ₹11,045 31 Jul 24 ₹10,685 31 Jul 25 ₹11,685 Returns for DSP World Mining Fund
absolute basis & more than 1 year are on CAGR (Compound Annual Growth Rate) basis. as on 30 Jul 26 Duration Returns 1 Month 3.6% 3 Month -3.7% 6 Month -3.6% 1 Year 69.4% 3 Year 23.2% 5 Year 15.1% 10 Year 15 Year Since launch 7% Historical performance (Yearly) on absolute basis
Year Returns 2025 79% 2024 -8.1% 2023 0% 2022 12.2% 2021 18% 2020 34.9% 2019 21.5% 2018 -9.4% 2017 21.1% 2016 49.7% Fund Manager information for DSP World Mining Fund
Name Since Tenure Kaivalya Nadkarni 1 May 25 1.17 Yr. Data below for DSP World Mining Fund as on 30 Jun 26
Equity Sector Allocation
Sector Value Basic Materials 93.17% Energy 1.11% Asset Allocation
Asset Class Value Cash 5.71% Equity 94.28% Debt 0.01% Top Securities Holdings / Portfolio
Name Holding Value Quantity BGF World Mining I2
Investment Fund | -96% ₹180 Cr 141,035 Treps / Reverse Repo Investments
CBLO/Reverse Repo | -4% ₹7 Cr Net Receivables/Payables
Net Current Assets | -0% ₹0 Cr 2. DSP World Gold Fund
DSP World Gold Fund
Growth Launch Date 14 Sep 07 NAV (30 Jul 26) ₹50.4247 ↑ 1.63 (3.33 %) Net Assets (Cr) ₹1,433 on 30 Jun 26 Category Equity - Global AMC DSP BlackRock Invmt Managers Pvt. Ltd. Rating ☆☆☆ Risk High Expense Ratio 1.41 Sharpe Ratio 1.22 Information Ratio -0.5 Alpha Ratio 2.12 Min Investment 1,000 Min SIP Investment 500 Exit Load 0-12 Months (1%),12 Months and above(NIL) Growth of 10,000 investment over the years.
Date Value 31 Jul 21 ₹10,000 31 Jul 22 ₹7,373 31 Jul 23 ₹9,366 31 Jul 24 ₹11,150 31 Jul 25 ₹16,504 Returns for DSP World Gold Fund
absolute basis & more than 1 year are on CAGR (Compound Annual Growth Rate) basis. as on 30 Jul 26 Duration Returns 1 Month 2.3% 3 Month -12.7% 6 Month -17.8% 1 Year 62.8% 3 Year 43.6% 5 Year 22.1% 10 Year 15 Year Since launch 8.9% Historical performance (Yearly) on absolute basis
Year Returns 2025 167.1% 2024 15.9% 2023 7% 2022 -7.7% 2021 -9% 2020 31.4% 2019 35.1% 2018 -10.7% 2017 -4% 2016 52.7% Fund Manager information for DSP World Gold Fund
Name Since Tenure Kaivalya Nadkarni 1 May 25 1.17 Yr. Data below for DSP World Gold Fund as on 30 Jun 26
Equity Sector Allocation
Sector Value Basic Materials 94.47% Asset Allocation
Asset Class Value Cash 3.62% Equity 94.47% Debt 0% Other 1.91% Top Securities Holdings / Portfolio
Name Holding Value Quantity BGF World Gold I2
Investment Fund | -68% ₹1,141 Cr 1,005,044 VanEck Gold Miners ETF
- | GDX29% ₹490 Cr 573,719 Treps / Reverse Repo Investments
CBLO/Reverse Repo | -3% ₹54 Cr Net Receivables/Payables
Net Current Assets | -0% -₹6 Cr 3. Edelweiss Emerging Markets Opportunities Equity Off-shore Fund
Edelweiss Emerging Markets Opportunities Equity Off-shore Fund
Growth Launch Date 7 Jul 14 NAV (30 Jul 26) ₹26.7341 ↑ 0.45 (1.70 %) Net Assets (Cr) ₹259 on 30 Jun 26 Category Equity - Global AMC Edelweiss Asset Management Limited Rating ☆☆☆ Risk High Expense Ratio 1.04 Sharpe Ratio 2.2 Information Ratio -0.41 Alpha Ratio 6.3 Min Investment 5,000 Min SIP Investment 1,000 Exit Load 0-1 Years (1%),1 Years and above(NIL) Growth of 10,000 investment over the years.
Date Value 31 Jul 21 ₹10,000 31 Jul 22 ₹7,821 31 Jul 23 ₹8,604 31 Jul 24 ₹9,029 31 Jul 25 ₹10,507 Returns for Edelweiss Emerging Markets Opportunities Equity Off-shore Fund
absolute basis & more than 1 year are on CAGR (Compound Annual Growth Rate) basis. as on 30 Jul 26 Duration Returns 1 Month -7.1% 3 Month 0.6% 6 Month 12% 1 Year 50.9% 3 Year 22.8% 5 Year 9.7% 10 Year 15 Year Since launch 8.5% Historical performance (Yearly) on absolute basis
Year Returns 2025 41.1% 2024 5.9% 2023 5.5% 2022 -16.8% 2021 -5.9% 2020 21.7% 2019 25.1% 2018 -7.2% 2017 30% 2016 9.8% Fund Manager information for Edelweiss Emerging Markets Opportunities Equity Off-shore Fund
Name Since Tenure Bhavesh Jain 9 Apr 18 8.23 Yr. Bharat Lahoti 1 Oct 21 4.75 Yr. Data below for Edelweiss Emerging Markets Opportunities Equity Off-shore Fund as on 30 Jun 26
Equity Sector Allocation
Sector Value Technology 35.88% Financial Services 20.6% Consumer Cyclical 10.01% Communication Services 7.79% Industrials 5.82% Energy 5.13% Basic Materials 2.8% Consumer Defensive 1.98% Utility 1.27% Health Care 0.52% Asset Allocation
Asset Class Value Cash 6.04% Equity 93.14% Debt 0.01% Other 0.49% Top Securities Holdings / Portfolio
Name Holding Value Quantity JPM Emerging Mkts Opps I acc USD
Investment Fund | -96% ₹241 Cr 102,137
↑ 3,897 Clearing Corporation Of India Ltd.
CBLO/Reverse Repo | -4% ₹10 Cr Net Receivables/(Payables)
CBLO | -0% -₹1 Cr Accrued Interest
CBLO | -0% ₹0 Cr 4. DSP World Energy Fund
DSP World Energy Fund
Growth Launch Date 14 Aug 09 NAV (30 Jul 26) ₹28.3086 ↑ 0.67 (2.42 %) Net Assets (Cr) ₹117 on 30 Jun 26 Category Equity - Global AMC DSP BlackRock Invmt Managers Pvt. Ltd. Rating ☆☆ Risk High Expense Ratio 1.18 Sharpe Ratio 2.76 Information Ratio 0 Alpha Ratio 0 Min Investment 1,000 Min SIP Investment 500 Exit Load 0-12 Months (1%),12 Months and above(NIL) Growth of 10,000 investment over the years.
Date Value 31 Jul 21 ₹10,000 31 Jul 22 ₹9,575 31 Jul 23 ₹11,538 31 Jul 24 ₹11,246 31 Jul 25 ₹12,513 Returns for DSP World Energy Fund
absolute basis & more than 1 year are on CAGR (Compound Annual Growth Rate) basis. as on 30 Jul 26 Duration Returns 1 Month -5.4% 3 Month -4.6% 6 Month 8.2% 1 Year 39.5% 3 Year 15.2% 5 Year 11.9% 10 Year 15 Year Since launch 6.3% Historical performance (Yearly) on absolute basis
Year Returns 2025 39.2% 2024 -6.8% 2023 12.9% 2022 -8.6% 2021 29.5% 2020 0% 2019 18.2% 2018 -11.3% 2017 -1.9% 2016 22.5% Fund Manager information for DSP World Energy Fund
Name Since Tenure Kaivalya Nadkarni 1 May 25 1.17 Yr. Data below for DSP World Energy Fund as on 30 Jun 26
Equity Sector Allocation
Sector Value Industrials 36.73% Utility 22.76% Technology 22.09% Basic Materials 9.94% Consumer Cyclical 0.71% Asset Allocation
Asset Class Value Cash 7.75% Equity 92.23% Debt 0.02% Top Securities Holdings / Portfolio
Name Holding Value Quantity BGF Sustainable Energy I2
Investment Fund | -97% ₹118 Cr 404,670 Treps / Reverse Repo Investments
CBLO/Reverse Repo | -3% ₹4 Cr Net Receivables/Payables
Net Current Assets | -0% ₹0 Cr 5. Kotak Global Emerging Market Fund
Kotak Global Emerging Market Fund
Growth Launch Date 26 Sep 07 NAV (30 Jul 26) ₹36.475 ↑ 0.10 (0.28 %) Net Assets (Cr) ₹1,767 on 30 Jun 26 Category Equity - Global AMC Kotak Mahindra Asset Management Co Ltd Rating ☆☆☆ Risk High Expense Ratio 1.64 Sharpe Ratio 1.88 Information Ratio -0.25 Alpha Ratio -1.76 Min Investment 5,000 Min SIP Investment 1,000 Exit Load 0-1 Years (1%),1 Years and above(NIL) Growth of 10,000 investment over the years.
Date Value 31 Jul 21 ₹10,000 31 Jul 22 ₹8,472 31 Jul 23 ₹9,265 31 Jul 24 ₹9,876 31 Jul 25 ₹11,685 Returns for Kotak Global Emerging Market Fund
absolute basis & more than 1 year are on CAGR (Compound Annual Growth Rate) basis. as on 30 Jul 26 Duration Returns 1 Month -10.7% 3 Month -3% 6 Month 6.2% 1 Year 38.8% 3 Year 20.6% 5 Year 10.2% 10 Year 15 Year Since launch 7.1% Historical performance (Yearly) on absolute basis
Year Returns 2025 39.1% 2024 5.9% 2023 10.8% 2022 -15% 2021 -0.5% 2020 29.1% 2019 21.4% 2018 -14.4% 2017 30.4% 2016 -1.2% Fund Manager information for Kotak Global Emerging Market Fund
Name Since Tenure Arjun Khanna 9 May 19 7.15 Yr. Data below for Kotak Global Emerging Market Fund as on 30 Jun 26
Equity Sector Allocation
Sector Value Technology 43.42% Financial Services 19.61% Industrials 8.58% Consumer Cyclical 8.12% Basic Materials 6.67% Communication Services 5.05% Energy 4.51% Health Care 0.71% Asset Allocation
Asset Class Value Cash 3.32% Equity 96.68% Top Securities Holdings / Portfolio
Name Holding Value Quantity CI Emerging Markets Class A
Investment Fund | -98% ₹1,762 Cr 4,589,366
↑ 100,988 Triparty Repo
CBLO/Reverse Repo | -2% ₹33 Cr Net Current Assets/(Liabilities)
Net Current Assets | -0% -₹2 Cr
एकमुश्त मार्ग या एसआईपी के माध्यम से निवेश करने का अंतिम विकल्प कई कारकों की परिणति होगी, हालांकि, निवेशक को इन सभी को ध्यान में रखना होगा और उसका/जोखिम उठाने का माद्दा सबसे अच्छा मार्ग चुनने के लिए। अच्छा चुनें, बुद्धिमानी से चुनें, निवेशित रहें!
यहां प्रदान की गई जानकारी सटीक है, यह सुनिश्चित करने के लिए सभी प्रयास किए गए हैं। हालांकि, डेटा की शुद्धता के संबंध में कोई गारंटी नहीं दी जाती है। कृपया कोई भी निवेश करने से पहले योजना सूचना दस्तावेज के साथ सत्यापित करें।


AMFI Registration No. 112358 | CIN: U74999MH2016PTC282153
Shepard Technologies Pvt. Ltd. (with ARN code 112358) makes no warranties or representations, express or implied, on products offered through the platform. It accepts no liability for any damages or losses, however caused, in connection with the use of, or on the reliance of its product or related services. Terms and conditions of the website are applicable.
©2026 Shepard Technologies Private Limited. All Rights Reserved
Research Highlights for DSP World Mining Fund