एसआईपी बनाम आरडी
कौन सा बेहतर निवेश विकल्प है?
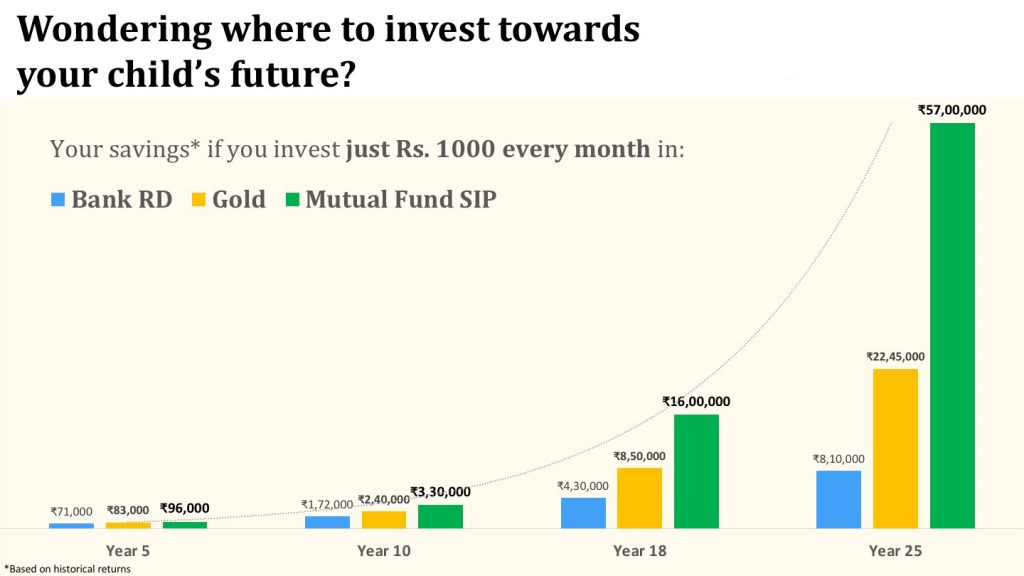
सिप बनाम आरडी?कहां निवेश करें बेहतर धन सृजन के लिए? धन उत्पन्न करने का एक अंतिम तरीका हर महीने पैसे की बचत करना है। आमतौर पर, एक व्यवस्थितनिवेश योजना (एसआईपी) और एक आरडी (आवर्ती जमा) भारत में दो सबसे कुशल निवेश विकल्प हैं:पैसे बचाएं हर महीने। SIP और RD दोनों ही निवेशकों को अच्छा रिटर्न अर्जित करने के लिए नियमित अंतराल में छोटी रकम का निवेश करने में सक्षम बनाते हैं। एक व्यवस्थित निवेश योजना (एसआईपी) के साथ, निवेशकों को कमाई करने के लिए मासिक या त्रैमासिक रूप से एक छोटी राशि का निवेश करना पड़ता है।मंडी-लिंक्ड रिटर्न। आरडी (आवर्ती जमा) के साथ,इन्वेस्टर निश्चित रिटर्न प्राप्त करने के लिए पूर्व-निर्धारित अवधि के लिए निश्चित राशि का निवेश करता है। अब, निवेशक a . का उपयोग करके आसानी से SIP रिटर्न की गणना कर सकते हैंघूंट कैलकुलेटर और RD an . का उपयोग करके रिटर्न करता हैआरडी कैलकुलेटर उनकी निवेश जरूरतों का अनुमान लगाने के लिए।
भारत में, कुछ सबसे सुविधाजनक आवधिक निवेश विकल्पों में एसआईपी, आरडी और शामिल हैंपीपीएफ (एसआईपी सबसे लोकप्रिय है)।
एसआईपी बनाम आरडी - उत्पाद संरचना
व्यवस्थित निवेश योजना (एसआईपी)
एक एसआईपी एक हैनिवेश में एक निश्चित राशि का निवेश करने का तरीकाम्यूचुअल फंड्स समय-समय पर। करने के लिए न्यूनतम राशिSIP में निवेश करें INR 500 जितना कम है। आमतौर पर, इक्विटी में SIP को अच्छा रिटर्न देने के लिए कहा जाता है क्योंकि वे बाजार से जुड़े होते हैं और बाजार के अनुरूप रिटर्न दे सकते हैं। विभिन्न स्रोतों के अनुसार, लंबी अवधि में एसआईपी रिटर्न 12% से 22% प्रति वर्ष तक हो सकता है, जो कि आरडी (आवर्ती जमा) द्वारा दी जाने वाली ब्याज दरों से काफी अधिक है। एसआईपी (सिस्टमैटिक इन्वेस्टमेंट प्लान) का एकमात्र नुकसान यह है कि एसआईपी रिटर्न अस्थिर होता है क्योंकि वे बाजार से जुड़े होते हैं, इसलिए जोखिमफ़ैक्टर बहुत अधिक है। हालांकि, जब लंबी अवधि के लिए निवेश किया जाता है, तो एसआईपी को अच्छा रिटर्न देने वाला माना जाता है।
आवर्ती जमा (आरडी)
आवर्ती जमा या आरडी एक निवेश योजना है जिसमें निवेशक को निवेश करने से पहले एक निवेश राशि और निवेश की अवधि का चयन करना होता है। आरडी के तहत, निवेशक को कुछ ब्याज और निवेश की गई राशि अर्जित करने के लिए चयनित अवधि में मासिक निवेश करना पड़ता है। आम तौर पर, RD की ब्याज दर 7% से 9% प्रति वर्ष के बीच होती है। और फलस्वरूप वरिष्ठ नागरिकों के लिए अधिक है। आरडी रिटर्न की दर सावधि जमा और एसआईपी से काफी कम है क्योंकि एक आरडी केवल पहली जमा राशि पर पूरे 12 महीनों का ब्याज अर्जित करता है। आरडी में दूसरी जमा पर 11 महीने के लिए ब्याज मिलता है, तीसरे जमा पर 10 महीने और इसी तरह। तो, आरडी में कोई कंपाउंडिंग लाभ नहीं हैं, इसके विपरीतएफडी और एसआईपी। आरडी रिटर्न निश्चित होते हैं और आरडी कैलकुलेटर का उपयोग करके आसानी से गणना की जा सकती है। आवर्ती जमा का प्रमुख नुकसान यह है कि यह कर कुशल नहीं है। टीडीएस (टैक्स डिडक्टेड एट सोर्स) ब्याज पर लागू होता हैआय आरडी से।
Talk to our investment specialist
टॉप 7 परफॉर्मिंग बैलेंस्ड फंड SIP
जैसाबैलेंस्ड फंड से कम जोखिम भरा हैइक्विटी म्यूचुअल फंड, बैलेंस्ड फंड समय की विस्तारित अवधि में स्थिर रिटर्न दे सकते हैं। नीचे दिए गए फंडों की सूची पिछले 3 वर्षों के वार्षिक रिटर्न पर आधारित है (सीएजीआर) और निवल संपत्ति से अधिक वाली निधियां500 करोड़ और फंड आयु> 3 वर्ष।
(Erstwhile BOI AXA Mid Cap Equity And Debt Fund) The scheme's objective is to provide capital appreciation and income distribution to investors from a portfolio constituting of mid cap equity and equity related securities as well as fixed income securities.However there can be no assurance that the investment objectives of the Scheme will be realized Below is the key information for BOI AXA Mid and Small Cap Equity and Debt Fund Returns up to 1 year are on (Erstwhile Sundaram Balanced Fund) The scheme seeks to generate capital appreciation and current income through a judicious mix of investments in equities and fixed income securities. Research Highlights for Sundaram Equity Hybrid Fund Below is the key information for Sundaram Equity Hybrid Fund Returns up to 1 year are on (Erstwhile SBI Magnum Monthly Income Plan Floater) To provide regular income, liquidity and attractive returns to investors in addition
to mitigating the impact of interest rate risk through an actively managed
portfolio of floating rate and fixed rate debt instruments, equity, money market
instruments and derivatives. Research Highlights for SBI Multi Asset Allocation Fund Below is the key information for SBI Multi Asset Allocation Fund Returns up to 1 year are on (Erstwhile ICICI Prudential Dynamic Plan) To generate capital appreciation by actively investing in equity and equity related securities. For defensive considerations, the Scheme may invest in debt, money market instruments and derivatives. The investment manager will have the discretion to take aggressive asset calls i.e. by staying 100% invested in equity market/equity related instruments at a given point of time and 0% at another, in which case, the fund may be invested in debt related instruments at its discretion. The AMC may choose to churn the portfolio of the Scheme in order to achieve the investment objective. The Scheme is suitable for investors seeking high returns and for those who are willing to take commensurate risks. Research Highlights for ICICI Prudential Multi-Asset Fund Below is the key information for ICICI Prudential Multi-Asset Fund Returns up to 1 year are on (Erstwhile UTI Wealth Builder Fund) The objective of the Scheme is to achieve long term capital appreciation by investing predominantly in a diversified portfolio of equity and equity related instruments along with investments in Gold ETFs and Debt and Money Market Instruments. However, there can be no assurance that the investment objective of the Scheme will be achieved. Research Highlights for UTI Multi Asset Fund Below is the key information for UTI Multi Asset Fund Returns up to 1 year are on (Erstwhile ICICI Prudential Balanced Fund) To generate long term capital appreciation and current income from a portfolio
that is invested in equity and equity related securities as well as in fixed income
securities. Research Highlights for ICICI Prudential Equity and Debt Fund Below is the key information for ICICI Prudential Equity and Debt Fund Returns up to 1 year are on (Erstwhile IDFC Balanced Fund) The Fund seeks to generate long term capital appreciation along with current income by investing in a mix of equity and equity related securities, debt securities and money market instruments. There is no assurance or guarantee that the objectives of the scheme will be realised. Research Highlights for Bandhan Hybrid Equity Fund Below is the key information for Bandhan Hybrid Equity Fund Returns up to 1 year are on 1. BOI AXA Mid and Small Cap Equity and Debt Fund
BOI AXA Mid and Small Cap Equity and Debt Fund
Growth Launch Date 20 Jul 16 NAV (22 Jul 26) ₹41.84 ↓ -0.22 (-0.52 %) Net Assets (Cr) ₹1,695 on 30 Jun 26 Category Hybrid - Hybrid Equity AMC BOI AXA Investment Mngrs Private Ltd Rating Risk Moderately High Expense Ratio 2.27 Sharpe Ratio 0.17 Information Ratio 0 Alpha Ratio 0 Min Investment 5,000 Min SIP Investment 1,000 Exit Load 0-1 Years (1%),1 Years and above(NIL) Growth of 10,000 investment over the years.
Date Value Returns for BOI AXA Mid and Small Cap Equity and Debt Fund
absolute basis & more than 1 year are on CAGR (Compound Annual Growth Rate) basis. as on 22 Jul 26 Duration Returns 1 Month -0.5% 3 Month 4% 6 Month 12.9% 1 Year 7.8% 3 Year 18% 5 Year 14% 10 Year 15 Year Since launch 15.4% Historical performance (Yearly) on absolute basis
Year Returns 2025 -0.9% 2024 25.8% 2023 33.7% 2022 -4.8% 2021 54.5% 2020 31.1% 2019 -4.7% 2018 -14.2% 2017 47.1% 2016 Fund Manager information for BOI AXA Mid and Small Cap Equity and Debt Fund
Name Since Tenure Data below for BOI AXA Mid and Small Cap Equity and Debt Fund as on 30 Jun 26
Asset Allocation
Asset Class Value Equity Sector Allocation
Sector Value Debt Sector Allocation
Sector Value Credit Quality
Rating Value Top Securities Holdings / Portfolio
Name Holding Value Quantity 2. Sundaram Equity Hybrid Fund
Sundaram Equity Hybrid Fund
Growth Launch Date 23 Jun 00 NAV (31 Dec 21) ₹135.137 ↑ 0.78 (0.58 %) Net Assets (Cr) ₹1,954 on 30 Nov 21 Category Hybrid - Hybrid Equity AMC Sundaram Asset Management Company Ltd Rating ☆☆ Risk Moderately High Expense Ratio 2.18 Sharpe Ratio 2.64 Information Ratio -0.12 Alpha Ratio 5.81 Min Investment 5,000 Min SIP Investment 100 Exit Load 0-12 Months (1%),12 Months and above(NIL) Growth of 10,000 investment over the years.
Date Value Returns for Sundaram Equity Hybrid Fund
absolute basis & more than 1 year are on CAGR (Compound Annual Growth Rate) basis. as on 22 Jul 26 Duration Returns 1 Month 1.8% 3 Month 0.5% 6 Month 10.5% 1 Year 27.1% 3 Year 16% 5 Year 14.2% 10 Year 15 Year Since launch 12.8% Historical performance (Yearly) on absolute basis
Year Returns 2025 2024 2023 2022 2021 2020 2019 2018 2017 2016 Fund Manager information for Sundaram Equity Hybrid Fund
Name Since Tenure Data below for Sundaram Equity Hybrid Fund as on 30 Nov 21
Asset Allocation
Asset Class Value Equity Sector Allocation
Sector Value Debt Sector Allocation
Sector Value Credit Quality
Rating Value Top Securities Holdings / Portfolio
Name Holding Value Quantity 3. SBI Multi Asset Allocation Fund
SBI Multi Asset Allocation Fund
Growth Launch Date 21 Dec 05 NAV (22 Jul 26) ₹66.5634 ↓ -0.41 (-0.61 %) Net Assets (Cr) ₹19,354 on 30 Jun 26 Category Hybrid - Multi Asset AMC SBI Funds Management Private Limited Rating ☆☆☆☆ Risk Moderate Expense Ratio 1.46 Sharpe Ratio 0.53 Information Ratio 0 Alpha Ratio 0 Min Investment 5,000 Min SIP Investment 500 Exit Load 0-12 Months (1%),12 Months and above(NIL) Growth of 10,000 investment over the years.
Date Value Returns for SBI Multi Asset Allocation Fund
absolute basis & more than 1 year are on CAGR (Compound Annual Growth Rate) basis. as on 22 Jul 26 Duration Returns 1 Month -0.1% 3 Month 0.7% 6 Month 0.7% 1 Year 10.6% 3 Year 15.4% 5 Year 13.1% 10 Year 15 Year Since launch 9.6% Historical performance (Yearly) on absolute basis
Year Returns 2025 18.6% 2024 12.8% 2023 24.4% 2022 6% 2021 13% 2020 14.2% 2019 10.6% 2018 0.4% 2017 10.9% 2016 8.7% Fund Manager information for SBI Multi Asset Allocation Fund
Name Since Tenure Data below for SBI Multi Asset Allocation Fund as on 30 Jun 26
Asset Allocation
Asset Class Value Equity Sector Allocation
Sector Value Debt Sector Allocation
Sector Value Credit Quality
Rating Value Top Securities Holdings / Portfolio
Name Holding Value Quantity 4. ICICI Prudential Multi-Asset Fund
ICICI Prudential Multi-Asset Fund
Growth Launch Date 31 Oct 02 NAV (21 Jul 26) ₹810.593 ↑ 0.84 (0.10 %) Net Assets (Cr) ₹84,991 on 30 Jun 26 Category Hybrid - Multi Asset AMC ICICI Prudential Asset Management Company Limited Rating ☆☆ Risk Moderately High Expense Ratio 1.47 Sharpe Ratio 0.01 Information Ratio 0 Alpha Ratio 0 Min Investment 5,000 Min SIP Investment 100 Exit Load 0-1 Years (1%),1 Years and above(NIL) Growth of 10,000 investment over the years.
Date Value Returns for ICICI Prudential Multi-Asset Fund
absolute basis & more than 1 year are on CAGR (Compound Annual Growth Rate) basis. as on 22 Jul 26 Duration Returns 1 Month 0.7% 3 Month -0.2% 6 Month 0% 1 Year 6.5% 3 Year 15.3% 5 Year 17.5% 10 Year 15 Year Since launch 20.4% Historical performance (Yearly) on absolute basis
Year Returns 2025 18.6% 2024 16.1% 2023 24.1% 2022 16.8% 2021 34.7% 2020 9.9% 2019 7.7% 2018 -2.2% 2017 28.2% 2016 12.5% Fund Manager information for ICICI Prudential Multi-Asset Fund
Name Since Tenure Data below for ICICI Prudential Multi-Asset Fund as on 30 Jun 26
Asset Allocation
Asset Class Value Equity Sector Allocation
Sector Value Debt Sector Allocation
Sector Value Credit Quality
Rating Value Top Securities Holdings / Portfolio
Name Holding Value Quantity 5. UTI Multi Asset Fund
UTI Multi Asset Fund
Growth Launch Date 21 Oct 08 NAV (22 Jul 26) ₹78.4242 ↓ -0.26 (-0.33 %) Net Assets (Cr) ₹6,890 on 30 Jun 26 Category Hybrid - Multi Asset AMC UTI Asset Management Company Ltd Rating ☆ Risk Moderately High Expense Ratio 1.79 Sharpe Ratio -0.11 Information Ratio 0 Alpha Ratio 0 Min Investment 5,000 Min SIP Investment 500 Exit Load 0-12 Months (1%),12 Months and above(NIL) Growth of 10,000 investment over the years.
Date Value Returns for UTI Multi Asset Fund
absolute basis & more than 1 year are on CAGR (Compound Annual Growth Rate) basis. as on 22 Jul 26 Duration Returns 1 Month 0% 3 Month 0.4% 6 Month -1.2% 1 Year 5% 3 Year 15.2% 5 Year 13.2% 10 Year 15 Year Since launch 12.3% Historical performance (Yearly) on absolute basis
Year Returns 2025 11.1% 2024 20.7% 2023 29.1% 2022 4.4% 2021 11.8% 2020 13.1% 2019 3.9% 2018 -0.5% 2017 17.1% 2016 7.3% Fund Manager information for UTI Multi Asset Fund
Name Since Tenure Data below for UTI Multi Asset Fund as on 30 Jun 26
Asset Allocation
Asset Class Value Equity Sector Allocation
Sector Value Debt Sector Allocation
Sector Value Credit Quality
Rating Value Top Securities Holdings / Portfolio
Name Holding Value Quantity 6. ICICI Prudential Equity and Debt Fund
ICICI Prudential Equity and Debt Fund
Growth Launch Date 3 Nov 99 NAV (22 Jul 26) ₹404.56 ↓ -2.66 (-0.65 %) Net Assets (Cr) ₹51,481 on 30 Jun 26 Category Hybrid - Hybrid Equity AMC ICICI Prudential Asset Management Company Limited Rating ☆☆☆☆ Risk Moderately High Expense Ratio 1.6 Sharpe Ratio -0.22 Information Ratio 1.74 Alpha Ratio 2.04 Min Investment 5,000 Min SIP Investment 100 Exit Load 0-1 Years (1%),1 Years and above(NIL) Growth of 10,000 investment over the years.
Date Value Returns for ICICI Prudential Equity and Debt Fund
absolute basis & more than 1 year are on CAGR (Compound Annual Growth Rate) basis. as on 22 Jul 26 Duration Returns 1 Month 0% 3 Month -0.2% 6 Month 0.8% 1 Year 3.2% 3 Year 14.8% 5 Year 16.4% 10 Year 15 Year Since launch 14.9% Historical performance (Yearly) on absolute basis
Year Returns 2025 13.3% 2024 17.2% 2023 28.2% 2022 11.7% 2021 41.7% 2020 9% 2019 9.3% 2018 -1.9% 2017 24.8% 2016 13.7% Fund Manager information for ICICI Prudential Equity and Debt Fund
Name Since Tenure Data below for ICICI Prudential Equity and Debt Fund as on 30 Jun 26
Asset Allocation
Asset Class Value Equity Sector Allocation
Sector Value Debt Sector Allocation
Sector Value Credit Quality
Rating Value Top Securities Holdings / Portfolio
Name Holding Value Quantity 7. Bandhan Hybrid Equity Fund
Bandhan Hybrid Equity Fund
Growth Launch Date 30 Dec 16 NAV (22 Jul 26) ₹27.488 ↓ -0.17 (-0.61 %) Net Assets (Cr) ₹2,184 on 30 Jun 26 Category Hybrid - Hybrid Equity AMC IDFC Asset Management Company Limited Rating Risk Moderately High Expense Ratio 2.35 Sharpe Ratio 0.05 Information Ratio 0.71 Alpha Ratio 5.97 Min Investment 5,000 Min SIP Investment 100 Exit Load 0-1 Years (1%),1 Years and above(NIL) Growth of 10,000 investment over the years.
Date Value Returns for Bandhan Hybrid Equity Fund
absolute basis & more than 1 year are on CAGR (Compound Annual Growth Rate) basis. as on 22 Jul 26 Duration Returns 1 Month 0.3% 3 Month 2.6% 6 Month 4.5% 1 Year 5.4% 3 Year 13.5% 5 Year 11.4% 10 Year 15 Year Since launch 11.2% Historical performance (Yearly) on absolute basis
Year Returns 2025 7.7% 2024 21% 2023 20.4% 2022 -1.1% 2021 30.8% 2020 13.9% 2019 4.7% 2018 -3.8% 2017 16.2% 2016 Fund Manager information for Bandhan Hybrid Equity Fund
Name Since Tenure Data below for Bandhan Hybrid Equity Fund as on 30 Jun 26
Asset Allocation
Asset Class Value Equity Sector Allocation
Sector Value Debt Sector Allocation
Sector Value Credit Quality
Rating Value Top Securities Holdings / Portfolio
Name Holding Value Quantity
SIP बनाम RD: कौन सा बेहतर है RD या SIP?
आवर्ती जमा और एसआईपी के बीच अंतर
यहां उपयोग किए जाने वाले कारक वापसी की दर हैं,लिक्विडिटी, कराधान, अस्थिरता, जोखिम कारक, आदि।
| कारकों | आवर्ती जमा (आरडी) | व्यवस्थित निवेश योजना (एसआईपी) |
|---|---|---|
| प्रतिफल दर | एसआईपी रिटर्न बाजार से जुड़े होते हैं और फंड के प्रकार और फंड के प्रदर्शन के आधार पर भिन्न हो सकते हैं। हालांकि, लंबी अवधि के लिए निवेश करने पर एसआईपी का रिटर्न आमतौर पर अच्छा होता है। | RD की वापसी दर इसके कारण तय होती हैनिश्चित ब्याज दर. इसलिए, इस निवेश पर बाजार की अस्थिरता का कोई प्रभाव नहीं पड़ता है। |
| निवेश योजना | आरडी योजना में, आपको एक जमा योजना में निवेश करना होगा जो आपको रिटर्न की निश्चित दर देगी। यदि आप अधिक लचीलेपन की तलाश में हैं तो आप लचीली आवर्ती जमा योजना का विकल्प भी चुन सकते हैं। | म्यूचुअल फंड के लिए एसआईपी में, आप अपनी जोखिम क्षमता के आधार पर डेट या इक्विटी प्रकार के फंड के बीच चयन कर सकते हैं। |
| निवेश प्रकार | आवर्ती जमा योजना में, निवेशक को हर महीने एक निश्चित राशि जमा करनी होती है। | सिस्टमैटिक इन्वेस्टमेंट प्लान म्यूचुअल फंड में अपना पैसा लगाने का एक तरीका है। समय-समय पर निवेश किया जा सकता हैआधार - दैनिक, साप्ताहिक, मासिक या त्रैमासिक। |
| लिक्विडिटी | प्रतिरद्द करें एसआईपी, निवेशक आसानी से अपना निवेश बंद कर सकते हैं और बिना किसी दंड शुल्क के अपना पैसा निकाल सकते हैं। | आरडी के मामले में, समय से पहले निकासी या निवेश को बंद करने पर जुर्माना शुल्क लगेगा। |
| कर लगाना | आवर्ती जमा राशि या उस पर अर्जित ब्याज कर से मुक्त नहीं है। | इक्विटी लिंक्ड सेविंग्स स्कीम में निवेश करने पर ही एसआईपी निवेश और रिटर्न टैक्स से मुक्त होते हैं (ईएलएसएस) फंड। |
| अस्थिरता | बाजार से जुड़े होने के कारण, एसआईपी रिटर्न अस्थिर होता है और फंड से फंड में भिन्न हो सकता है। | आरडी रिटर्न निश्चित होते हैं और इस प्रकार यह एक अस्थिर निवेश नहीं है। |
| जोखिम कारक | आरडी निवेश में जोखिम कारक लगभग शून्य है क्योंकि रिटर्न निश्चित है। यह सबसे सुरक्षित निवेशों में से एक है। | एसआईपी में जोखिम आरडी की तुलना में अधिक होता है, क्योंकि एसआईपी रिटर्न शेयर बाजार पर निर्भर करता है औरपरिसंपत्ति आवंटन. |
| निवेश लक्ष्य | आवर्ती जमा आमतौर पर अल्पकालिक बचत लक्ष्य की पूर्ति करते हैं और लंबी अवधि के धन वृद्धि में मदद नहीं करते हैं। | एसआईपी निवेश की आवृत्ति, चुने गए फंड और अन्य कारकों के आधार पर सभी प्रकार के निवेश लक्ष्यों में मदद कर सकता है, चाहे वह छोटा हो या दीर्घकालिक। |
| किस्त आवृत्ति | आवर्ती जमा आमतौर पर मासिक किश्तों के साथ आता है | SIP दैनिक, साप्ताहिक, मासिक, त्रैमासिक आदि की लचीली किस्त योजनाएँ प्रदान करते हैं। |
मूल्यांकन: एसआईपी बनाम आरडी . का रिटर्न
कौन सा बेहतर निवेश विकल्प है- एसआईपी बनाम आरडी? इस प्रश्न का उत्तर प्रत्येक व्यक्ति की व्यक्तिगत आवश्यकताओं के आधार पर भिन्न हो सकता है। जैसा कि आप जानते हैं, एसआईपी रिटर्न परिवर्तनशील होते हैं जबकि आरडी रिटर्न निश्चित होते हैं, आइए देखें कि अगर कोई 1 रुपये का निवेश करता है तो निवेश कितना बढ़ता है।000 1 साल (12 महीने) के लिए RD और SIP दोनों में।
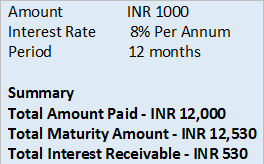
आरडी रिटर्न कैलकुलेटर
RD ब्याज दर हर पर भिन्न हो सकती हैबैंक, लेकिन आम तौर पर, ब्याज दर 7% से 9% प्रति वर्ष के बीच होती है। ब्याज दर को 8% मानते हुए, आइए 12 महीनों के लिए मासिक 1,000 रुपये के आरडी निवेश में वृद्धि का विश्लेषण करें।
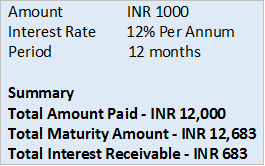
एसआईपी रिटर्न कैलकुलेटर
SIP की ब्याज दर को 12% मानते हुए, आइए देखें कि आपका SIP कैसे बढ़ता है यदि आप 1 वर्ष के लिए मासिक रूप से INR 1000 का निवेश करते हैं।कंपाउंडिंग की शक्ति.
अंत में, निवेशकों के लिए यहां कुछ अंतिम सुझाव दिए गए हैं।
- यदि आप जोखिम से बचने वाले निवेशक हैं, तो RD या आवर्ती जमा एक बेहतर विकल्प है। आरडी ब्याज दर और रिटर्न पहले से सीमित हैं और आमतौर पर बहुत अधिक नहीं होते हैं, 7-9% प्रति वर्ष से भिन्न हो सकते हैं।
- अगर आप थोड़ा जोखिम लेना चाहते हैं, तो लंबी अवधि के निवेश के लिए SIP सबसे अच्छे निवेश विकल्पों में से एक है। विश्लेषण के अनुसार, एसआईपी अच्छे रिटर्न की पेशकश करते हैं और ब्याज दरें आमतौर पर 15% प्रति वर्ष से अधिक होती हैं। कुछ मामलों में।
- 5 साल के लिए निवेश करते समय आरडी उन निवेशकों के लिए एक सुरक्षित विकल्प है जो निश्चित रिटर्न की तलाश में हैं।
- हालांकि, एक निश्चित अवधि के लिए लंबी अवधि (5 वर्ष से अधिक) के लिए निवेश करते समयवित्तीय लक्ष्य, SIP अच्छा रिटर्न प्रदान करता है और धन की वृद्धि बहुत अधिक होती है।
"एसआईपी के माध्यम से इक्विटी में निवेश करना एक पेड़ लगाने जैसा है, फल प्राप्त करने के लिए धैर्य रखना होगा।"
यहां प्रदान की गई जानकारी सटीक है, यह सुनिश्चित करने के लिए सभी प्रयास किए गए हैं। हालांकि, डेटा की शुद्धता के संबंध में कोई गारंटी नहीं दी जाती है। कृपया कोई भी निवेश करने से पहले योजना सूचना दस्तावेज के साथ सत्यापित करें।


AMFI Registration No. 112358 | CIN: U74999MH2016PTC282153
Shepard Technologies Pvt. Ltd. (with ARN code 112358) makes no warranties or representations, express or implied, on products offered through the platform. It accepts no liability for any damages or losses, however caused, in connection with the use of, or on the reliance of its product or related services. Terms and conditions of the website are applicable.
©2026 Shepard Technologies Private Limited. All Rights Reserved
Research Highlights for BOI AXA Mid and Small Cap Equity and Debt Fund